LinkedIn performance reviews are often expected to deliver clarity, yet confusion is frequently created instead. Engagement numbers may appear strong, follower counts may continue to rise, and campaign dashboards may look healthy. Still, questions from clients tend to remain unanswered. Leads may not be improving. Pipeline impact may be unclear. Trust may start to weaken.
In many agency environments, this disconnect is not caused by poor execution. It is usually caused by the wrong analytics tool being used for the wrong business goal. The selection of the best LinkedIn analytics tool is rarely about access to more data. It is about access to the right data, presented in a way that supports real decisions.
What Problem Agency Face in Linkedin Analytics
During monthly client reporting, screenshots from LinkedIn Campaign Manager are often shared. Metrics such as impressions, clicks, and engagement rates are highlighted. However, follow-up questions are usually asked:
- Which campaigns actually influenced lead quality?
- How did organic content support paid performance?
- What changed compared to the previous quarter?
These questions tend to remain unanswered because most LinkedIn analytics tools are designed for platform-level reporting, not agency-level storytelling. As a result, time is spent defending numbers instead of discussing strategy.
Why Business Goals Should Drive Analytics Tool Selection
Different business goals require different analytical depth. A tool that works well for brand awareness may fail completely for demand generation.
For example, when brand visibility is the goal, content reach, follower quality, and engagement trends across time are usually required. When lead generation is the priority, deeper LinkedIn ROI measurement becomes necessary, along with campaign-level context and historical comparisons.
The best LinkedIn analytics tool is not defined by feature volume. It is defined by how closely reporting outputs align with the actual objective being measured.
Common Pain Points Faced by Agencies
Several challenges are repeatedly observed across agencies handling multiple LinkedIn accounts:
- Fragmented data views
Paid and organic performance are often reviewed separately, making it difficult to explain combined impact. - Vanity metrics without context
High engagement is frequently reported without explaining whether it influenced business outcomes. - Manual reporting workflows
Time is often consumed by exporting data, formatting slides, and updating spreadsheets every month. - Inconsistent reporting standards
Each client report may look different, reducing trust and increasing review time.
These pain points are rarely solved by adding more metrics. They are solved by improving how insights are structured and communicated.
Metrics That Actually Matter
In agency environments, metrics are expected to support decisions, not just summaries. Several B2B LinkedIn metrics tend to be more meaningful when reviewed consistently:
- Engagement rate per impression, not just total engagement
- Follower growth quality, based on industry or seniority
- Campaign CTR compared against downstream actions
- Content performance grouped by objective, not format
- Performance trends across months, not isolated snapshots
What Defines a Good LinkedIn Analytics Tool
A good tool is rarely the one with the most charts. It is usually the one that fits agency workflows without friction.
Several qualities are commonly associated with effective LinkedIn analytics for agencies:
- Clear separation between signal and noise
- Flexible views for different stakeholders
- Reliable historical data access
- Automated report generation
- Easy comparison across time periods and accounts
When these elements are missing, reporting accuracy may suffer, and confidence may slowly erode.
Short Agency Scenarios That Reflect Reality
Scenario 1:
A performance team is asked why lead quality dropped despite higher CTR. Without campaign-level trend views, assumptions are made instead of insights.
Scenario 2:
An account manager prepares five LinkedIn reports manually every month. Strategy discussions are shortened because reporting consumes too much time.
Scenario 3:
A client requests a quarterly comparison. Data exports are repeated, numbers are rechecked, and inconsistencies are found too late.
These scenarios are not edge cases. They are common outcomes of limited LinkedIn reporting dashboard capabilities.
The Shift Toward All-in-One Reporting
To reduce friction, many agencies are gradually moving toward all-in-one reporting environments. Instead of relying only on native dashboards, LinkedIn data is being consolidated into unified views alongside other channels.
This approach allows client reporting for LinkedIn to be standardized, automated, and reviewed in context. Trends become easier to explain. Insights become easier to trust. Time is redirected from formatting to analysis.
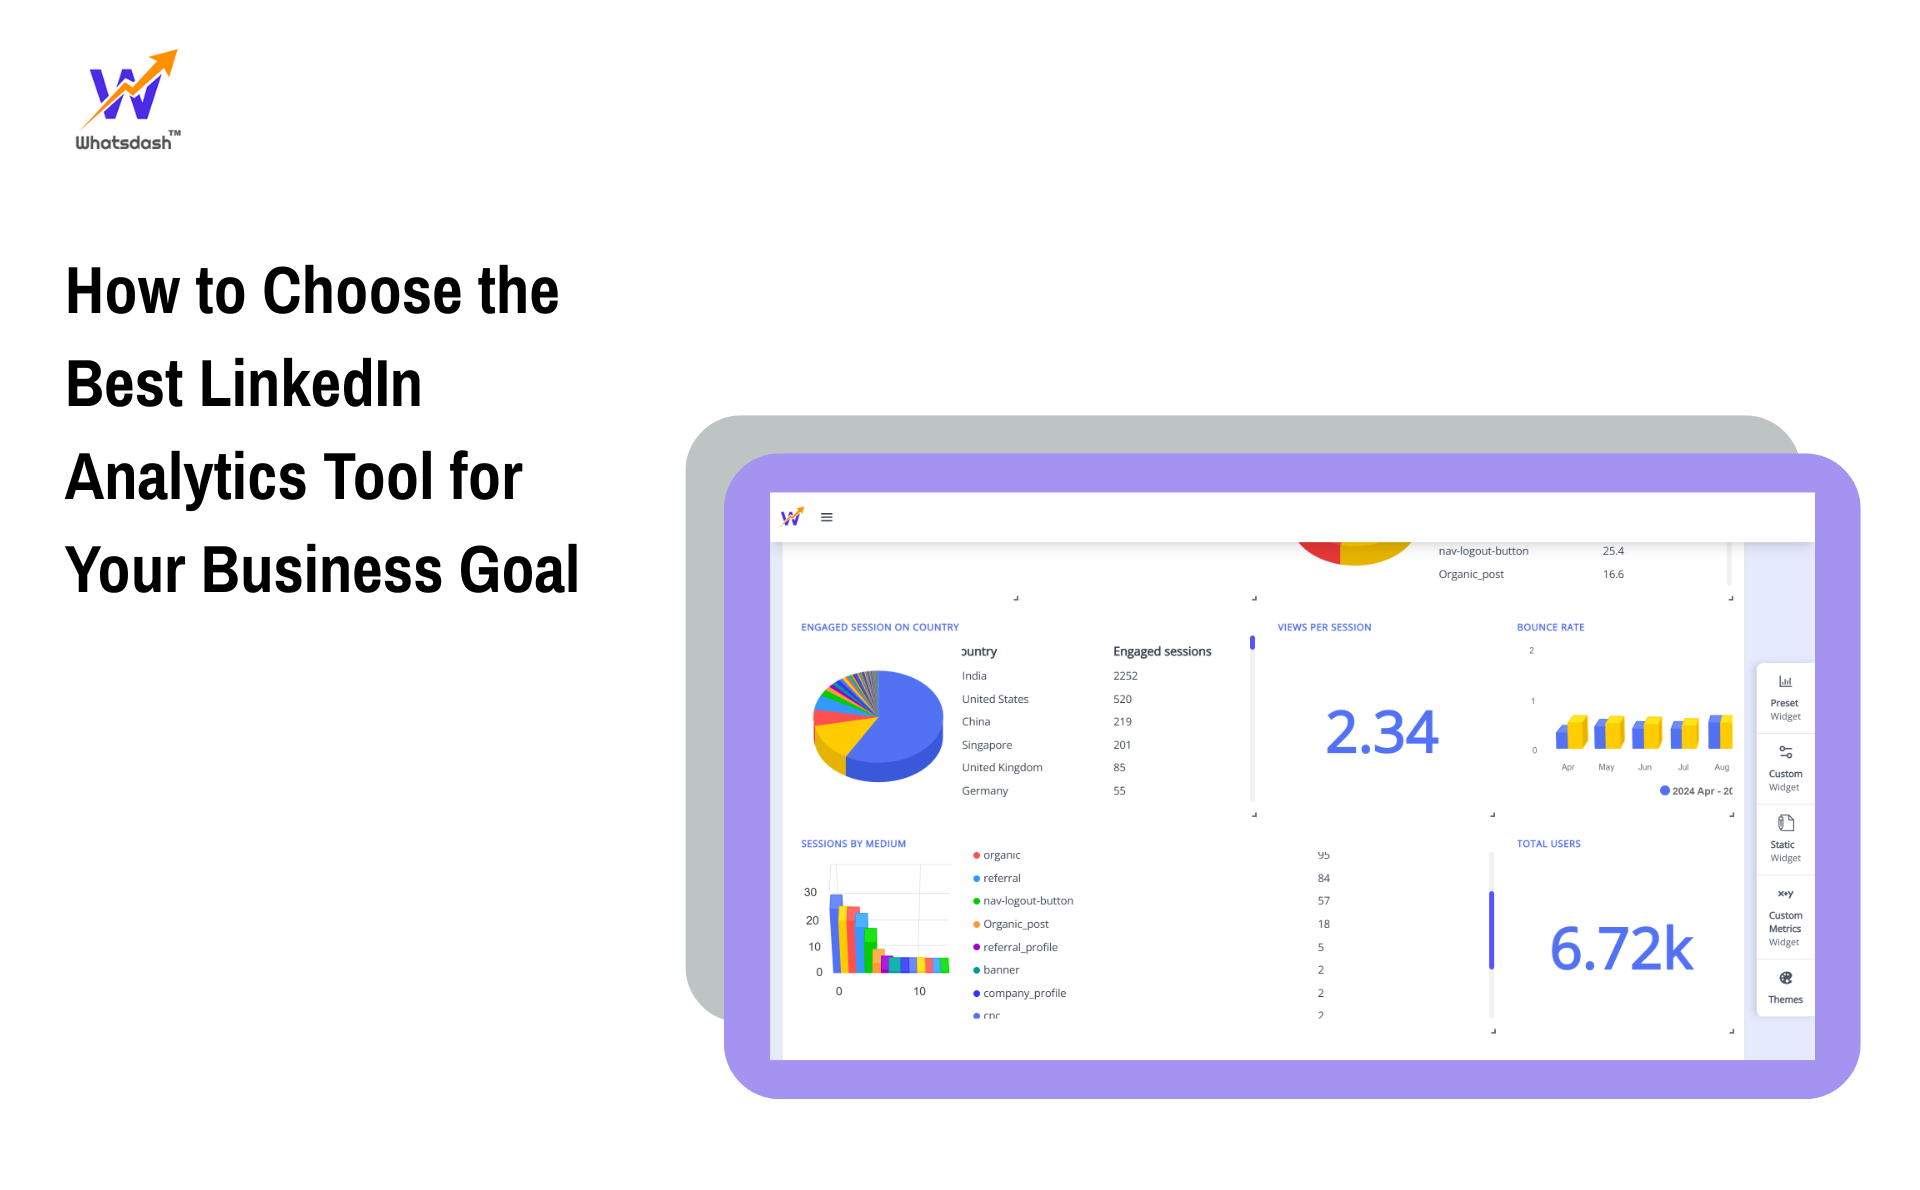
Within this shift, platforms such as Whatsdash are sometimes adopted because LinkedIn analytics can be pulled into a single, no-code reporting structure. Campaign and content performance can be reviewed together, and recurring reports can be automated without manual effort. This type of setup is often chosen not for features, but for operational clarity.
Comparing Tools Without Chasing Features
During any LinkedIn analytics tools comparison, feature lists tend to look impressive. However, a better evaluation framework is usually based on long-term fit:
- Can reporting scale as more clients are added?
- Are insights easy to explain during live reviews?
- Is time being saved every reporting cycle?
- Are decisions being influenced by the data shown?
When these questions are answered honestly, the best choice often becomes clearer.
SEO, SGE, and Decision-Friendly Reporting
Search behaviour has shifted toward practical guidance. Questions such as “Which LinkedIn metrics actually matter for ROI?” or “How should LinkedIn performance be reported to clients?” are increasingly common.
Articles and tools that answer these questions directly tend to perform better in AI overviews and SGE results. Clear structure, realistic scenarios, and experience-based explanations are rewarded over generic summaries.
Final Tip Before Choosing Any Tool
Before any commitment is made, internal reporting should be reviewed first. If insights are difficult to explain internally, they will be even harder to explain to clients. The right analytics tool should reduce explanation time, not increase it.
Conclusion
Choosing the best LinkedIn analytics tool is not a technical decision. It is a strategic one. When analytics are aligned with real business goals, reporting becomes clearer, conversations become more productive, and trust becomes easier to maintain.
For agencies managing complex LinkedIn activity, tools that support automated LinkedIn reporting, meaningful metrics, and unified dashboards are increasingly preferred. Solutions like Whatsdash are sometimes selected in this context because reporting workflows are simplified without adding noise.
Ultimately, the right choice is defined not by what a dashboard shows, but by what decisions are improved because of it.