Marketing reports often fail for one simple reason: clients don’t struggle with too little data, they struggle with too much unclear data. Traffic numbers rise, impressions increase, dashboards fill up—but the same client question keeps coming back: “Is this actually working for my business?”
This is where Marketing KPIs matter. Not as technical metrics, but as shared decision-making tools between agencies and clients. When KPIs are explained clearly, expectations align, trust improves, and conversations move away from vanity numbers toward business outcomes.
This guide breaks down marketing KPIs in plain language, explains why agencies and clients see them differently, and shows how agencies can present KPIs in a way clients genuinely understand and care about.
What Are Marketing KPIs?
Marketing KPIs (Key Performance Indicators) are measurable signals used to evaluate whether marketing activities are moving toward defined goals. Unlike raw metrics, KPIs always answer a “so what?” question.
For example:
- Website sessions are a metric
- Qualified leads generated from organic traffic is a KPI
In client terms, marketing KPIs connect marketing activity to business impact—growth, revenue, pipeline, or brand visibility that leads to sales. When marketing KPIs are explained clearly, they help clients understand progress, not just performance.
Why Marketing KPIs for Agencies Are Different
Agencies naturally work with complex marketing performance metrics: click-through rates, keyword visibility, assisted conversions, and attribution paths. Clients, however, evaluate success differently.
This difference exists because:
- Agencies measure optimization progress
- Clients measure business outcomes
A rising CTR might excite a marketing team, but clients care more about enquiries, bookings, or sales. This gap is where confusion often begins. Marketing KPIs for agencies must be filtered, prioritized, and reframed into outcomes clients can act on.
The Most Important Marketing KPIs Clients Should Understand
Not every KPI deserves client attention. Overloading reports reduces clarity and weakens confidence. The most important marketing KPIs typically fall into four categories:
- Growth KPIs: Leads, conversions, sales volume
- Efficiency KPIs: Cost per lead, return on ad spend, acquisition cost
- Quality KPIs: Lead quality, conversion rate, engagement time
- Visibility KPIs: Organic visibility, impression share, brand reach
These KPIs help clients connect marketing effort with commercial impact—especially when trends are explained over time, not in isolation.
How to Explain Marketing KPIs to Clients
Explaining KPIs well is less about technical depth and more about communication structure.
Step 1: Start with the business goal
KPIs should always be introduced in relation to a client goal—revenue growth, lead volume, or market expansion.
Step 2: Explain what changed, not just what happened
Instead of stating numbers, changes over time should be highlighted. Trends create understanding.
Step 3: Connect cause and effect
Clients respond better when KPIs are linked to actions taken—campaign changes, content updates, or targeting improvements.
Step 4: Use benchmarks and context
KPIs make sense when compared to previous periods, industry benchmarks, or agreed targets.
Step 5: End with implications, not data
Every KPI explanation should conclude with “what this means” and “what happens next.” This approach turns KPI reporting into a conversation, not a data dump.
KPIs Clients Actually Care About (With Examples)
Clients consistently engage more with KPIs tied directly to revenue or opportunity creation.
Client Goal | KPI | Why It Matters |
Lead Growth | Cost per Lead | Indicates efficiency of spend |
Sales Impact | Conversion Rate | Shows quality of traffic |
ROI | Revenue from Marketing | Links effort to income |
Market Presence | Organic Visibility | Signals long-term growth |
Retention | Repeat Conversions | Shows sustainability |
These KPIs clients actually care about reducing defensive reporting conversations and creating clearer accountability.
Marketing KPI Reporting: Turning Data Into Insight
Raw KPI data rarely builds trust on its own. Insight is created when data is structured, prioritised, and explained.
Effective marketing KPI reporting focuses on:
- Fewer KPIs with clearer narratives
- Visual trend analysis instead of static numbers
- Consistent definitions across channels
When reporting is structured around insight, not volume, clients become more confident in decisions—and less likely to question every metric.
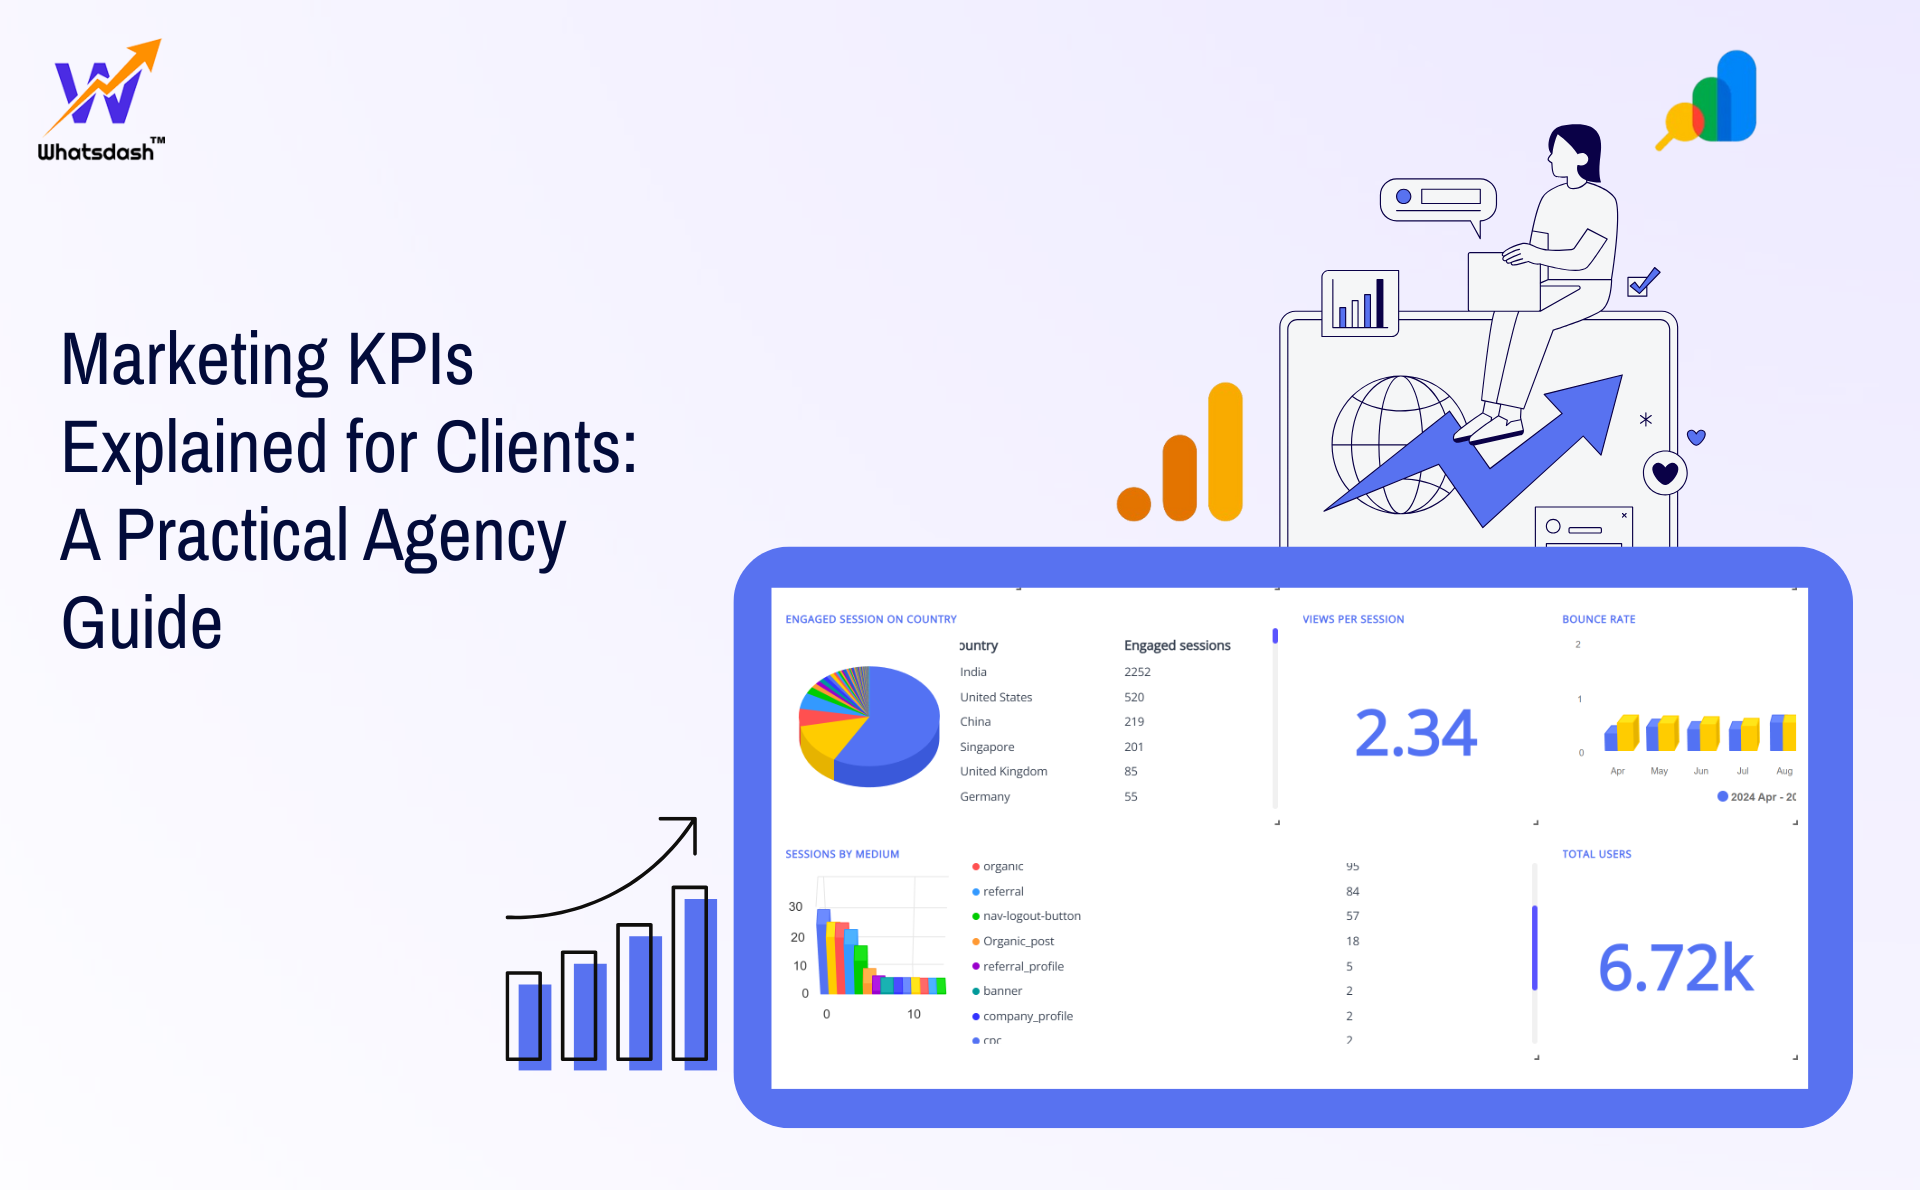
Using a Marketing Reporting Dashboard to Explain KPIs
A marketing reporting dashboard plays a critical role in client understanding. Static spreadsheets often hide insights, while dashboards make patterns visible instantly.
Client-friendly dashboards typically:
- Group KPIs by goal, not channel
- Highlight trends using time comparisons
- Avoid unnecessary technical metrics
- Update automatically to maintain accuracy
When KPIs are visualized correctly, explanations become shorter and clearer, improving both meeting efficiency and client confidence.
Common Mistakes Agencies Make With Marketing KPIs
Several recurring mistakes weaken KPI communication:
- Reporting too many KPIs at once
- Using platform language instead of business language
- Highlighting wins without explaining trade-offs
- Focusing on short-term fluctuations over long-term trends
- Changing KPI definitions mid-campaign
These issues often lead to confusion, unrealistic expectations, and strained client relationships—despite good performance.
How Whatsdash Can Help on That Matter
Clear KPI communication becomes difficult when data lives across multiple tools. Whatsdash helps agencies consolidate marketing KPIs into a single reporting view, reducing manual effort and inconsistency.
With Whatsdash:
- KPIs can be standardised across SEO, paid ads, and analytics
- Client-facing dashboards stay focused on business outcomes
- Automated updates reduce reporting errors and delays
- Visual trends make KPI explanations simpler and faster
This allows agencies to spend less time compiling reports and more time explaining insights—without changing how KPIs are defined or communicated.
Conclusion
Marketing KPIs are not just performance indicators—they are trust indicators. When KPIs are explained clearly, clients feel informed, involved, and confident in agency decisions.
Client-friendly KPI communication is built on:
- Clear goal alignment
- Fewer, more meaningful KPIs
- Visual reporting
- Consistent explanation
Agencies that master this approach don’t just report better—they retain clients longer and build stronger partnerships through clarity, not complexity.