SEO agencies sit on mountains of data. Google Analytics 4 shows engagement and conversions. Google Search Console shows queries, impressions, and rankings. Rank trackers show position changes. Backlink tools show authority and link velocity.
Individually, each tool is useful.
Together, they’re chaotic.
Clients don’t want four tools, five exports, and a spreadsheet. They want a clear story:
- Are we growing?
- What changed?
- Why did it change?
- What should we do next?
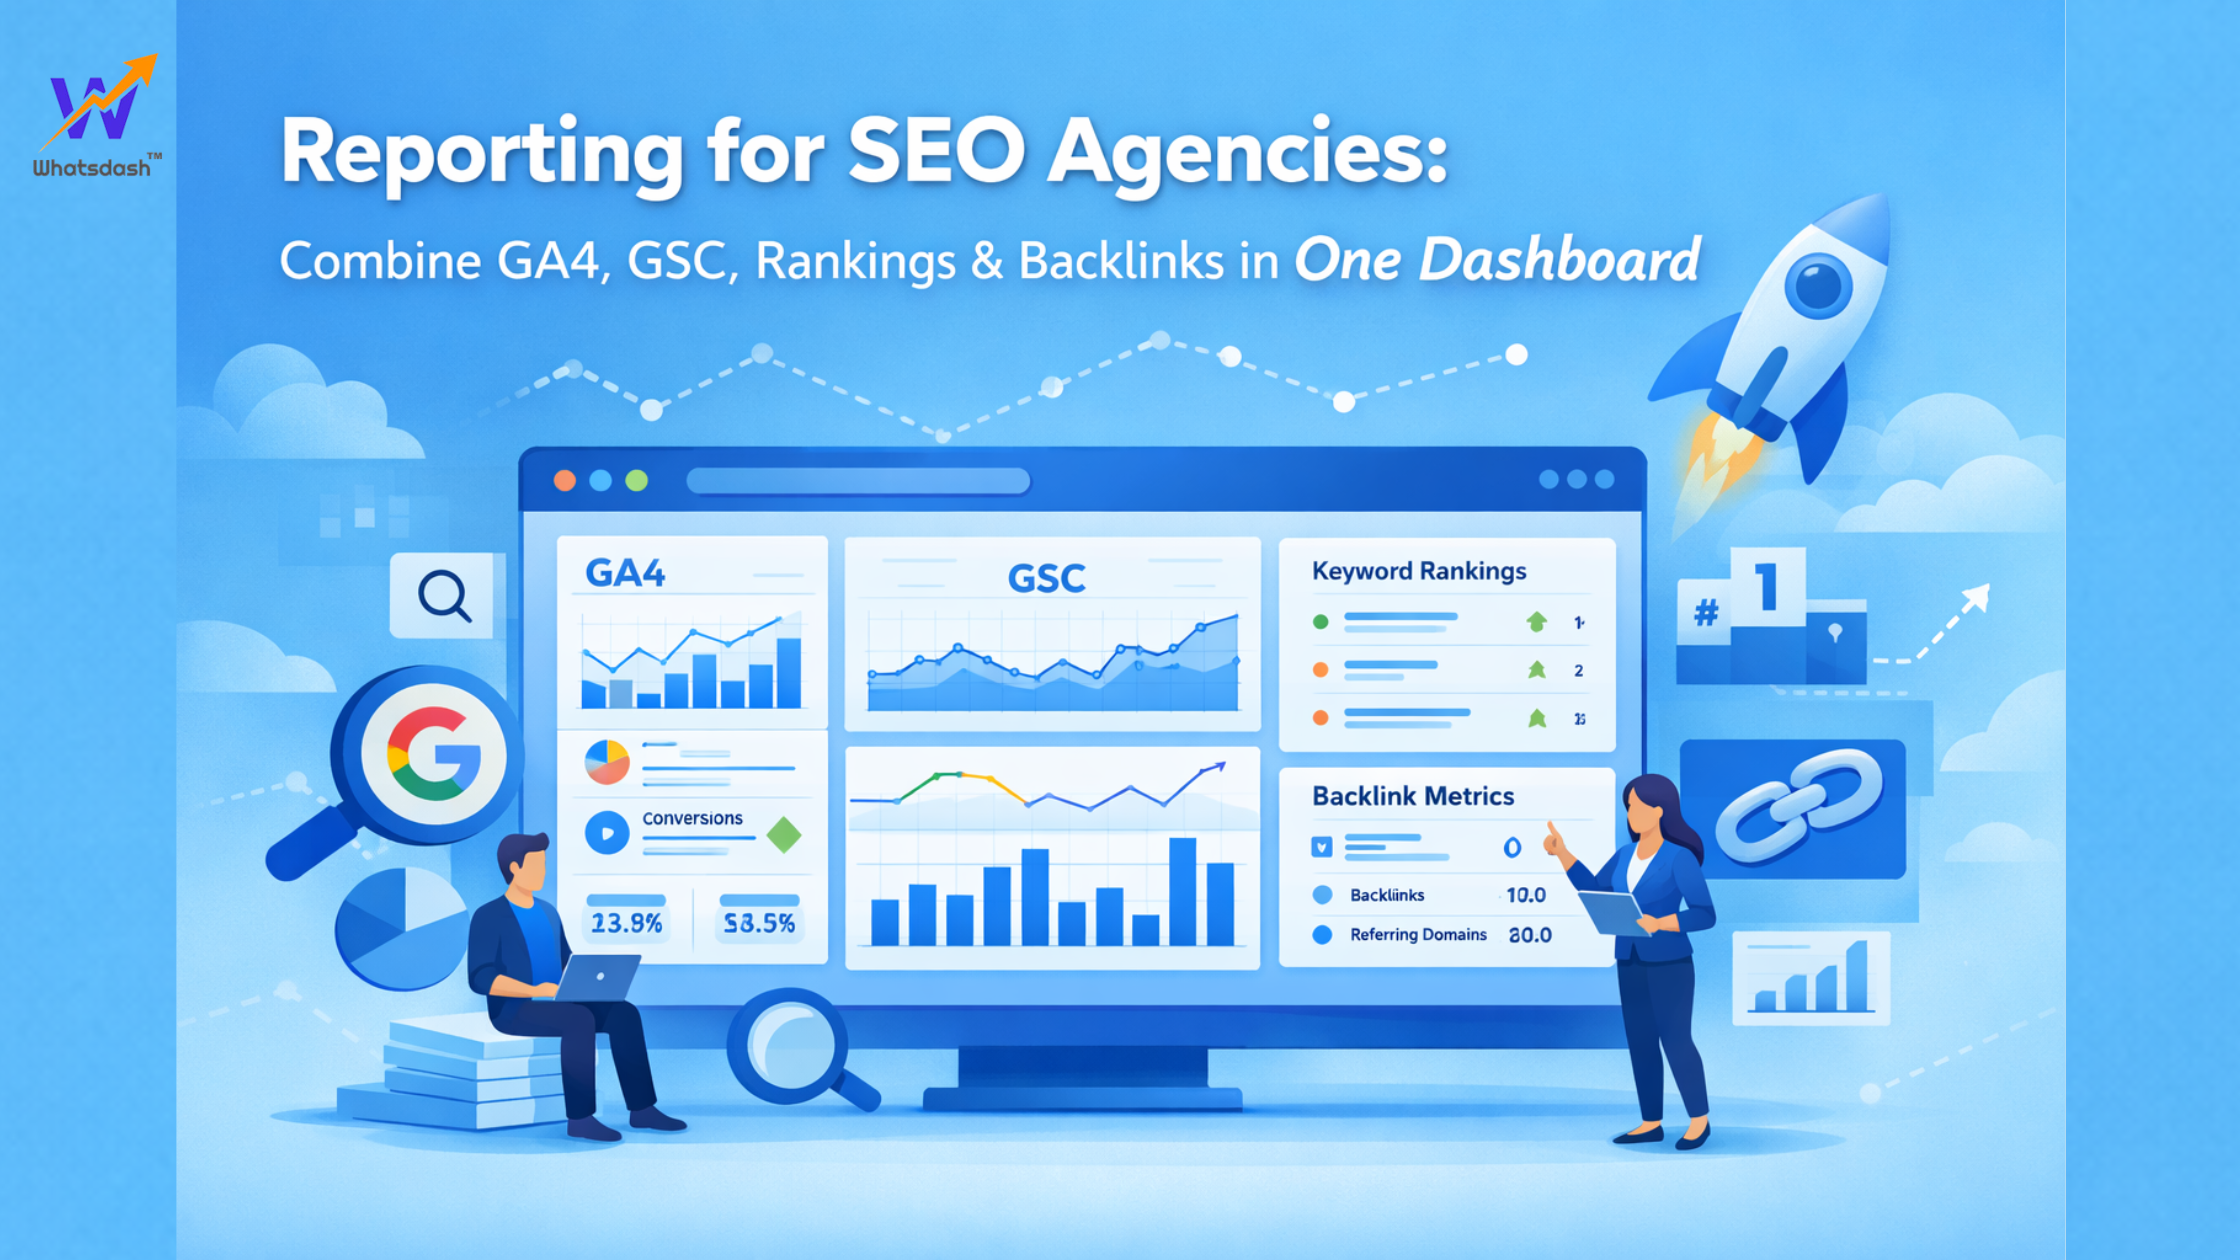
This is why modern SEO agencies are moving toward unified SEO dashboards, single views that combine GA4, GSC, rankings, and backlinks into one actionable reporting experience.
This article explains how and why SEO agencies should consolidate their reporting, what metrics matter most, and how a unified dashboard turns SEO reports into strategic assets instead of monthly chores.
Why Traditional SEO Reporting Fails
Data lives in silos
SEO reporting typically pulls from:
- GA4 (behavior & conversions)
- GSC (queries & visibility)
- Rank trackers (SERP positions)
- Backlink tools (authority & trust)
When these are reviewed separately:
- Rankings rise, but traffic falls
- Traffic grows, but conversions stagnate
- Backlinks increase, but rankings don’t move
Without a unified view, agencies can’t explain why.
Clients don’t understand SEO tools
Clients don’t log into GA4 or GSC daily. They don’t know what “average position” or “engagement rate” means in isolation.
They want:
- Outcomes
- Trends
- Explanations
- Recommendations
Disconnected tools don’t deliver clarity.
Manual reporting wastes time
Most SEO agencies spend:
- 4–8 hours per client per month
- Exporting data
- Aligning date ranges
- Rebuilding charts
- Writing summaries
This is unscalable.
What a Unified SEO Dashboard Solves
A unified SEO dashboard brings together:
- Visibility (GSC)
- Engagement (GA4)
- Rankings (SERP tools)
- Authority (backlinks)
- Outcomes (conversions & revenue)
In one place.
This enables agencies to:
- Explain performance clearly
- Spot issues early
- Tie SEO work to business impact
- Scale without adding headcount
The 4 Pillars of SEO Reporting (Unified)
A strong SEO dashboard is built on four core pillars.
Pillar 1: Search Visibility (Google Search Console)
This answers: Can people find us?
Key metrics:
- Total impressions
- Total clicks
- Average position
- CTR
- Top queries
- Top landing pages
Insights:
- Which keywords drive visibility
- Where CTR is underperforming
- Which pages deserve optimization
Pillar 2: Engagement & Behavior (GA4)
This answers: What do users do after they arrive?
Key metrics:
- Organic sessions
- Engagement rate
- Pages per session
- Session duration
- Scroll depth
- Organic conversion rate
Insights:
- Whether traffic is qualified
- Which pages engage users
- Where intent breaks down
Pillar 3: Rankings & Competitive Position
This answers: How do we compare in search results?
Key metrics:
- Keywords in Top 3 / Top 10 / Top 20
- Ranking changes (WoW / MoM)
- Competitor comparison
- SERP volatility
Insights:
- Momentum vs stagnation
- Keyword groups that need focus
- Competitive gaps
Pillar 4: Authority & Trust (Backlinks)
This answers: Why should Google trust us?
Key metrics:
- Referring domains
- New vs lost links
- Domain authority / DR
- Anchor text distribution
- Toxic links
Insights:
- Whether link-building is effective
- Authority growth trends
- Risk signals
The Ideal Unified SEO Dashboard Structure
To make insights actionable, structure matters.
Section 1: Executive SEO Summary (AI-assisted)
This should answer, in plain language:
- What improved?
- What declined?
- Why did it happen?
- What should we do next?
This is the most valuable section for clients.
Section 2: Organic Traffic Overview (GA4)
Visuals:
- Organic sessions over time
- Engagement rate trends
- Organic conversion rate
Client takeaway:
“Is SEO bringing valuable traffic?”
Section 3: Search Visibility & Queries (GSC)
Visuals:
- Impressions & clicks trends
- Top queries
- Top landing pages
Client takeaway:
“How visible are we in search?”
Section 4: Rankings Distribution
Visuals:
- Keywords by position bucket
- Ranking movement charts
- Competitor overlays
Client takeaway:
“Are we winning SERPs?”
Section 5: Backlinks & Authority
Visuals:
- Referring domains growth
- New vs lost links
- Authority score trends
Client takeaway:
“Are we building long-term SEO strength?”
Section 6: Content & Page Performance
Visuals:
- Top organic pages
- Page-level engagement
- Keyword-to-page mapping
Client takeaway:
“Which content drives results?”
Section 7: SEO → Conversion Impact
Visuals:
- Organic conversions
- Assisted conversions
- Revenue attribution (if applicable)
Client takeaway:
“Is SEO driving business outcomes?”
Turning SEO Data Into Actionable Insights
Unified dashboards aren’t about data, they’re about decisions.
Example 1: Rankings Up, Traffic Flat
Unified view shows:
- Rankings improved
- CTR declined
- SERP features increased
Decision:
- Optimize titles/meta descriptions
- Add structured data
- Improve snippet appeal
Example 2: Traffic Up, Conversions Down
Unified view shows:
- Organic sessions increased
- Engagement rate dropped
- Conversion rate declined
Decision:
- Audit landing pages
- Improve intent alignment
- Add internal links to high-converting pages
Example 3: Backlinks Growing, Rankings Stagnant
Unified view shows:
- Referring domains increasing
- Rankings flat
- Content thin on key pages
Decision:
- Strengthen on-page content
- Improve topical depth
- Align links to priority pages
Why SEO Agencies Need Automation
Manual SEO reporting doesn’t scale.
Automation enables:
- Daily data sync
- Consistent KPIs
- Automated summaries
- Scheduled client reports
- Real-time dashboards
This reduces reporting time by 60–90%.
Agencies move from:
“Preparing reports”
to
“Interpreting insights.”
Multi-Client SEO Dashboards: A Growth Advantage
For agencies managing many SEO clients, multi-client views unlock new value:
- Spot algorithm impact across accounts
- Identify winning content patterns
- Compare industries
- Forecast workload
- Detect churn risk early
SEO leaders stop managing accounts in isolation and start managing performance portfolios.
Common SEO Reporting Mistakes to Avoid
- Reporting rankings without traffic context
- Reporting traffic without conversion context
- Reporting backlinks without authority impact
- Too many KPIs
- No narrative or recommendations
- Monthly-only visibility
Unified dashboards eliminate these mistakes by design.
How Tools Like Whatsdash Enable Unified SEO Reporting
Modern platforms like Whatsdash are built for this exact use case:
- GA4 + GSC integration
- Rankings & backlink connectors
- Custom SEO KPIs
- Drag-and-drop dashboards
- AI summaries
- Automated reports
- Multi-client views
They turn SEO reporting into a strategic system, not a monthly task.
The Future of SEO Reporting
SEO reporting is evolving from:
- Static → Real-time
- Manual → Automated
- Fragmented → Unified
- Descriptive → Prescriptive
Agencies that adopt unified dashboards:
- Deliver clearer value
- Retain clients longer
- Scale faster
- Operate with higher margins
Summary : SEO Reporting Should Explain, Not Just Display
SEO success isn’t measured by rankings alone. It’s measured by visibility, engagement, authority, and business impact—together.
By combining GA4, GSC, rankings, and backlinks into one dashboard, SEO agencies:
- Save time
- Reduce confusion
- Deliver clarity
- Drive better decisions
- Prove real ROI
Unified SEO dashboards don’t just improve reporting.
They elevate agencies from vendors to strategic partners