Facebook Ads
Facebook Ads is Meta's powerful advertising platform, enabling businesses to create, target, and manage paid campaigns across Facebook, Instagram, Messenger, and Audience Network to reach specific audiences and drive measurable results.
Connecting Facebook Ads to Whatsdash lets you quickly and easily review your Ad Spend, Conversions, Return on Ad Spend (ROAS), and Cost per Result across all campaigns, ad sets, and ads, centralized alongside your website and sales data.
Why Connect Facebook Ads to Whatsdash?
Integrating your Facebook Ads data with Whatsdash transforms raw performance metrics from Ads Manager into clear, actionable business intelligence, essential for optimizing your budget and maximizing ROI.
-
Campaign Performance Audit : Monitor granular metrics like CPC, CTR, Frequency, and CPA by Ad, Ad Set, or Campaign, allowing for fast, data-driven optimization decisions.
-
Cross-Channel ROI Analysis : Blend Facebook Ads Amount Spent and Conversions with GA4 data to determine true Return on Ad Spend (ROAS) and budget allocation across platforms.
-
Simplified Reporting & Collaboration : Automatically generate clean, visual reports for clients or stakeholders without having to manually export data from Meta Ads Manager.
📋 Steps to Integrate your Facebook Ads Account to Whatsdash
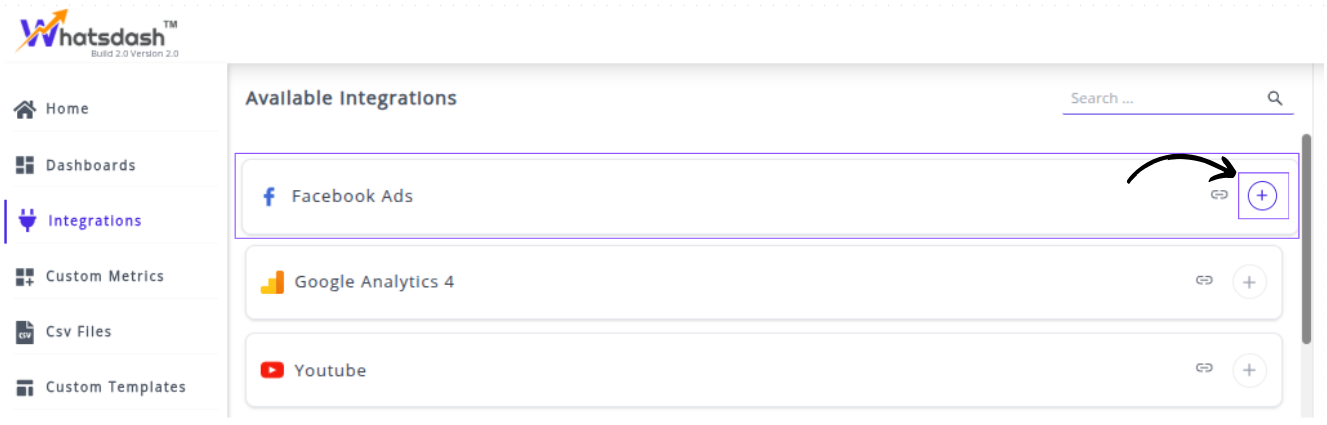
✔️ Navigate to the 'Integrations' page using the Navigation bar.
✔️ Select Facebook Ads from the Available Integrations.

✔️ Click the + button to open the Facebook authorization window.
✔️ You will be redirected to a Facebook login and authorization page. Select the Facebook account that is an administrator or editor of the Facebook Business Page you want to track.

✔️ Grant Whatsdash the necessary permissions to Read your Facebook Page Insights data.
✔️ Once authenticated, you will be directed back to Whatsdash. Your Facebook Insights Integration will appear in the Connected Integrations list.

✔️ You can now create or customize dashboards using your Facebook Ads Metrics and Dimensions.
👉 How to visualize this data in your dashboard, visit the Dashboard Documentation Guide
🔗 Facebook Ads Metrics
Below is a comprehensive list of Facebook Ads metrics, categorized by purpose.
| Name | Category | Description |
|---|---|---|
| Cost per 3-Second Video View | Engagement | The average cost for each 3-second video view. |
| Appointments Scheduled | Conversion | The number of schedule events tracked by the pixel on your website and attributed to your ads. |
| 30-Second Video Views | Engagement | The number of times the video was watched for a total of at least 30 seconds, or nearly its total length. |
| Applications Submitted | Conversion | The number of submit application events tracked by the pixel on your website and attributed to your ads. |
| 3-Second Video Views | Engagement | The number of times your video was watched for at least 3 seconds or nearly its full length. |
| Actions | Performance | Total actions users took that can be directly attributed to the ads (engagement, clicks, or conversions). |
| Applications Submitted Conversion Value | Conversion | Total value of submit application events tracked with the conversions objective. |
| Appointments Scheduled Conversion Value | Conversion | Total value of schedule events tracked with the conversions objective. |
| Cost per Applications Submitted | Conversion | Average cost of each submit application event. |
| Cost per Event Response | Engagement | Average cost for each event response. |
| Cost Per Inline Post Engagement | Engagement | Average cost of each inline post engagement. |
| Cost per Landing Page View | Engagement | Average cost for each landing page view. |
| Cost per Outbound Click | Engagement | Average cost for each outbound click. |
| Cost per Post Engagement | Engagement | Average cost of each post engagement. |
| Cost per Post Share | Engagement | Average cost of each post share. |
| Cost per Website Checkout Initiated | Conversion | Average cost of each initiated website checkout. |
| Cost per Website Purchase | Conversion | Average cost of each website purchase. |
| CTR (Link Click-Through Rate) | Engagement | Percentage of times users saw the ad and completed a link click. |
| Frequency | Performance | Average number of times each user saw the ad. |
| Inline Post Engagement | Engagement | Total number of actions users took involving the ads (or posts). |
| Link Clicks | Engagement | Number of clicks on ad links to select destinations or experiences. |
| Location Searches | Conversion | Number of find location events tracked by the pixel on your website. |
| Page Likes | Engagement | Number of Facebook Page likes attributed to your ads. |
| People Taking Actions | Performance | Total number of users who took an action attributed to the ads. |
| Products Customized | Conversion | Number of customize product events tracked by the pixel and attributed to your ads. |
| ROI (Return on Investment in %) | Conversion | ROI percentage based on conversion value minus cost, divided by campaign cost. |
| Amount Spent | Performance | Estimated total amount of money spent on the campaign, ad set, or ad. |
| Unique Clicks (All) | Engagement | Total number of unique users who clicked on the ad. |
| Website Purchases Conversion Value | Conversion | Total value of website purchases conversions. |
| Website Registration Completed | Conversion | Number of completed registration events tracked and attributed to your ads. |
| Clicks (All) | Performance | Total number of clicks on an ad. |
| Contacts | Conversion | Number of contact events tracked by the pixel and attributed to your ads. |
| Contacts Conversion Value | Conversion | Total value of contact events tracked with the conversions objective. |
| Cost per Contacts | Conversion | Average cost of each contact event. |
| CPC (Cost per Inline Link Click) | Engagement | Average cost for each inline link click. |
| Cost per Page Mention | Engagement | Average cost of each Facebook Page mention. |
| Cost per ThruPlay | Engagement | Average cost for each ThruPlay. |
| Cost Per Unique Action | Performance | Cost divided by total unique users who took an action attributed to the ads. |
| Cost per Website Registration Completed | Conversion | Average cost of each website registration completed. |
| Event Responses | Engagement | Number of people who responded "Interested" or "Going" to a Facebook event. |
| Link Clicks Conversion Rate | Conversion | Number of conversions divided by number of link clicks. |
| Outbound Clicks | Engagement | Clicks on links that take people off Facebook-owned properties. |
| Return on Ad Spend (ROAS in $) | Conversion | Total return on ad spend from website conversions in currency. |
| ThruPlays | Engagement | Number of times your video was played to completion or at least 15 seconds. |
| Total Leads | Conversion | Number of leads attributed to your ads (on and off Facebook). |
| Website Adds To Cart | Conversion | Number of add-to-cart events tracked and attributed to your ads. |
| Website Leads | Conversion | Number of lead events tracked by the pixel and attributed to your ads. |
| Cost per Appointments Scheduled | Conversion | Average cost of each schedule event. |
| Cost per On-Facebook Lead | Conversion | Average cost of each On-Facebook Lead. |
| Cost per Page Like | Engagement | Average cost for each Facebook Page like. |
| Cost per Post Comment | Engagement | Average cost for each post comment. |
| Cost per Subscriptions | Conversion | Average cost of each subscribe event. |
| Cost per Total Leads | Conversion | Average cost of each total lead event. |
| Cost per Website Add To Cart | Conversion | Average cost of each website add-to-cart event. |
| Cost per Website Content Views | Conversion | Average cost of each website content view. |
| Cost Per Unique Click (All) | Engagement | Average cost for each unique click (all). |
| CPM (Cost per 1000 Impressions) | Performance | Average cost for 1,000 impressions. |
| CTR (All) | Performance | Percentage of times users saw the ad and clicked (all). |
| Landing Page Views | Engagement | Number of times users viewed your ad’s destination URL after clicking. |
| On-Facebook Leads | Conversion | Number of leads submitted directly on Facebook-owned platforms. |
| Outbound CTR | Engagement | Percentage of times users saw your ad and performed an outbound click. |
| Post Comments | Engagement | Number of comments on your ads. |
| Post Shares | Engagement | Number of times your ads were shared. |
| Reach | Performance | Total number of unique users who saw the ads at least once. |
| Subscriptions | Conversion | Number of subscribe events tracked and attributed to your ads. |
| Total Conversion Value | Performance | Total value of all conversions attributed to the ad. |
| Unique Link Clicks | Engagement | Number of people who performed a link click. |
| Video Watches at 100% | Engagement | Number of times a video was watched to completion. |
| Website Checkouts Initiated | Conversion | Number of initiated checkout events tracked by the pixel. |
| Website Content Views | Conversion | Number of view-content events recorded by the pixel. |
| Website Purchase ROAS (Return on Ad Spend - $) | Conversion | ROAS from website purchases in currency. |
| Cost Per Any Action | Performance | Total cost divided by number of actions taken on an ad. |
| CPC (Cost per Link Click) | Engagement | Average cost for each link click. |
| Cost per Location Searches | Conversion | Average cost for each find location event. |
| Cost per Post Reaction | Engagement | Average cost for each post reaction. |
| Cost per Products Customized | Conversion | Average cost for each product customization event. |
| Cost per Unique Link Click | Engagement | Average cost for each unique link click. |
| Cost per Website Lead | Conversion | Average cost for each website lead. |
| CPC (All) | Performance | Average cost for all clicks. |
| Cost per 1000 People Reached | Performance | Reach of ad divided by total cost, multiplied by 1,000. |
| Impressions | Performance | Number of times an ad was displayed (including repeats). |
| Inline Link Clicks | Engagement | Clicks on links to select destinations or experiences within ads. |
| Location Searches Conversion Value | Conversion | Total value of find location events tracked with the conversions objective. |
| Page Engagement | Engagement | Total number of attributed actions taken on your Page or posts. |
| Page Mentions | Engagement | Number of times your Page was mentioned in posts or comments. |
| Post Engagement | Engagement | Total number of actions people took involving your ads. |
| Post Reactions | Engagement | Number of reactions (Like, Love, Wow, etc.) on your ads. |
| Products Customized Conversion Value | Conversion | Total value of customize product events tracked with the conversions objective. |
| Return on Ad Spend (ROAS in %) | Conversion | Percentage-based return on ad spend from website conversions. |
| ROI (Return on Investment in $) | Conversion | ROI in currency calculated from conversion value minus cost. |
| Subscribe Conversion Value | Conversion | Total value of subscribe events tracked with the conversions objective. |
| Unique CTR (All) | Engagement | Percentage of people who saw the ad and performed a unique click. |
| Website Purchases | Conversion | Number of purchase events tracked by the pixel. |
| Website Purchase ROAS (Return on Ad Spend - %) | Conversion | Percentage-based ROAS from website purchases. |
🔗 Facebook Ads Dimensions
The table below lists the Facebook Ads Dimensions available through the Whatsdash Facebook Ads Integration.
| Name | Category | Why It’s Useful |
|---|---|---|
| Ad ID | Performance | Identifies each ad uniquely, allowing precise tracking and troubleshooting. |
| Device Category (Desktop / Mobile) | Performance | Shows whether users engage more on mobile or desktop, helping optimize device targeting. |
| Ad Set | Performance | Analyzes results grouped by ad sets to adjust audience, bid, or creative strategies. |
| Ad Name | Performance | Useful for comparing the performance of specific ad creatives by name. |
| Ad with Image | Performance | Displays ad creatives alongside performance data for visual context and review. |
| Gender | Performance | Helps determine which gender group responds better to your ads. |
| Action Type | Performance | Breaks down actions (clicks, likes, shares, etc.) to identify high-performing interactions. |
| Ad Account Name | Performance | Distinguishes data across multiple ad accounts under the same business. |
| Region | Performance | Provides insight into which regions perform best, useful for localizing campaigns. |
| Ad Account Name (with ID) | Performance | Prevents confusion between accounts with similar names by using unique IDs. |
| Platform & Device | Performance | Highlights where your ads perform best — e.g., Facebook Mobile Feed vs. Instagram Stories. |
| Age | Performance | Reveals which age groups are most engaged, aiding in demographic targeting. |
| Campaign Name | Performance | Links results directly to campaigns, simplifying reporting and comparison. |
| Country ISO Code | Performance | Standardized country code helps in exporting and filtering international campaign data. |
| Impression Device | Performance | Identifies which devices users used to view ads for better optimization. |
| Placement | Performance | Analyzes where your ads were shown (e.g., Feed, Reels, Marketplace) to improve delivery strategy. |
| Platform | Performance | Distinguishes between platforms (Facebook, Instagram, Messenger, etc.) for cross-platform insights. |
|
🔗 Explore More Integrations
Whatsdash supports a wide range of marketing, analytics, and eCommerce integrations to give you a holistic view of your business performance.
👉 Visit the Integrations Page to explore all available connections