Welcome to Whatsdash Documentation
Welcome to the official documentation for Whatsdash —your all-in-one platform for centralizing, visualizing, and automating reports on your business data.
This documentation serves as a complete guide for understanding, navigating, and leveraging Whatsdash, a comprehensive solution for streamlined reporting and operational efficiency.
Key Areas of Whatsdash
WhatsDash is structured around three core sections, each designed to make managing and analyzing your data seamless:
-
HOME PAGE
The Home Page is your starting point after logging in and serves as your central command center.Click here to go to the WhatsDash Home Page.
-
Account Overview : A high-level summary of your workspace, displaying the total number of connected data sources and the number of active dashboards you manage.
-
Onboarding Tour : A guided, step-by-step walkthrough designed for new users. This tour highlights key application areas, such as the Dashboard creation flow and the Integrations setup process, ensuring you get started quickly and efficiently.
-
Quick Access Panel : This dynamic panel is designed for speed and includes:
-
Instant access to your most recently edited dashboards.
-
A "Create First Dashboard" shortcut for new users to start immediately.
-
Links to frequently used resources like the available Integrations list, the Metrics Library, and Custom Templates.
-
-
Book a Demo/Support Call : A dedicated, easily accessible link that allows you to quickly schedule a consultation with the WhatsDash support team for technical help, or with the sales team for a product demo or account inquiries.
-
-
DASHBOARD PAGE
The Dashboard Page is the core workspace where you transform raw data into insightful visual reports.

Whatsdash offers powerful features for ultimate customization and automation.
-
Customization : Build dashboards from scratch using various tools and resources. You can begin by exploring our extensive library of Preset Templates or by leveraging your own saved Custom Templates.
If you're a new user, you can Create your first Dashboard right here to start visualizing your data immediately.
-
Organized Management : Easily group dashboards under a single unit to keep your reporting views neatly organized and simple to find.
-
Instant Access & Editing : Enjoy one-click access that instantly loads the latest data, allowing you to immediately review metrics and seamlessly enter the editing environment for quick modifications to widgets.
-
Rapid Creation with Templates : Speed up report building using a library of Preset Templates, pre-configured for common business needs, or save your own layouts as Custom Templates to maintain consistency across all your projects.
-
-
INTEGRATIONS
The Integrations Page is where you securely link all your external data sources to the WhatsDash platform, creating a unified data source.

-
Multi-Source Connectors : Connect over 60+ popular Integrations, including Google Analytics 4, Facebook Ads, Shopify, Mailchimp, and custom sources like CSV Files.
-
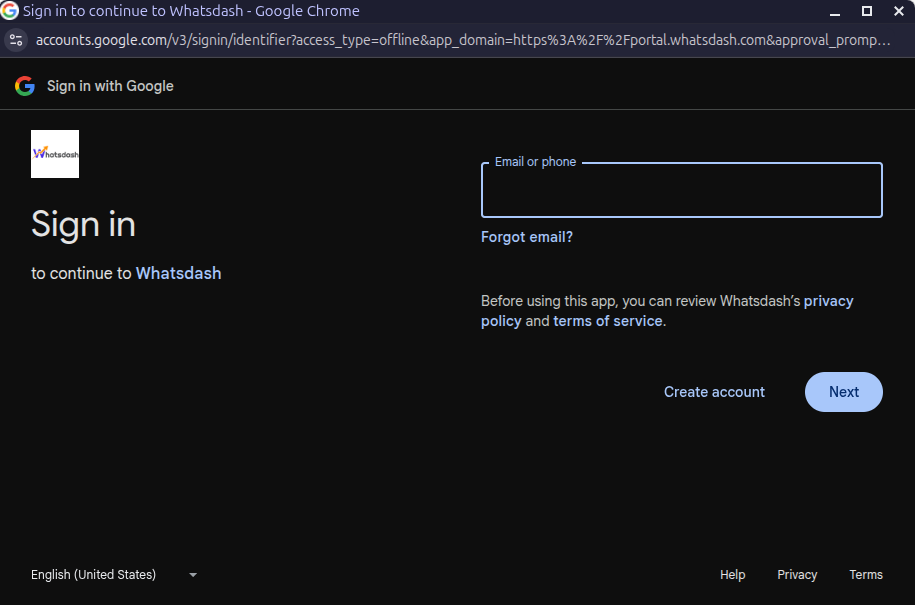
Secure Authentication : Whatsdash uses secure, platform-specific OAuth flows (where applicable) to ensure you grant us read-only access to your data. This secure connection allows you to seamlessly visualize your metrics within your own dashboards.
-
Data Sync Management : Monitor the status and refresh frequency of each connector to ensure your dashboard data is always up-to-date.
-
💡Ready to Get Started?
If you're a new user, we recommend starting with the Integrations page to connect your data first.
Once connected, head over to the Dashboard section to begin visualizing your metrics!
HOME
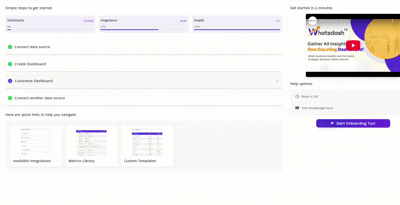
The moment you log in to Whatsdash, you'll be greeted with a friendly, holistic view of exactly how your business is performing!
The Home Page is designed as your central data hub, providing instant insights and quick access to the dashboards and features you use most.
The following sections will guide you through each feature, showcasing how to navigate and leverage WhatsDash to its fullest potential.
Integration Status & Connectivity :
See the health of your data connections at a glance.
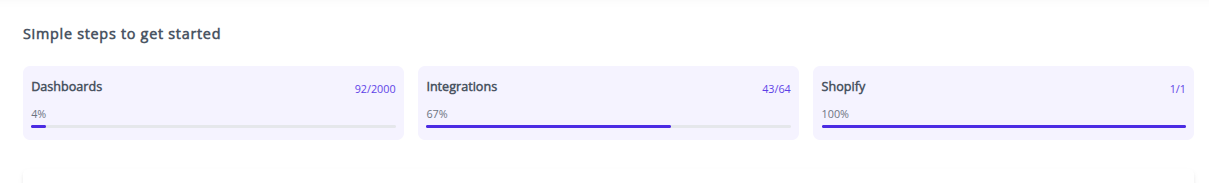
Dashboards Available
Keep track of how many dashboards have been utilized versus the total provided.
Total Integrations Available
Find out the full range of platforms you can connect with Whatsdash to unify your data.
Currently Connected Integrations
Track how many of your available integrations are actively sending data, ensuring your insights are always fresh.
Key Integration Health Check
Instantly confirm if essential platforms, like Shopify, are connected and ready for analysis.
Your Dashboards: Insights at Your Fingertips
Jump straight into the data that matters most.
🧭 Build Your First Dashboard
New to Whatsdash? Get started immediately with an intuitive guide to building your initial performance dashboard.

📂 Quick Access to Existing Dashboards
See a curated list of all the dashboards you've already created, organized by their core integrations.
🎨 One-Click Action
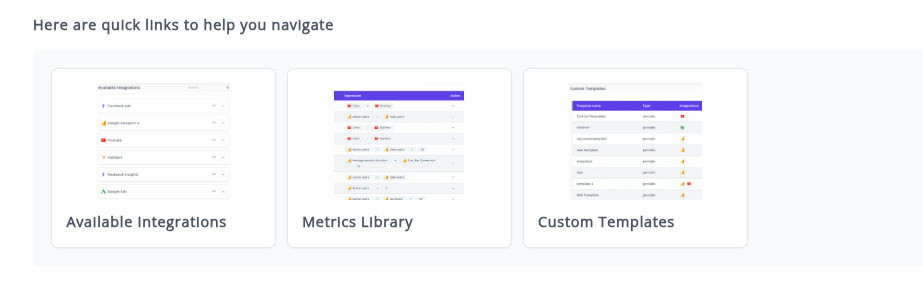
With a single click, access and modify your dashboards, as well as explore the metrics library, custom templates, and connected integrations.
Explore Whatsdash Features
Unleash the full power of the platform.
Onboarding Tour

Click on the Onboarding Tour option right here on the Home page to explore every feature, learn pro tips, and discover how to maximize your data strategy with Whatsdash.
DASHBOARD
The Dashboard section is the central hub for all your data visualizations within Whatsdash.
It provides powerful tools to manage, organize, and create new dashboards tailored to your business needs, leveraging the different integrations you’ve connected.

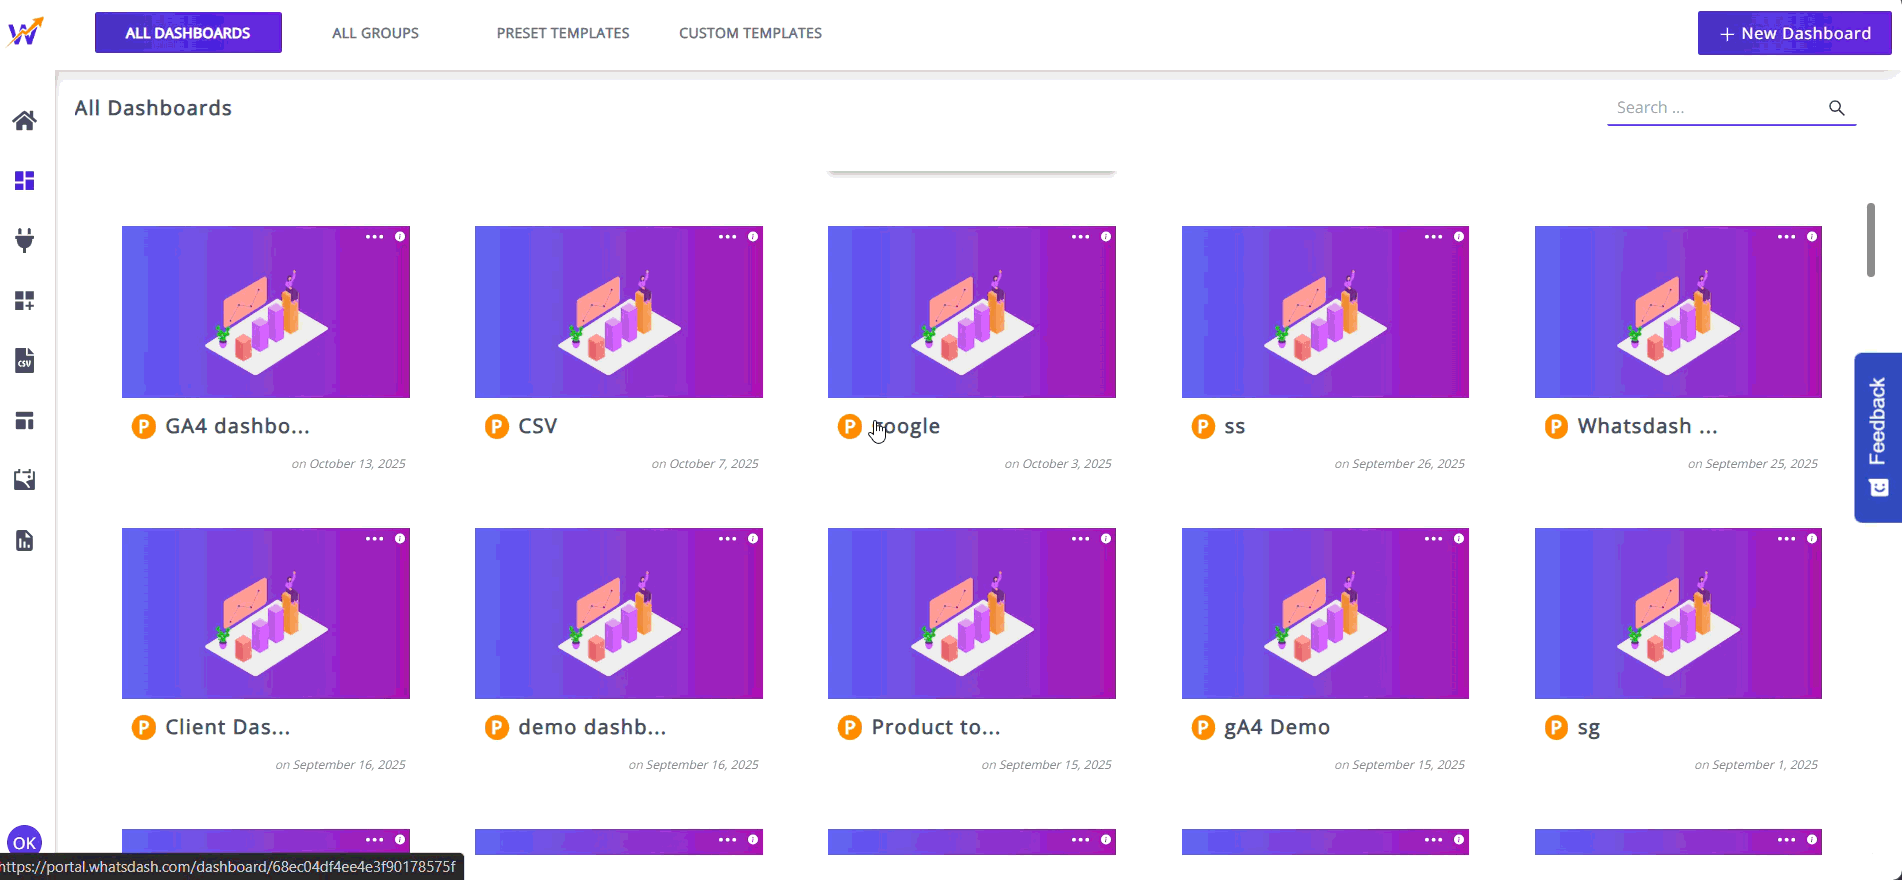
Managing Your Dashboards
This section provides seamless control over all your created analytical views.
📂 Grouped Dashboards
Easily view and organize your existing dashboards.
Whatsdash gives you the facility to group your dashboards under a single unit. This powerful feature helps you quickly locate the exact performance view you need within a neatly organized collection.

⚡ One-Click Access
-
Instant Launch - The dashboard opens immediately, loading the latest data and allowing you to start your analysis without delay.
-
Immediate Usability - You can immediately use the dashboard to review metrics, apply filters, and interact with the visualizations.
-
Seamless Modification - You are automatically placed into the editing environment, allowing you to modify charts, adjust layout, or change underlying data sources instantly, without any extra button clicks.
Creating New Dashboards
Speed up your analysis with pre-built or custom foundations.
-
Preset Templates -"Simply select a template, connect your data, and your dashboard is ready!"
Explore a library of ready-to-use dashboard templates provided by Whatsdash. These are pre-configured to track key metrics for common business use cases.
-
Custom Templates - "Design Once, Deploy Everywhere."
Once you've perfected a dashboard layout, save it as a custom template. This allows you to rapidly create new, identical dashboards for future projects, campaigns, or different data sources, ensuring consistency and efficiency across your organization.
INTEGRATIONS
Welcome to the Integrations Page! This is your central hub for connecting your data sources to WhatsDash, allowing you to centralize and visualize your marketing, sales, and business performance metrics in one unified dashboard.
WhatsDash supports a wide and ever-growing range of connectors to bring your data to life.
How Integrations Work
-
Select Your Platform: Choose your integration that you want to connect in WhatsDash.
-
Authenticate: Follow the on-screen steps to securely log in your credentials and grant WhatsDash access to your data.
-
Create Dashboards: Once connected, you can start building custom dashboards using the data fields provided by the Integration.
Available Integrations
Below is the complete list of platforms you can integrate with WhatsDash. Click on any link for platform-specific setup guides, data sync details, and troubleshooting tips.
- Marketing & Advertising
| Integrations | Setup Guide |
|---|---|
| Facebook Ads | Facebook Ads Integration Guide |
| Google Ads | Google Ads Integration Guide |
| Pinterest Ads | Pinterest Ads Integration Guide |
| Snapchat Ads | Snapchat Ads Integration Guide |
| Reddit Ads | Reddit Ads Integration Guide |
| Quora Ads | Quora Ads Integration Guide |
| Taboola | Taboola Integration Guide |
- Analytics & SEO
| Integration | Setup Guide |
|---|---|
| Google Analytics 4 | Google Analytics 4 Integration Guide |
| Google Search Console | Google Search Console Integration Guide |
| Bing Webmaster Tools | Bing Webmaster Tools Integration Guide |
| Google Trends | Google Trends Integration Guide |
| MOZ | MOZ Integration Guide |
| Keyword.com | Keyword.com Integration Guide |
| Google Page Speed | Google Page Speed Integration Guide |
| matomo | matomo Integration Guide |
- Social Media Insights
| Integration | Setup Guide |
|---|---|
| Facebook Insights | Facebook Insights Integration Guide |
| Instagram Insights | Instagram Insights Integration Guide |
| Linkedin Pages | Linkedin Pages Integration Guide |
| Google My Business | Google My Business Integration Guide |
| Youtube | Youtube Integration Guide |
| Vimeo Public Data | Vimeo Public Data Integration Guide |
| Vimeo OTT | Vimeo OTT Integration Guide |
| Tumblr | Tumblr Integration Guide |
- E-commerce & Sales
| Integration | Setup Guide |
|---|---|
| Shopify | Shopify Integration Guide |
| WooCommerce | WooCommerce Integration Guide |
| Salesforce | Salesforce Integration Guide |
| Zoho CRM | Zoho CRM Integration Guide |
| Pipedrive | Pipedrive Integration Guide |
- Email Marketing
| Integration | Setup Guide |
|---|---|
| Mailchimp | Mailchimp Integration Guide |
| Constant Contact | Constant Contact Integration Guide |
| Zoho Campaigns | Zoho Campaigns Integration Guide |
| Klaviyo | Klaviyo Integration Guide |
| ActiveCampaign | ActiveCampaign Integration Guide |
| Brevo | Brevo Integration Guide |
| Newsletter2Go | Newsletter2Go Integration Guide |
| Omnisend | Omnisend Integration Guide |
- Finance & Accounting
| Integration | Setup Guide |
|---|---|
| Stripe | Stripe Integration Guide |
| PayPal | PayPal Integration Guide |
| Razorpay | Razorpay Integration Guide |
| Chargebee | Chargebee Integration Guide |
| QuickBooks | QuickBooks Integration Guide |
| Zoho Books | Zoho Books Integration Guide |
- Databases & Data Sources
| Integration | Setup Guide |
|---|---|
| Google Sheets | Google Sheets Integration Guide |
| CSV Files | CSV Files Integration Guide |
| MySQL | MySQL Integration Guide |
| PostgreSQL | PostgreSQL Integration Guide |
| Microsoft Sql Server | Microsoft Sql Server Integration Guide |
| Oracle Database | Oracle Database Integration Guide |
| Amazon Redshift | Amazon Redshift Integration Guide |
| Google BigQuery | Google BigQuery Integration Guide |
| Azure Sql Server | Azure Sql Server Integration Guide |
- Other Business Tools
| Integration | Setup Guide |
|---|---|
| HubSpot | HubSpot Integration Guide |
| Jira | Jira Integration Guide |
| GitHub | GitHub Integration Guide |
| Slack | Slack Integration Guide |
| Calendly | Calendly Integration Guide |
| Clockify | Clockify Integration Guide |
| Harvest | Harvest Integration Guide |
| Teamwork | Teamwork Integration Guide |
| Partnerize | Partnerize Integration Guide |
| Yext | Yext Integration Guide |
| Kit | Kit Integration Guide |
| Pinterest Insights | Pinterest Insights Integration Guide |
PERIODIC DASHBOARD
What is a Periodic Dashboard?
A Periodic dashbboard is a type of dashboard that is explicitly designed to track metrics over fixed, regular time intervals, such as a day, week, month, quarter, or year.
Benefits of using Periodic Dashboards
-
Reporting Flexibility: The dashboard empowers users with complete control over the reporting frequency for their analysis, explicitly selecting their required time period —such as Daily, Weekly, Monthly, Quarterly, or Annually—when generating reports.
-
Real-Time Period Synchronization: Upon changing the time periods manually, the dashboard initiates a simultaneous, platform-wide refresh in every widgets , instantly updating to strictly reflect the data aggregated from that precise time frame.
-
Seamless Navigation: Instead of relying solely on arrow keys to move sequentially, the Periodic Dashboard provides a convenient dropdown menu that grants you direct access to the desired time frame.
Steps: Creating and Using a Periodic Dashboard
Follow these steps to establish your first Periodic Dashboard and begin your time-based analysis.

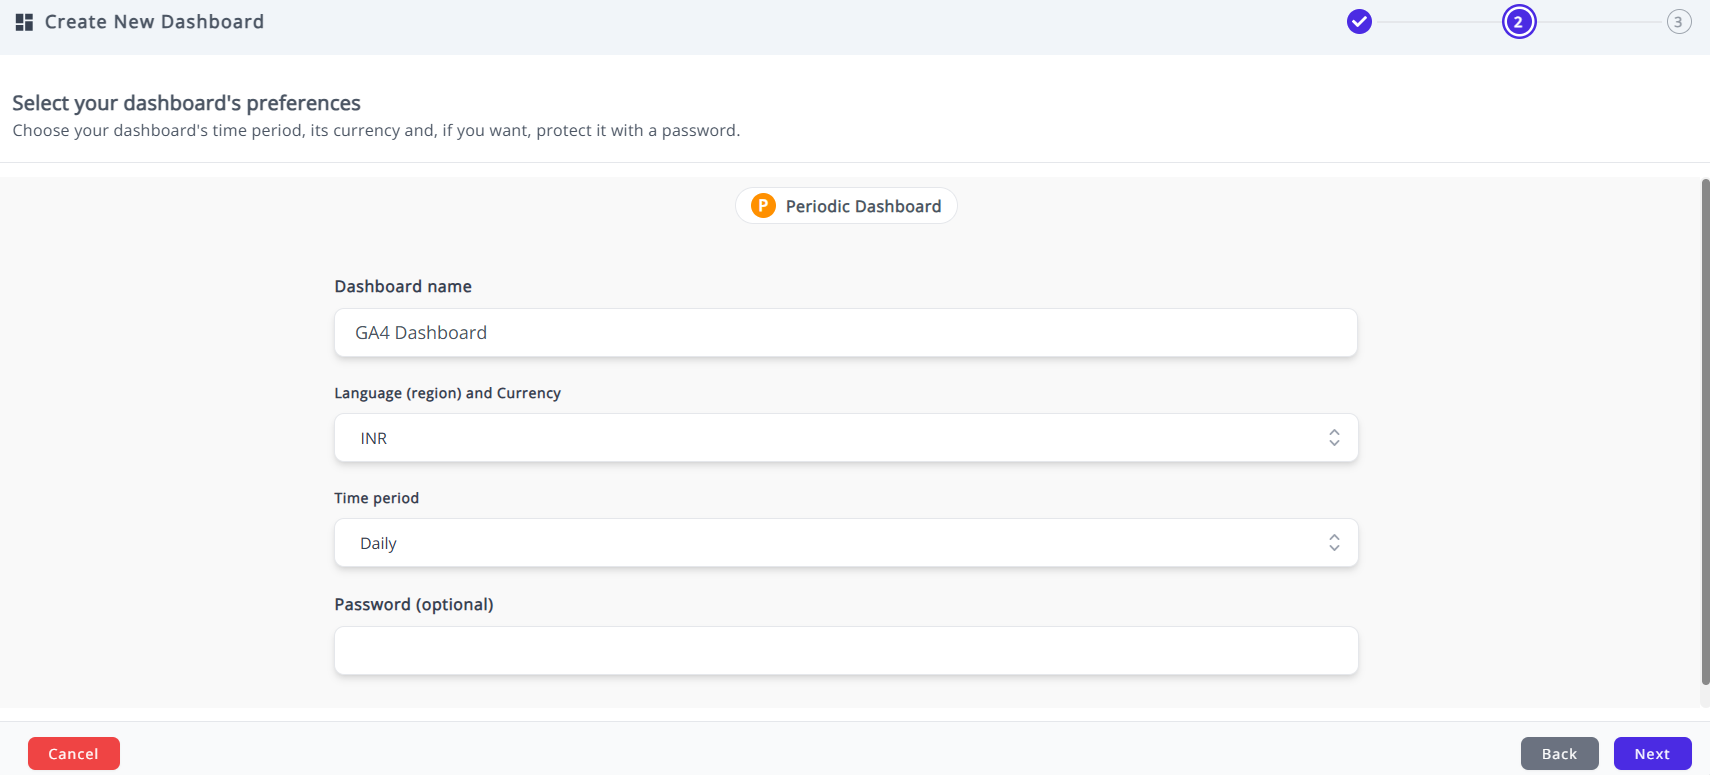
Step 1: Create a New Periodic Dashboard
1.Click on the 'New Dashboard' button in the Dashboards Page.
2.On the Create New Dashboard screen,you get two categories of dashboards- 'Periodic Dashboard' and 'Campaign Dashboard'.
3.Choose 'Blank Periodic Dashboard' or any Preset Template for your dashboard .
4.Name Your Dashboard (e.g., "Monthly Sales Performance").
5.Set Initial Preferences: Define the default Time Period (e.g.- Monthly).
6.Secure your Dashboard with password. (Optional)
Step 2: Add Data Sources
1.On naming the Dashboard,choose the desired integrations and connect the data sources (e.g., Shopify).
2.Choose Multiple integrations at once in single dashboard.
Step 3: Add Widgets and Metrics
1.Once the blank dashboard loads, add the widgets from either Preset Widgets or Custom Widgets or Static Widgets in the dashboard. When configuring each widget, ensure you select metrics relevant to the periodic view (e.g., "Total Revenue," "New Customers," "Conversion Rate").
2.Arrange and Customize the widgets into a logical flow, using headers to define sections (e.g., "Revenue Snapshot," "Traffic Breakdown").
Step 4: Utilize Period Shifting for Analysis
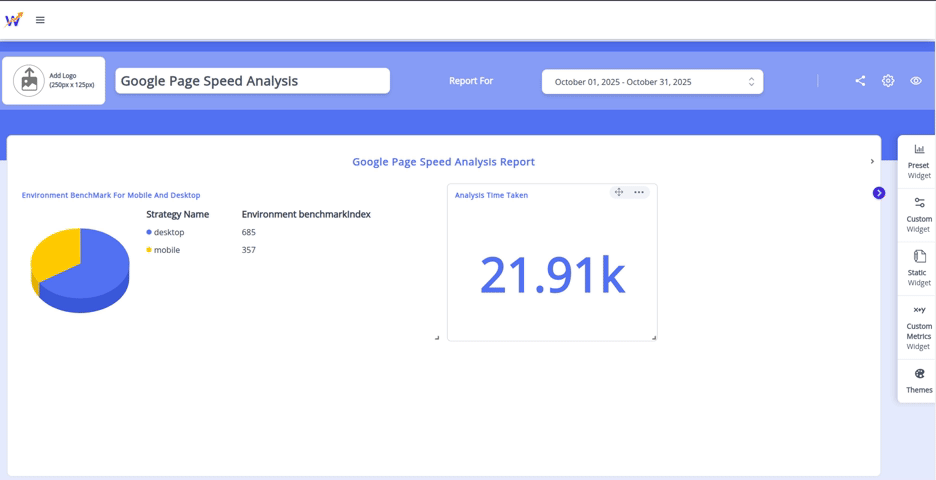
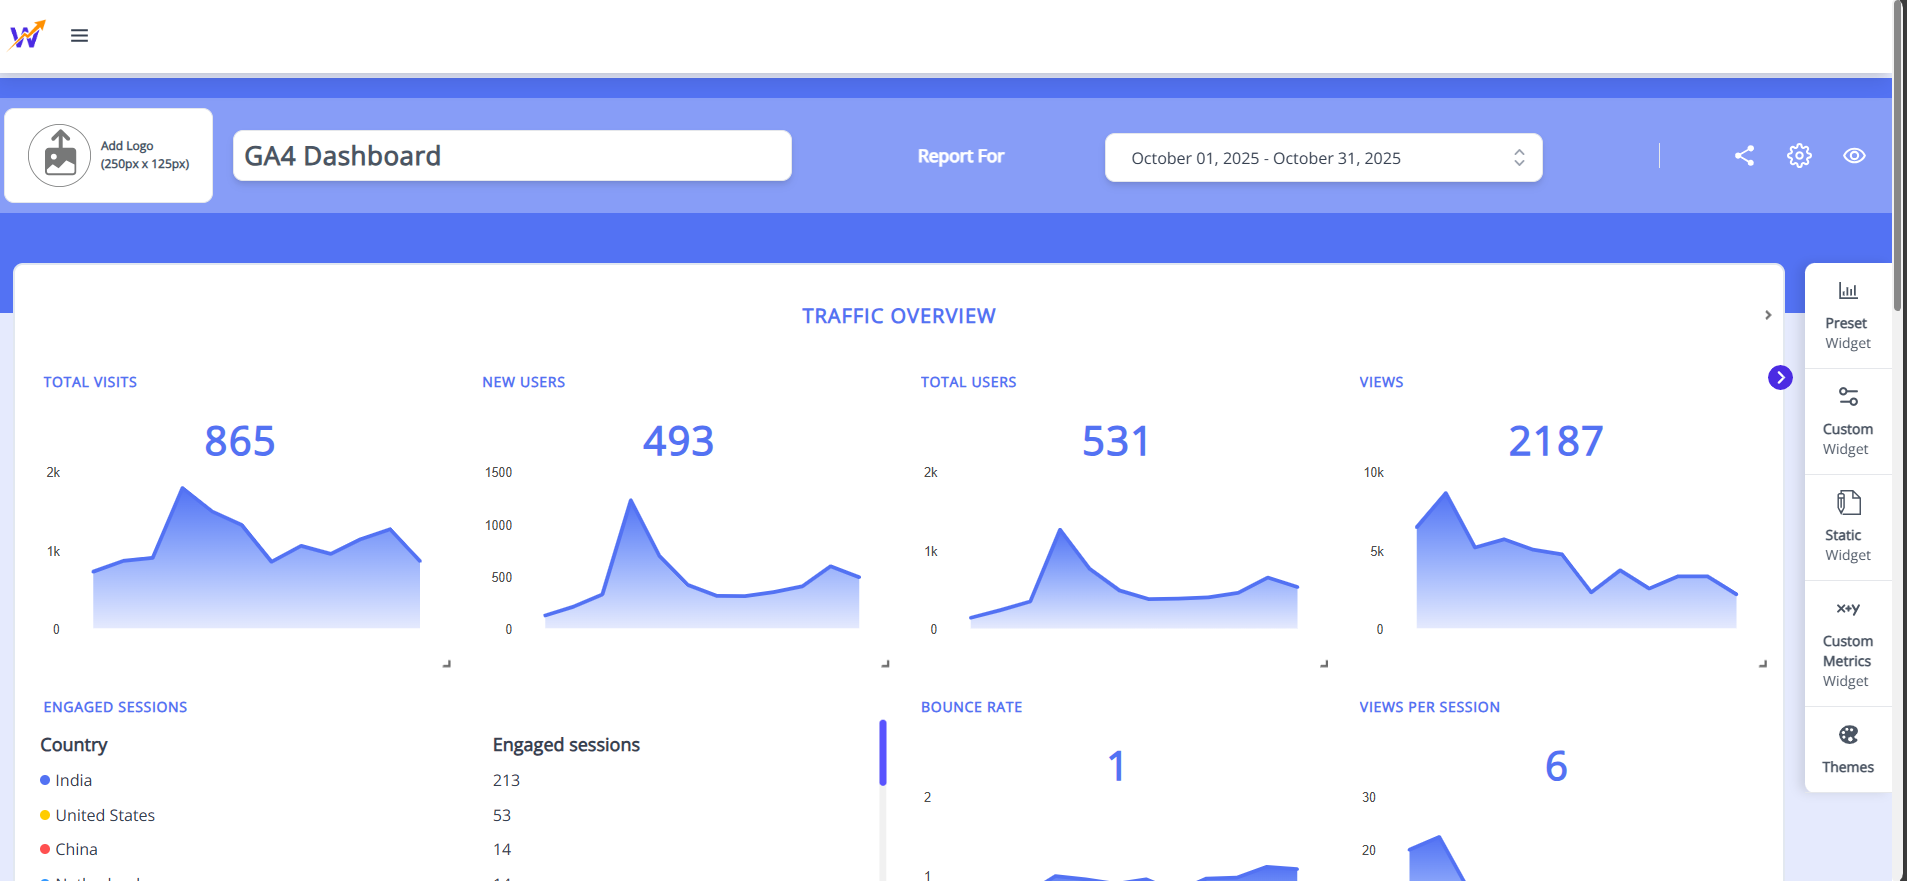
1.Utilize Period Shifting for Analysis With your dashboard complete, locate the dropdown menu for time period at the top of the screen (e.g., showing 'October 01, 2025 - October 31, 2025').
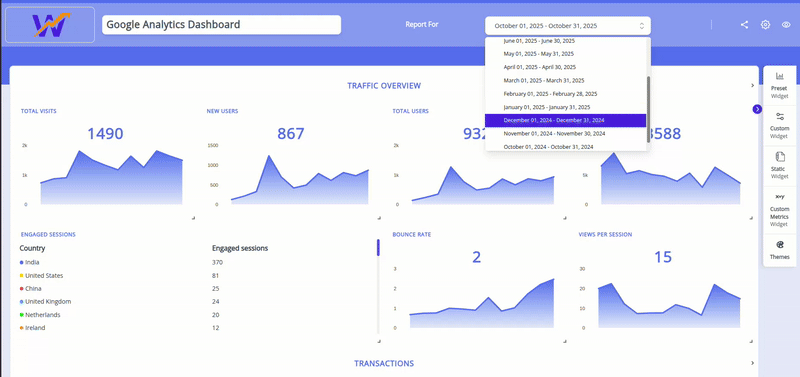
2.With every change in the time period, the widgets in the dashboard undergoes a simultaneous updation of the data aggregated from the chosen time frame.
Step 5: Standardize Periodic Reporting:
1.Perfect your ideal analysis view once, then use the 'Save as Template' option to save the layout for future use. You can then instantly deploy this template for the next campaign, only needing to adjust the dates and potentially the data source filters.
CAMPAIGN DASHBOARD
What is a Campaign Dashboard?
The Campaign Dashboard is a specialized reporting dashboard designed for analyzing performance data that is not tied to fixed calendar intervals, but rather to a specific, singular initiative, project, or event that has its own unique start and end dates.
Benefits of Campaign Dashboard
-
Custom Timeframes: Campaign Dashboard allows you to define a custom start date and end date that perfectly matches the duration of your campaign (e.g., a 45-day product launch, a weekend flash sale, or a specific quarter-long project).
-
Scope Your Success: Campaign Dashboard focusses on the analysis of a single project or initiative with custom start and end dates.It lets you precisely track the specific KPIs and goals of that initiative, filtering out irrelevant data for clear performance measurement.
-
Flexibility: It retains the same metrics and layout regardless of the specific dates chosen, allowing you to use the same template for multiple sequential or concurrent campaigns.
-
Cross-Campaign Templates: You can create a perfect Campaign Dashboard layout for a specific type of initiative (e.g., "Standard Social Media Campaign") and then apply that layout as a Custom Template to every new, unique social media campaign you launch.
Steps: Creating and Using a Campaign Dashboard
Follow these steps to set up and analyze a specific initiative using the Campaign Dashboard.
Step 1: Create a New Campaign Dashboard
1.Click on the 'New Dashboard' button in the Dashboards Page.
2.On the Create New Dashboard screen,you get two categories of dashboards- 'Periodic Dashboard' and 'Campaign Dashboard'.
3.Choose 'Blank Campaign Dashboard' or any Preset Template for your campaign dashboard .
4.Name Your Dashboard .
5.Select your Campaign Start Date and Campaign End Date on clicking the calender icon.
6.Select your Comparison Start Date and Comparison End Date for Comparison Analysis (Optional)
7.Secure your Dashboard with password.(Optional)
Step 2: Add Data Sources
1.On naming the Dashboard,choose the desired integrations and connect the data sources (e.g., Shopify).
2.Choose Multiple integrations also at once in single dashboard.
Step 3: Add Widgets and Metrics
1.Once the blank campaign dashboard loads, add the widgets from either Preset Widgets or Custom Widgets or Static Widgets in the dashboard.
2.While configuring each widget, ensure you select metrics relate to the campaign's goals .
3.Create new widgets to add in the dashboard using the Custom Metrics Widgets.
4.Arrange and Customize the widgets into a logical flow, using headers to define sections.
Step 4: Standardize Campaign Reporting:
1.Perfect your ideal analysis view once, then use the 'Save as Template' option to save the layout for future use. You can then instantly deploy this template for the next campaign, only needing to adjust the dates and potentially the data source filters.
🚀 Dashboard Features
The Whatsdash Dashboard is a powerful, customizable reporting interface designed to give you a consolidated, real-time view of your business performance.
It is built with a modular approach, allowing you to select and configure different types of widgets to perfectly match your analysis and reporting needs.
📘 Table of Contents
- 2.3.1. Preset Widget
- 2.3.2. Custom Widget
- 2.3.3. Static Widget
- 2.3.4. Custom Metrics Widget
- 2.3.5. Themes
2.3.1. Preset Widget
The Preset Widget provides instant reporting by using pre-configured templates for common integrations and reporting needs.
They are the fastest way to get data visualized and are ready-to-use with minimal setup after integration.
👉 Click here to learn about Preset Widget
2.3.2. Custom Widget
The Custom Widget gives you full control over your data visualization.
You can select the exact metrics and dimensions you want to display, choose the visualization type (bar chart, line chart, table, etc.), and apply filters to build reports tailored to your specific needs.
👉 Click here for a detailed guide on creating a Custom Widget
2.3.3. Static Widget
The Static Widget is used for displaying non-data elements on your dashboard — such as text, images, or organizational notes.
This feature is crucial for adding context, providing instructions, or displaying branding elements alongside your performance data.
👉 Click here to learn how to utilize Static Widgets for context and branding
2.3.4. Custom Metrics Widget
The Custom Metrics Widget allows you to create and visualize calculated metrics not natively available in the source platform's API.
For example, you can calculate Profit Margin by subtracting ad spend from total revenue.
This widget is essential for advanced business analysis and tracking bespoke KPIs.
👉 Click here to see how to define and use a Custom Metric
2.3.5. Themes
Themes let you customize the aesthetic appearance of your dashboard — including color schemes, layouts, and typography.
Applying a theme ensures brand consistency across reports and enhances visual readability.
👉 Click here for documentation on customizing Dashboard Themes
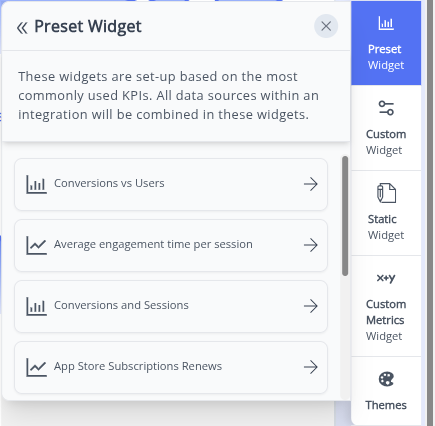
PRESET WIDGETS
The Preset Widgets feature is the quick-access library of the most popular and commonly used metrics for all your connected integrations. This feature speeds up the dashboard creation process by allowing you to add fully configured visualizations with a single click in the dashboard.
What are Preset Widgets?
Preset Widgets are pre-built, ready-to-use visualizations that are automatically generated by Whatsdash based on the integrations you have connected to your dashboard.
-
Metric Automation: These widgets instantly pull the most valuable, high-level metrics directly from your selected data source.
-
Default Visualization: Each preset widget is assigned an appropriate default visualization type (e.g.,Simple Number Widget; Historical Trend Chart).
-
Zero Configuration: They require no manual selection of metrics, dimensions, or initial filters—they are ready to deploy immediately.
How Preset Widgets Work
Follow these steps to quickly add a pre-configured metric to your dashboard:

-
Create Your Dashboard(Edit Mode):
Once the dashboard is created from the Dashboard Page, you will automatically land in the blank dashboard in Edit Mode.
For adding widgets, you can choose from Preset Widget, Custom Widget, Static Widget, and Custom Metrics Widgets from the right side of the screen.
-
Access Preset Widgets:
In Edit Mode,on clicking the 'Preset Widget' option , a list of Preset Widgets, specific to your connected data sources, will be provided instantly.
-
Choose and Configure:
Select any widget from the list. It will load with pre-defined metrics, but you retain the option to immediately configure and change the visualization type for those same metrics within the widget's settings.
CUSTOM WIDGETS
The Custom Widget feature provides complete control and maximum flexibility, allowing users to build precise data visualizations tailored exactly to their unique reporting requirements.
This feature is beneficial when the Preset Widgets do not offer the specific combination of metrics, dimensions, or visualization types needed for your analysis.
What are Custom Widgets?
Custom Widgets are blank canvases where the user manually defines every component of the visualization, ensuring the resulting chart or metric perfectly aligns with the analytical requirements.
-
Total Accessibility: Users select the data source, visualization types, the specific metrics (what to measure), and the dimensions (how to group or slice the data).
-
Deep Dive Analysis: Ideal for complex segmentation, cross-referencing multiple metrics, or applying custom calculations that go beyond standard reporting.
How Custom Widgets Work
The custom widget workflow guides the user through a selection process, starting with the visualization type and culminating in the data selection ,to ensure the widget is built correctly for the data it contains.

Here is the step-by-step process for creating a Custom Widget:
Start Building (Edit Mode Activation):
1.Once the dashboard is created from the Dashboard Page, you will automatically land in the blank dashboard in Edit Mode.
2.For adding widgets, you can choose from Preset Widget, Custom Widget, Static Widget, and Custom Metrics Widgets from the right side of the screen.
3.In Edit Mode, click the 'Custom Widget' option.

Choose Visualization Type:
1.A list of available visualization types is displayed, including:
-
Gauge: For measuring progress against a goal.
-
List/Table: For viewing raw, segmented data.
-
Number: For displaying a single, high-impact KPI.
-
Trend/History: For tracking performance changes over time.
-
Pie: For viewing proportional segment data.
2.Select the type that is best applicable for the data representation.
Define Metrics and Dimensions:
1.Based on the selected visualization type and your connected data sources, you will then be prompted to:
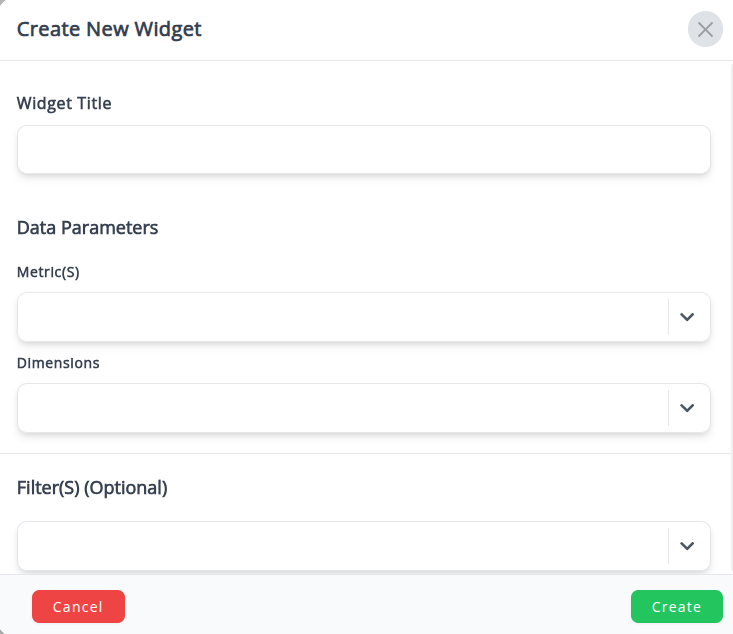
- Select Metrics : Choose the specific numerical values you want to aggregate.
- Select Dimensions : Choose how you want to break down those metrics (if applicable).
2.On selecting the metrics and dimensions, the widget is immediately created with data based on your selection
Post-Creation Flexibility
1.After widget creation, you can explicitly and dynamically change the metrics, dimensions, and visualization type as often as required.
2.You can easily drag and drop the widget to reposition it within the dashboard layout to optimize viewing flow.
STATIC WIDGETS
The Static Widget feature allows you to embed non-data-driven content directly onto your dashboard canvas.
These widgets remain constant regardless of the time period or filters applied, making them essential for providing context, instructions, and visual clarity to your data reports.
What are Static Widgets?
Static Widgets are fixed elements used to convey information that does not change based on real-time data or reporting periods.
They transform a purely data-driven report into a comprehensive communication tool.
- Fixed Content: Their content remains static; they do not require a data source integration to function.
- Contextualization: They are used to add explanatory notes, disclaimers, definitions of metrics, or links to external resources.
- Visual Enhancement: They can contain images, logos, or separators to improve the aesthetic layout and readability of the dashboard.
Types of Static Content
WhatsDash Static Widgets support several types of fixed content:

| Content Type | Purpose | Example Use Case |
|---|---|---|
| Header | Adding headings in the dashboard. | Text distinguishing various sections of the dashboard for easier and better segmentation of the dashboard. |
| Comments | Adding detailed explanatory notes, disclaimers, or metric definitions below widgets. | A note explaining the widget's data, a definition of an internal KPI, or key takeaways from widgets. |
| CSV | Adding static, manually entered data tables directly into the dashboard canvas. | A list of annual goals, target benchmarks, or manually tracked competitor data for quick reference. |
| Editable Number | Allowing users to manually input any number directly on the dashboard canvas. | Tracking a manually entered budget, a forecast target number, or an offline sales figure. |
How Static Widgets Work
Follow these simple steps to add fixed content and context to your dashboard:
-
Start Building (Edit Mode):
1.Once the dashboard is created from the Dashboard Page, you will automatically land in the blank dashboard in Edit Mode.
2.For adding widgets, you can choose from Preset Widget, Custom Widget, Static Widget, and Custom Metrics Widgets from the right side of the screen.
3.In Edit Mode, click the 'Static Widget' option.
-
Select Static Widget Option:
1.On clicking the 'Static Widget' option on the right side of the screen, a list of static content types are displayed.
2.Select the type of content you wish to add.A 'Create New Widget' screen appears for you to enter the appropriate text for the static widget.
-
Place on Canvas:
1.Once configured, the static widget is placed on the canvas.
2.You can resize and drag it to your desired position — just like any other widget.
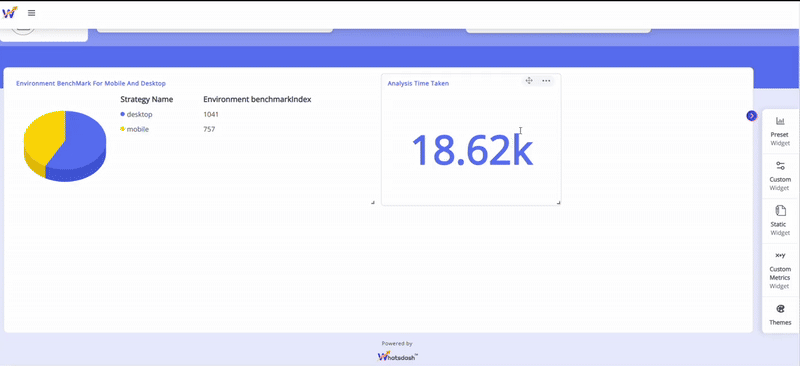
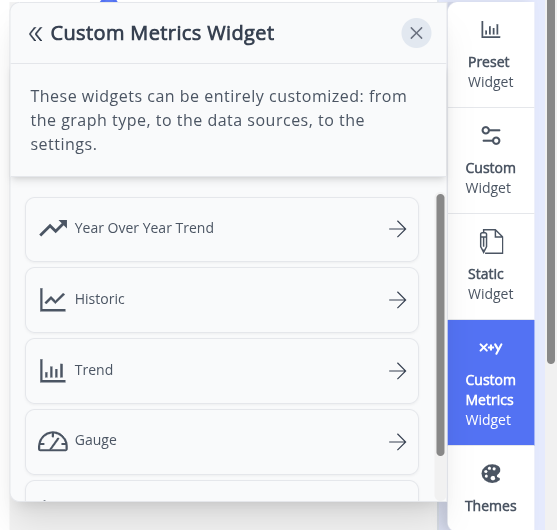
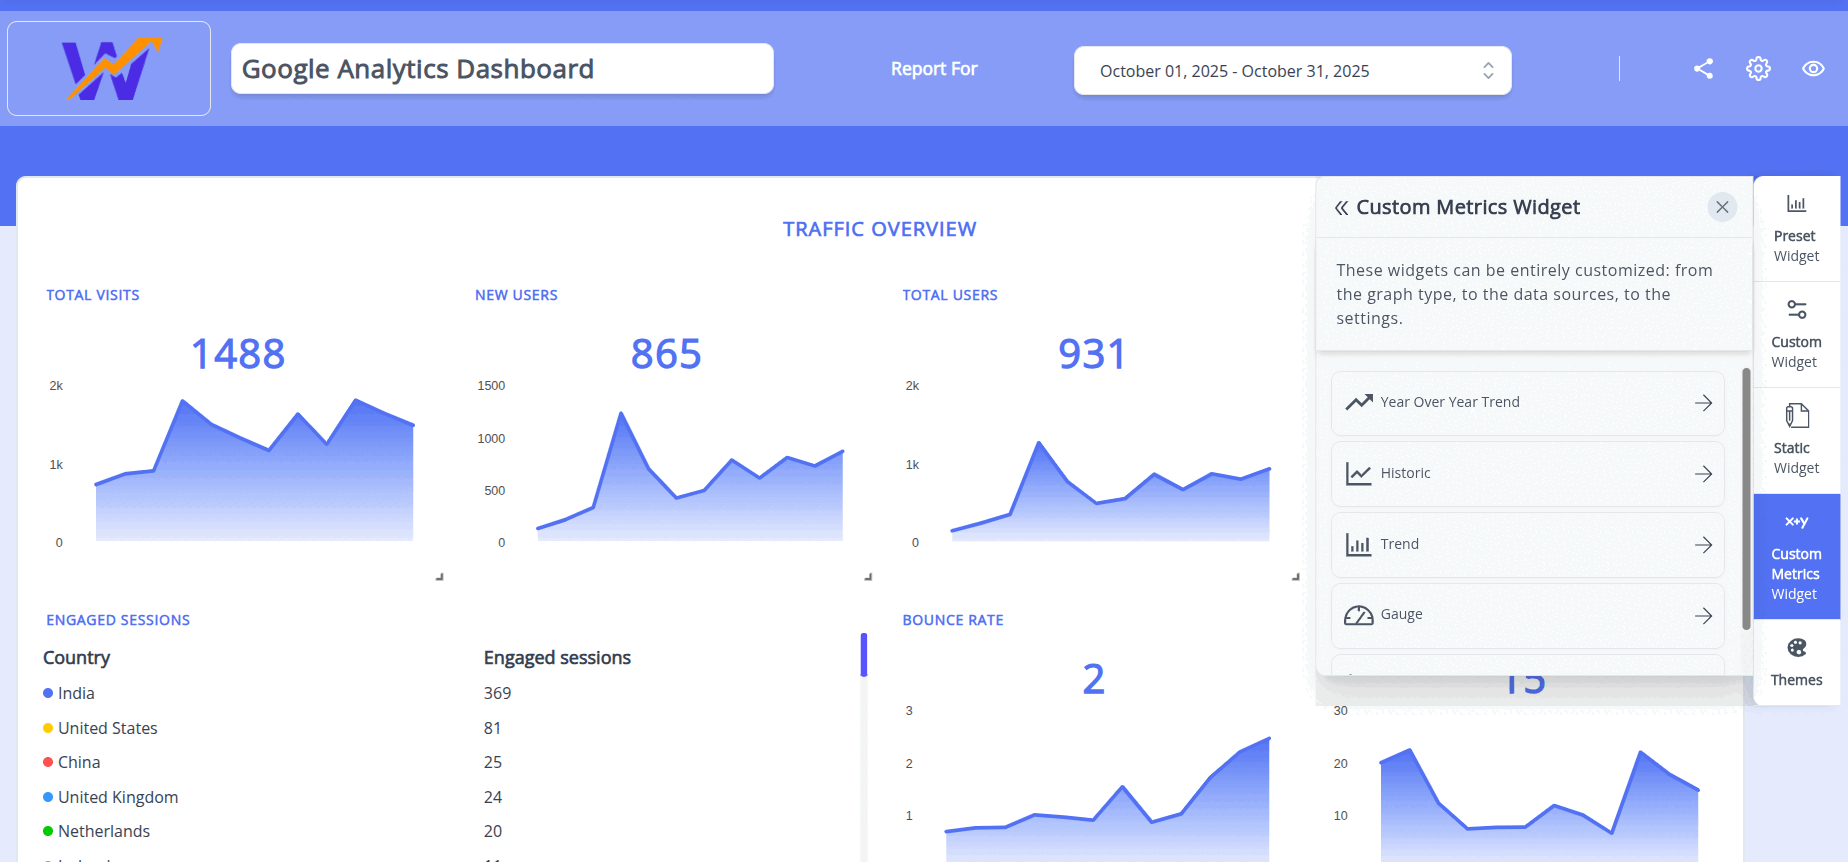
CUSTOM METRICS WIDGETS
The Custom Metrics Widget is designed for advanced users who need to visualize metrics that have been explicitly defined and created within the Whatsdash platform.Unlike standard widgets that pull default metrics from integrations, this feature focuses purely on visualizing these pre-calculated values.
What are Custom Metrics Widgets?
Custom Metrics Widgets are specialized widgets in the dashboard which is dedicated in displaying the custom metrics you have engineered. They offer a simple, dedicated interface for selecting a visualization type and applying only the necessary custom metric data.
-
Metric-Only Focus: This widget is specifically engineered to visualize your custom, user-defined metrics. It does not handle complex data dimensions or group-by operations; its purpose is to display a single, significant calculated value.
-
Explicit Creation: The metrics used here must be pre-created in the Custom Metrics section of Whatsdash before they can be selected and visualized.
How Custom Metrics Widgets Work
Follow these steps to quickly visualize your pre-defined custom metrics on your dashboard:
-
Start Building (Edit Mode)
1.Once the dashboard is created from the Dashboard Page, you will automatically land in the blank dashboard in Edit Mode.
2.For adding widgets, you can choose from Preset Widget, Custom Widget, Static Widget, and Custom Metrics Widgets from the right side of the screen.
3.In Edit Mode, click the 'Custom Metrics Widget' option.
-
Select Custom Metrics Widget
1.On clicking the 'Custom Metrics Widget' option, a list of visualization types appears that are specific to metrics of the connected integration.
2.Select the desired visualization format from the available list.The following visualization type are included:
-
Number Widget (Gauge, List, Number): Ideal for displaying the calculated value.
-
Trend Chart (Historic, Year Over Year Trend, Trend): Suitable for showing how the calculated value has changed over time.

3.A list of all available, pre-defined custom metrics will be displayed. Choose the specific metric you wish to visualize.
-
-
Place on Canvas:
1.Once the visualization type and the custom metric are selected, the widget is automatically generated.
2.You can then resize it and drag and drop it to the desired position.
THEMES
The Themes feature in Whatsdash allows you to instantly transform the aesthetic appearance and visual appearance of your dashboard. By applying a theme, you can ensure your reports are not only data-rich but also visually compelling and aligned with your branding or viewing preferences.
What Dashboard Themes Do?
A Dashboard Theme is a pre-configured set of designs that dictates the look and feel of your entire dashboard. This includes colors, fonts, backgrounds, and widget borders. Applying a theme is a single-click action that propagates styling changes across all elements on the canvas.
-
Instant Aesthetics: Themes provide a quick way to achieve a professional or custom look without manually adjusting the color or font of every single widget.
-
Branding Consistency: You can select themes that align with your company's branding guide .
-
Viewing Comfort: Themes allow users to switch between visual modes, such as Light Mode (default) and Dark Mode, for optimal viewing comfort in different lighting conditions.
Types of Themes
Whatsdash typically offers the following types of themes:
| Theme Type | Description |
|---|---|
| Light (Default) | Standard white background with dark text, offering high contrast and readability |
| Dark Mode | Dark background with light text, reducing eye strain and glare in low-light environments. |
| Branded/Corporate | Themes pre-set with specific color palettes (e.g., blue, cyan) to match corporate visual identity. |
| High Contrast | Themes optimized for maximum readability, particularly beneficial for accessibility. |
How to Change Your Dashboard Theme
-
Start Building (Edit Mode):
1.Once the dashboard is created or open any existing dashboard from the Dashboard Page, the dashboard will be opened in the Edit Mode.
-
Locate Themes Feature:
1.In Edit Mode, click the Themes option under the Widgets on the right side of the screen.2.You will be given the option of four types of the themes.
-
Instant Theme Change:
1.Browse the available theme icons or thumbnails and click on the one that visually represents the appearance you want for your dashboard.
2.The chosen theme gets applied instantly.The background, widget colors, and typography will immediately update, giving your dashboard a new appearance.
3.The newly selected theme also gets saved automatically , ensuring the new theme is persistent from the next time ,the dashboard is opened.
📑 Templates
Templates in Whatsdash streamline dashboard creation by providing flexible starting points—whether you need an instant setup or a branded layout you can reuse.
They are divided into two main categories:
-
Preset Templates – Ready-made dashboards for common use cases.
-
Custom Templates – Personalized templates you design and reuse.
Table Of Contents
3.1 Preset Templates
The Preset Templates feature in Whatsdash offers pre-configured dashboard layouts designed to instantly visualize key metrics for common business scenarios.
3.2 Custom Templates
A Custom Template is a user-defined, customized blueprint of a Whatsdash Dashboard layout—a saved configuration of widgets, metrics, and branding.
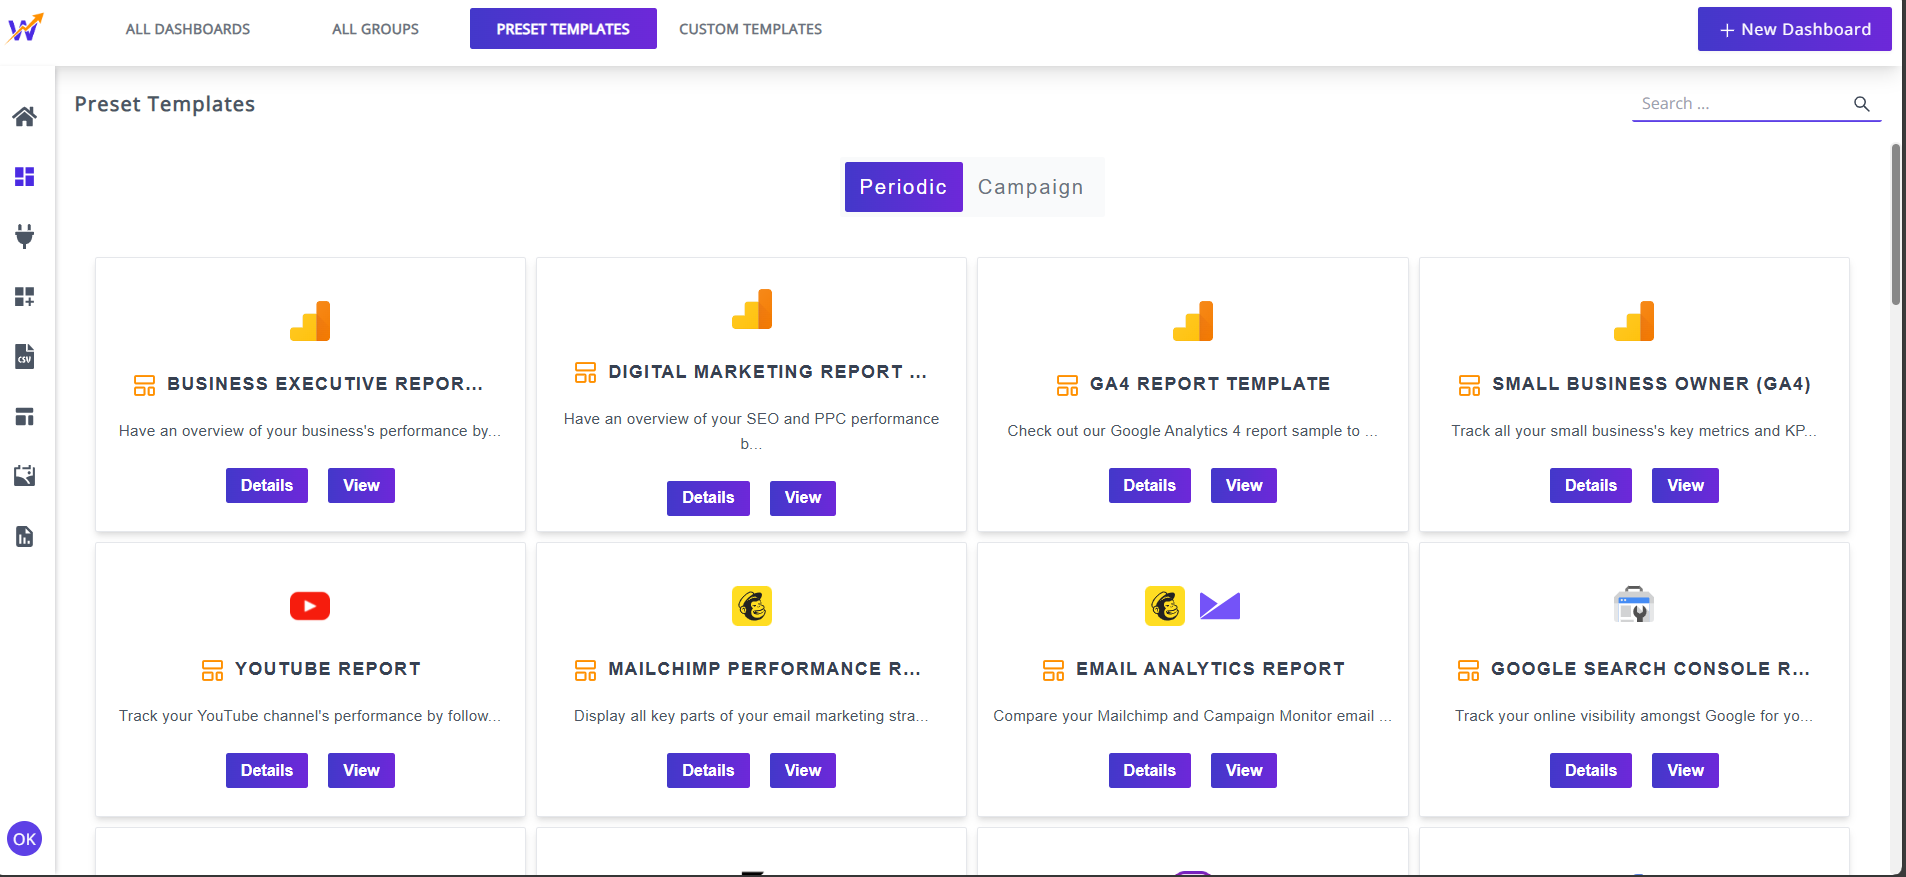
PRESET TEMPLATES
The Preset Templates feature in Whatsdash provides a gallery of professionally designed, ready-to-use dashboards that allow you to instantly visualize key metrics for common business scenarios.
What are Preset Templates?
Preset Templates are pre-configured dashboard layouts to track specific performance areas. They eliminate the need to build a dashboard from scratch, significantly accelerating your time-to-insight. These templates include:
-
Pre-selected Metrics and Dimensions: They automatically include the most critical Key Performance Indicators (KPIs) for the topic. The pre-defined widgets in the templates are made with popular and frequent-used metrics and dimensions of the integrations connected in the templates.
-
Optimal Layouts: The widgets are arranged using industry best practices for data readability and comprehension.
-
Integration Specificity: Templates are often optimized for specific integrations.
How to Use Preset Templates
Using a Preset Template is the fastest way to get your analysis running.Follow steps to deploy a preset template below:
Whatsdash offers two primary methods to access and deploy the preset templates for the dashboard:
- Method 1: Using the 'Create New Dashboard' Button
1.Navigate to the Dashboard Page and click the 'New Dashboard' button at the top right hand side of the screen.

2.The Create New Dashboard screen displays a list of pre-configured templates specific to your connected integrations, the Blank Periodic Dashboard or Blank Campaign Dashboard option for Periodic Dashboard or Campaign Dashboard respectively.
3.Choose the desired preset template from the list.
4.Name Your Dashboard.
5.Set Initial Preferences: Define the default Time Period (e.g.- Monthly).
6.Secure your Dashboard with password. (Optional)
 7.Choose the desired data source from the specific integration.
The new Dashboard with the chosen template will be created.
-
Method 2: Using the 'Preset Templates' Button
1.Find the 'Preset Templates' button located at the top of the Dashboard Page.

2.Clicking this button opens a dedicated template galere you can view detailed previews of each template individually.

3.In each template you get two options:
- View the template: Open the template as your new dashboard with a single click, instantly loading the structure.

- Manual Configuration: Choose to manually configure the template first by providing a custom name and selecting the specific data source(s) required before deployment.

Once you select or quick-deploy a template,your dashboard is now ready for use, with all initial metrics and widgets configured!
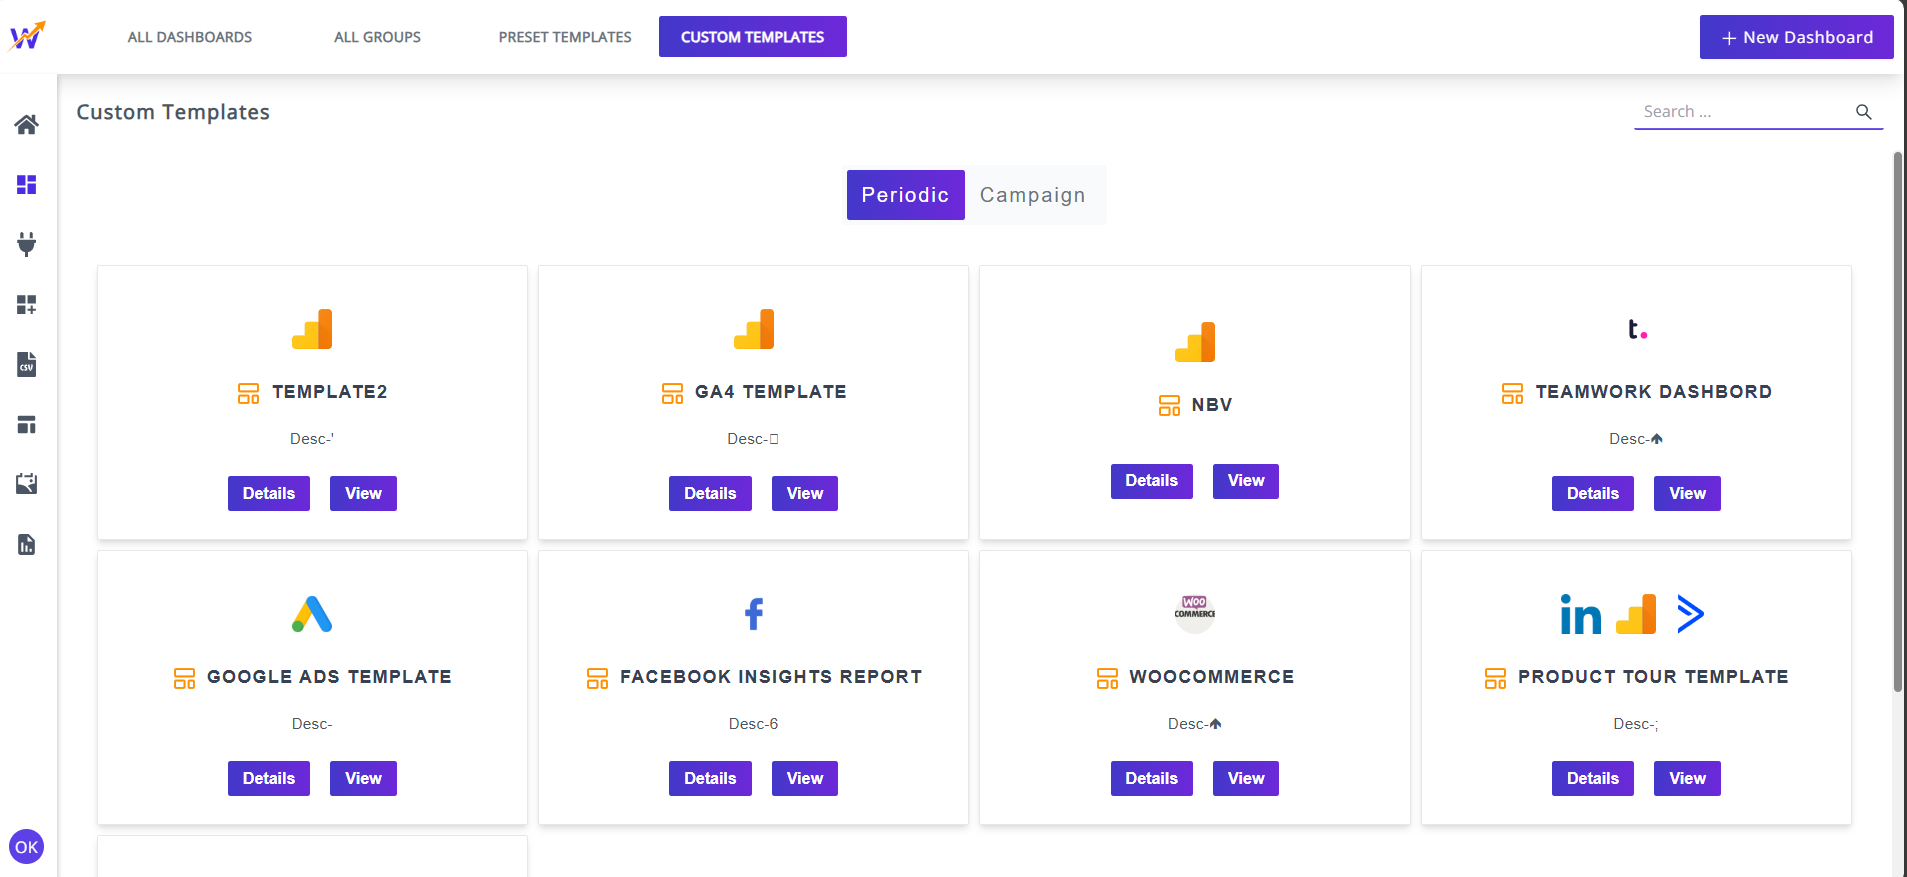
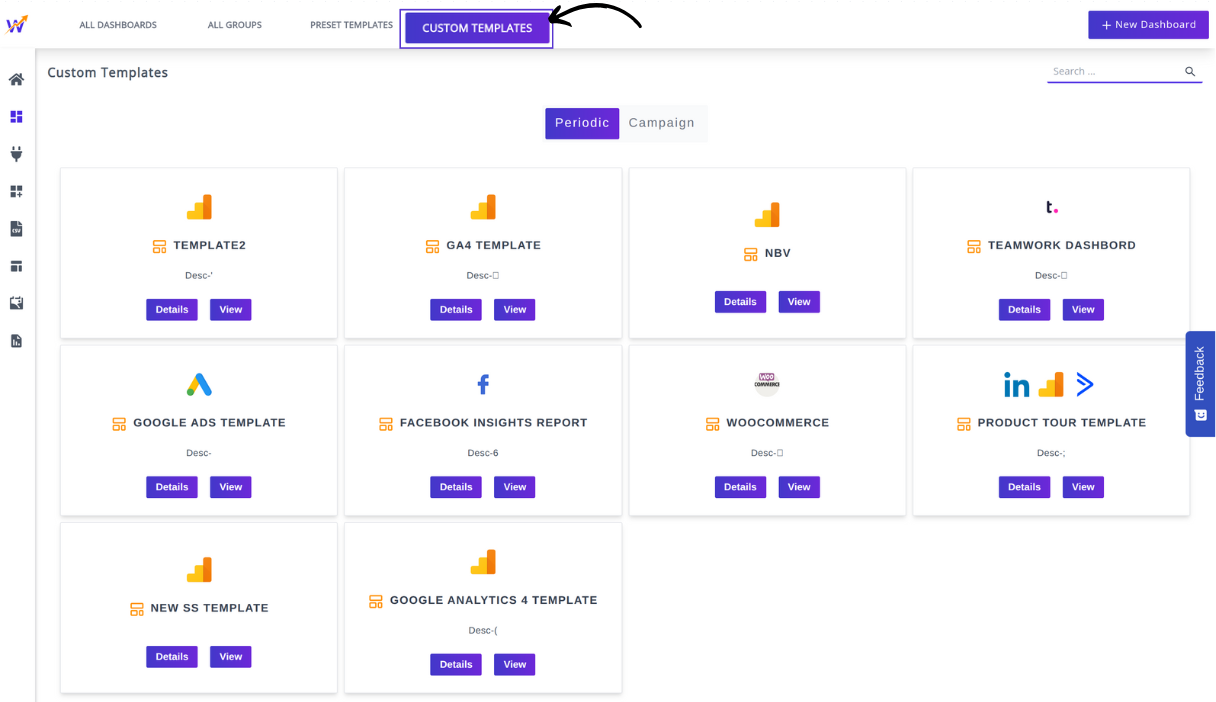
CUSTOM TEMPLATES
What is a Custom Template?
A Custom Template is a user-defined, customized blueprint of a Whatsdash Dashboard layout. It is essentially a saved configuration that includes specific arrangements of widgets, chosen metrics (KPIs), and potentially custom branding. Unlike Preset Template,this allows for:
-
Brand Consistency: Maintaining your agency's or client's visual identity across all reports.
-
Efficiency: Reusing complex layouts without needing to rebuild them from scratch every time.
-
Personalization: Designing a dashboard around a unique set of metrics not covered by standard templates.
How to Create a Custom Template
You can create a custom template in Whatsdash in two primary ways: from an existing dashboard or from the template creation menu.
-
Creating a Template from an Existing Dashboard
Whatsdash offers a seamless way to turn any existing, fully configured dashboard into a reusable template directly from your dashboard library.
-
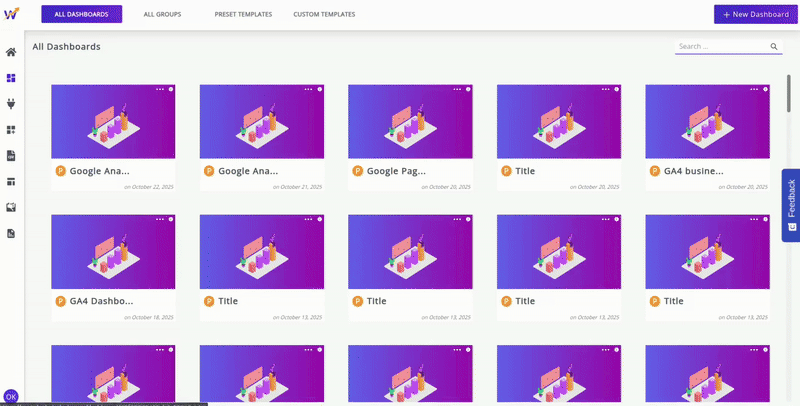
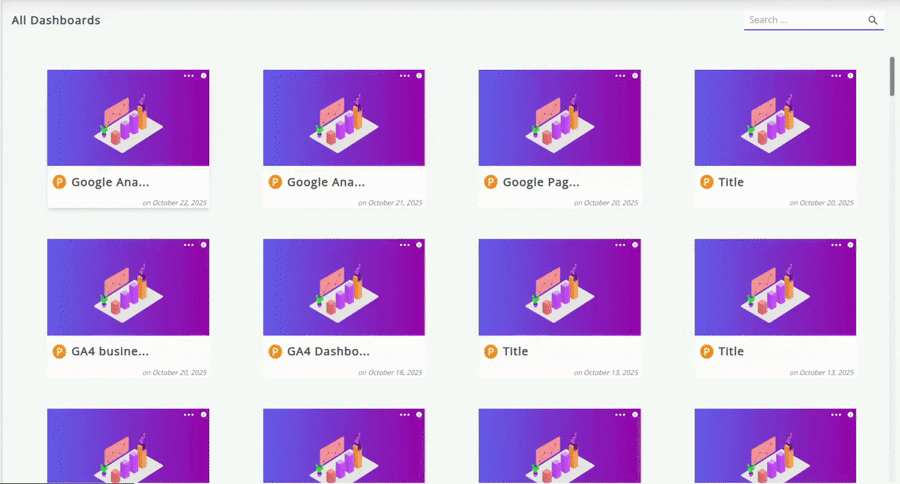
Go to the main Dashboard Page where thumbnails of all your created dashboards are displayed.
-
Find the dashboard you wish to use as a template.Click on the three-dot menu ( … ) on the dashboard's thumbnail. A list of options will appear.
-
Select the "Save As Template" option.The "Save As Template" dialog box will appear.
Enter a Name for your new template.
Add a Description for future reference.
-
Click on "SAVE" button and your custom template is now created and saved.
Your new custom template is now ready to be viewed and reused whenever you create a new dashboard, and it will also be accessible in the main Custom Templates menu.
-
-
Creating a Template from the main Custom Templates Menu
- Click the "Custom Templates" menu item in the navigation bar. A table listing all existing custom templates will be displayed.
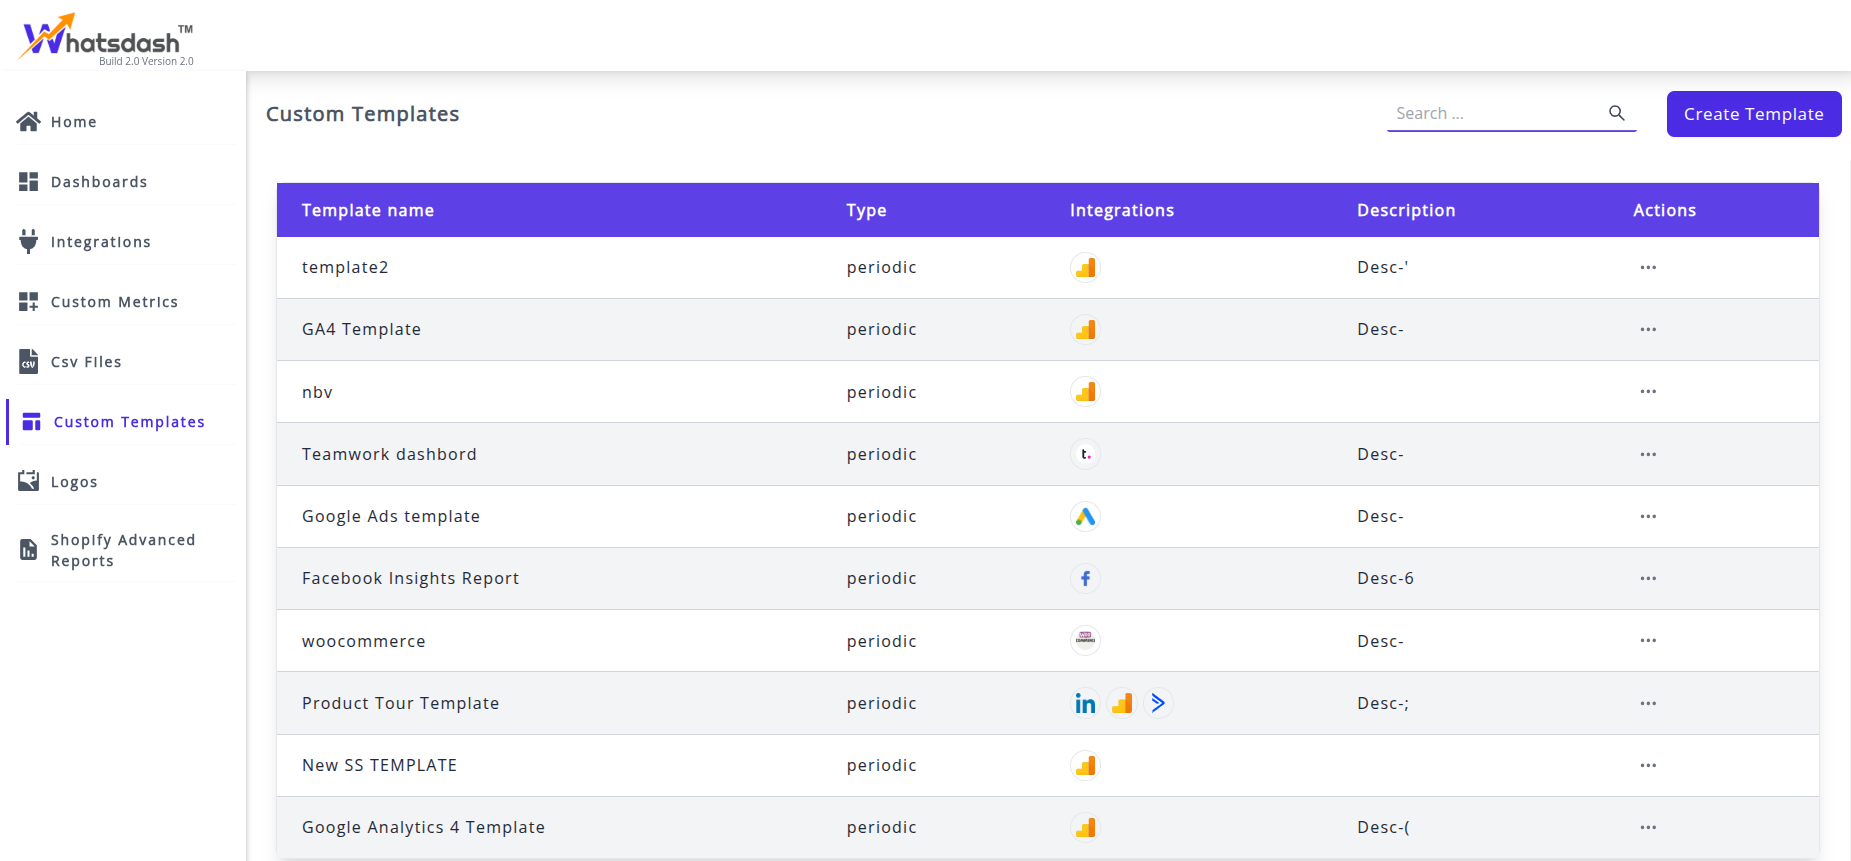
- To create a Custom Template ,click the "Create Template" button in the top-right position of the screen.

- The list of your existing dashboards will appear. Select the dashboard whose structure you want to save as your new template and provide Template Name and Template Description

- Click the "Save" button.The template will be created instantly and will appear in the main table on the Custom Templates page.
How to Use a Custom Template
Once saved, your custom template is immediately available for use when starting a new dashboard.
Whatsdash offers two primary methods to access and deploy the custom templates for the dashboard:
-
Method 1: Using the 'Create New Dashboard' Button
1.Navigate to the Dashboard Page and click the 'New Dashboard' button at the top right hand side of the screen.
2.The Create New Dashboard screen displays a list of pre-configured templates and custom templates specific to your connected integrations, alongside the Blank Periodic Dashboard or Blank Campaign Dashboard option for Periodic Dashboard or Campaign Dashboard respectively.
3.Choose the desired custom template from the list of your templates.

4.Name Your Dashboard.

5.Set Initial Preferences: Define the default Time Period (e.g.- Monthly).
6.Secure your Dashboard with password. (Optional)

7.Choose the desired data source from the specific integration.

The new Dashboard with the chosen template will be created.
-
Method 2: Using the 'Custom Templates' Button
1.Find the 'Custom Templates' button located at the top of the Dashboard Page.
2.Clicking this button opens a dedicated template gallery where you can view detailed previews of each template individually.
3.In each template you get two options:
- View the template: Open the template as your new dashboard with a single click, instantly loading the structure.

- Manual Configuration: Choose to manually configure the template first by providing a custom name and selecting the specific data source(s) required before deployment.

Once you select or quick-deploy a template,your dashboard is now ready for use, with all initial metrics and widgets configured!
CUSTOM METRICS
Custom Metrics are user-defined measures that allow you to track and analyze unique performance indicators that are not covered by the standard, pre-defined metrics provided by your integrated data sources.
What are Custom Metrics?
A Custom Metric is essentially a formula you define by combining multiple standard metrics (from one or more integrations) using mathematical operators and constants. They empower you to create tailored calculations directly relevant to your specific business goals, offering a granular level of insight for data-driven decisions.
-
Tailored KPIs: Create metrics that perfectly align with your unique business model .
-
Cross-Channel Aggregation: Combine metrics from different integrations (e.g., total ad spend by adding Facebook Ads and Google Ads spend) to generate a newer metric.
-
Consistent Reporting: Apply a single, standardized definition for a critical KPI across all your client reports.
How to Create a Custom Metric
Custom Metrics are typically created and managed from a centralized area in the Whatsdash platform.
-
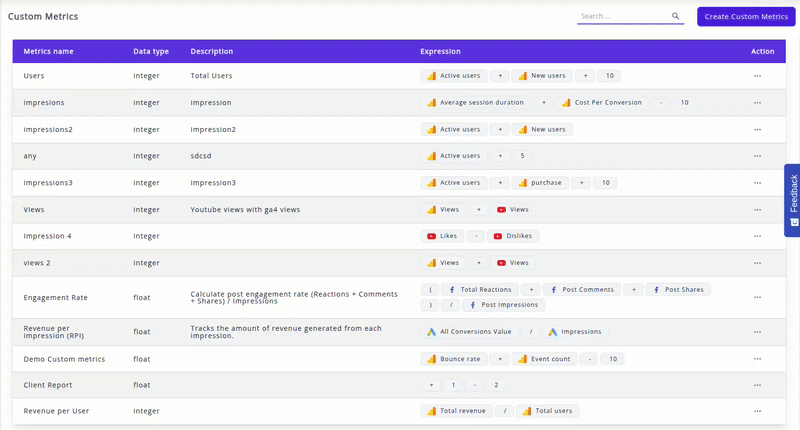
Step 1: Navigate to Custom Metrics Menu
1.Click the "Custom Templates" menu item in the navigation bar. A table listing all existing custom metrics will be displayed.The table consists of the integrations and the metrics that are used in the creation of custom metrics.
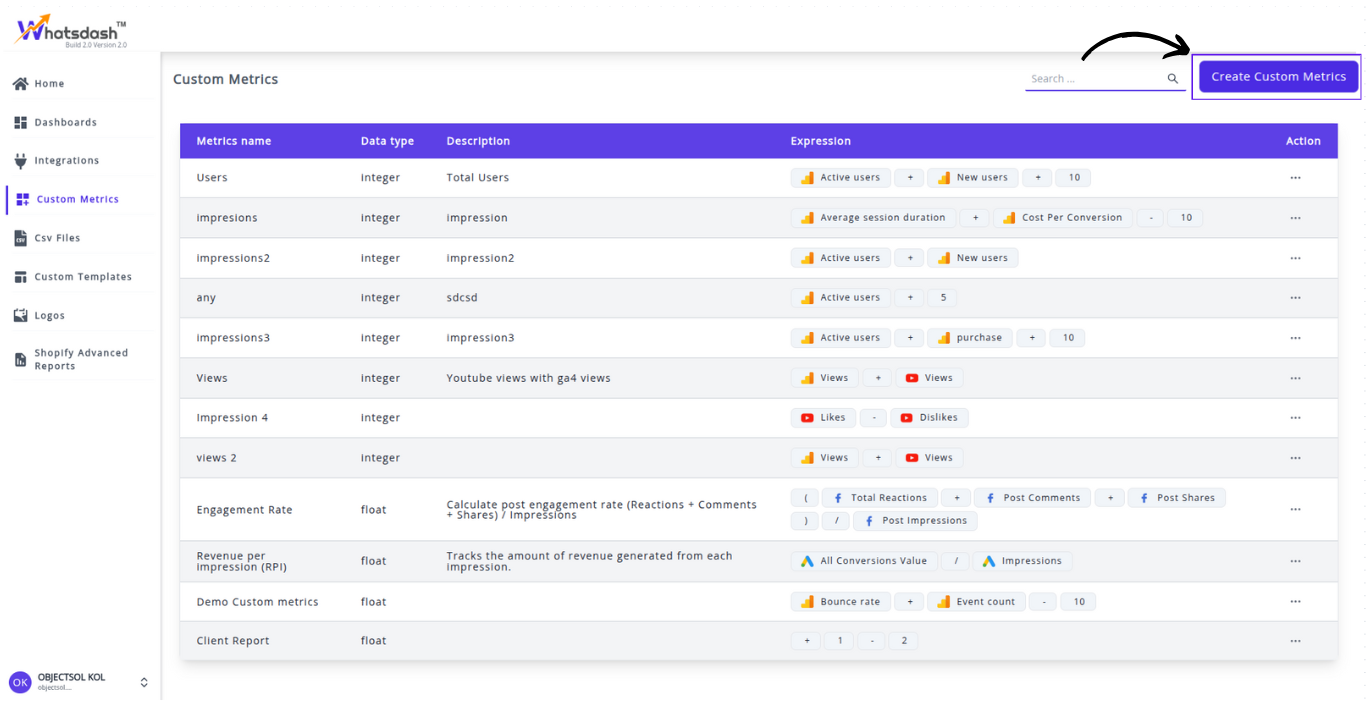
2.Click the 'Create Custom Metrics' button.
3.Define Metric Details:
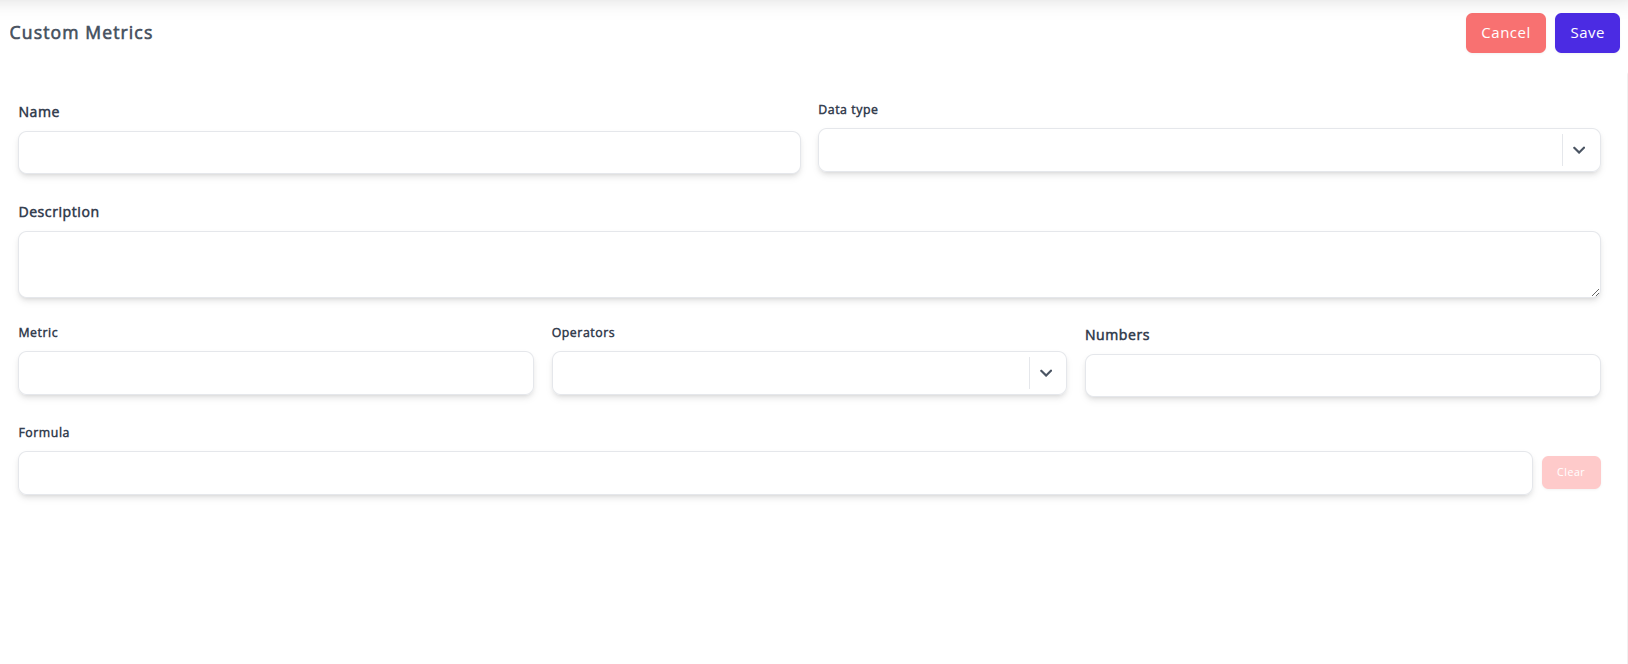
-
Name: Give your metric a clear, descriptive name (e.g., "Total Marketing Spend," "Lead to Purchase Rate"). This is the name that will appear in your widgets and reports.
-
Data Type: Select the appropriate format for the final output:
-
Integer (Whole Number)
-
Float (Number with decimal places)
-
Currency (Requires selecting a currency)
-
Percent
-
Description (Optional): Add a brief explanation of the formula or its business use for internal reference.
-
Build the Formula:
Use the Smart Formula Editor to construct your calculation.
Insert Metrics: Begin typing or use the provided dropdown to select metrics from your connected data sources. For example, to calculate ROAS, you might select Sales (from Shopify) and Cost (from Google Ads).
-
Add Operators: Use mathematical operators (+, −, ×, ÷) and parentheses to define the order of operations.
4.Click on the 'SAVE' button to finalize the custom metric. The new metric will now be available for use in all your dashboards and reports under Custom Metrics Widget.
-
How to Use a Custom Metric
Once created, Custom Metrics are available to a dashboard just like any standard metric.
-
Open your Dashboard : Open the desired Periodic Dashboard or Campaign Dashboard from the Dashboard Page.
-
Add a Widget : Click on Custom Metrics Widget option.Choose your named Custom Metrics and the widget will be added in the dashboard
-
Display : The widget will load, with the data calculated using the formula of the custom metrics and display the result according to the Data Visualization Type you selected.
CSV FILES
The CSV Files feature in Whatsdash allows you to connect and visualize data from sources that are not covered by our standard integrations. This is crucial for incorporating proprietary metrics, sales data, historical spreadsheets, or any unique business information directly into your Whatsdash reports and dashboards.
By creating a CSV template, you define the structure of your custom data, making it a permanent and reusable source within the platform.
Overview
The CSV feature in Whatsdash allows you to:
-
Import Custom Data: Integrate data from a standard Comma Separated Values (.csv) file format.
-
Create Reusable Templates: Define a structure (columns, data types, formats) that can be reused for future data uploads.
-
Generate Dashboard Widgets: Use your custom CSV columns (Metrics and Dimensions) to build charts, tables, and scorecards on any Whatsdash dashboard.
How to Add CSV Files

-
Navigate to the CSV Files in the Navigation Menu.
-
Click on any existing CSV Templates that has been created previously to edit them, or proceed to Step 3.

-
Click on the 'Create CSV Template' button to create a new CSV Template from an external CSV file.
-
A new 'Create CSV Template' screen appears. Here:

-
Browse and select CSV from your system. This file serves as the blueprint for the template structure.
-
Add a name for the template (e.g., "Monthly Sales Data"). This name will be used to identify the data source across the platform.
-
Map Data Fields: From the CSV headers or columns, specify the unique identifier, metrics (numerical values), dimensions (text/categorical values), and the date field.
-
The newly created CSV template appears in the list on the CSV Files screen and is now ready to be activated as an Integration.
How to Use CSV Files Templates
-
Once the template is created, you must connect it as a data source in Integrations to make the data available for all your dashboards.
-
Navigate to the Integrations in the Navigation bar.
-
From the list of the Integrations, choose the CSV Files connector.
-
Select the name of the template you just created . This action adds the CSV data source to your list of active integrations.
-
Once you connect the newly created data source in the Integrations, the data will be available to every dashboard, just like any other platform connector (e.g., Google Ads or Facebook). You can now select it when configuring widgets.
👉 For further details and advanced explanations on using CSV from integrations, refer to the CSV Integrations section.
LOGOS
The Logos feature is a core component of Whatsdash's White Label functionality, primarily used by agencies and businesses to replace the default Whatsdash branding with their own, or their client's, logo on dashboards and reports.
Overview
The Logo Manager is a centralized location in Whatsdash for uploading and managing all the image assets (logos) you intend to use across your dashboards and white-label reports. Once uploaded, a logo can be easily assigned to a user, client, or specific dashboard template.
Key Features of Logo Management
-
White Labeling: Replace the Whatsdash logo with your agency's or client's logo on all shared reports and dashboards.
-
Template Customization: Logos can be integrated into custom dashboard templates for brand-specific report designs.
-
Client Specificity: Easily manage multiple logos for different clients or brands, ensuring each report is uniquely branded.
How to Manage Logos and Access the Logo Manager:
Steps to Manage Logos
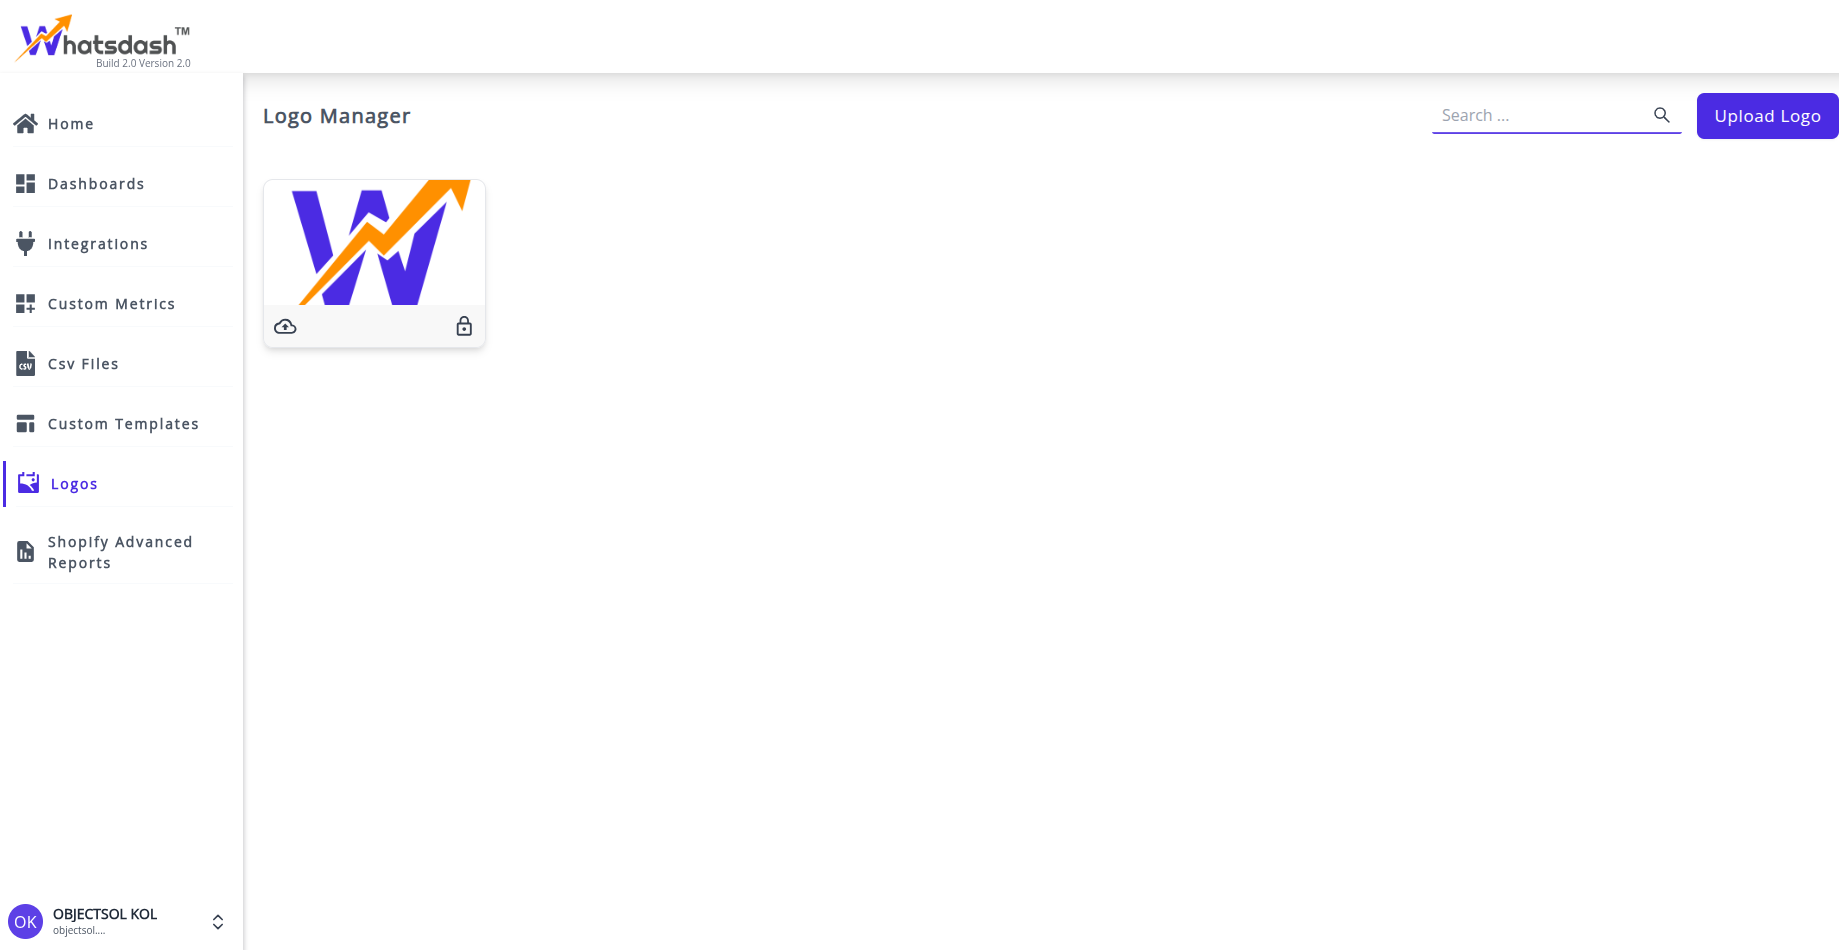
1.Navigate to 'Logos' in the Whatsdash navigation menu.
2.On opening the dashboard, click the 'Upload Logo' icon. A dialog box with Choose File option appears.
3.Browse and select the logo file from your computer.
![]()
4.File Requirements:
-
Format: PNG (recommended for transparency), JPG, or SVG.
-
Size: Optimal dimensions (e.g., 200px wide) and a transparent background are recommended for a seamless fit on dashboards.Logo should have the dimensions 16 : 9 to be displayed properly.
-
Name: Give the logo a recognizable name.
-
Save: Confirm the upload to save the logo to your asset library.
How To Apply Logo to a Dashboard
1.Open any of your existing dashboard from the Dashboard Page.For creating a new dashboard,click here.
![]()
2.Click on the 'Add Logo' icon on the top-left side of the dashboard.A 'Upload Logo' dialog box appears.
3.Select the added logos and Click 'Save' button.
4.The selected Logo will be appeared in the Dashboard.
Facebook Ads
Facebook Ads is Meta's powerful advertising platform, enabling businesses to create, target, and manage paid campaigns across Facebook, Instagram, Messenger, and Audience Network to reach specific audiences and drive measurable results.
Connecting Facebook Ads to Whatsdash lets you quickly and easily review your Ad Spend, Conversions, Return on Ad Spend (ROAS), and Cost per Result across all campaigns, ad sets, and ads, centralized alongside your website and sales data.
Why Connect Facebook Ads to Whatsdash?
Integrating your Facebook Ads data with Whatsdash transforms raw performance metrics from Ads Manager into clear, actionable business intelligence, essential for optimizing your budget and maximizing ROI.
-
Campaign Performance Audit : Monitor granular metrics like CPC, CTR, Frequency, and CPA by Ad, Ad Set, or Campaign, allowing for fast, data-driven optimization decisions.
-
Cross-Channel ROI Analysis : Blend Facebook Ads Amount Spent and Conversions with GA4 data to determine true Return on Ad Spend (ROAS) and budget allocation across platforms.
-
Simplified Reporting & Collaboration : Automatically generate clean, visual reports for clients or stakeholders without having to manually export data from Meta Ads Manager.
📋 Steps to Integrate your Facebook Ads Account to Whatsdash
✔️ Navigate to the 'Integrations' page using the Navigation bar.
✔️ Select Facebook Ads from the Available Integrations.

✔️ Click the + button to open the Facebook authorization window.
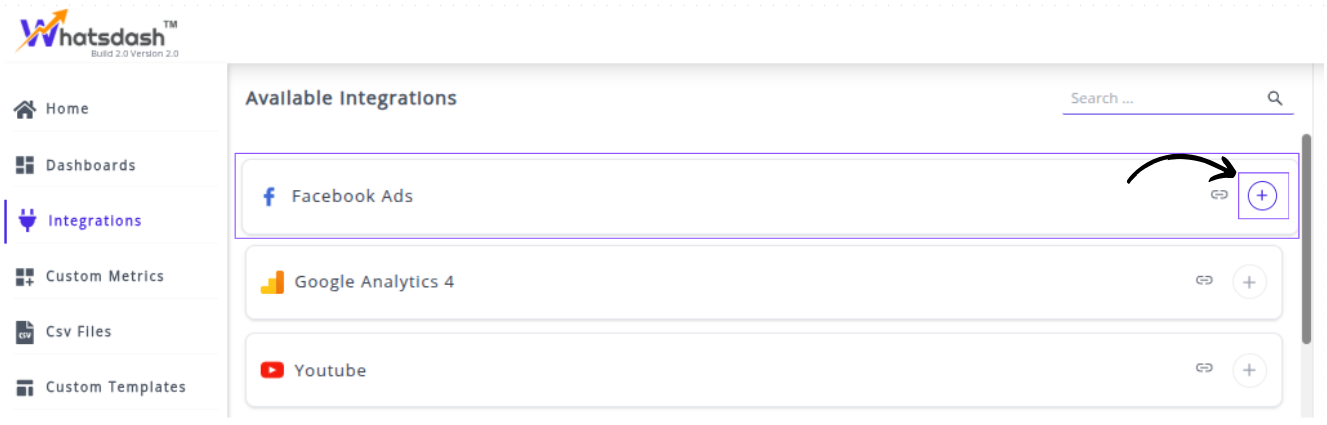
✔️ You will be redirected to a Facebook login and authorization page. Select the Facebook account that is an administrator or editor of the Facebook Business Page you want to track.

✔️ Grant Whatsdash the necessary permissions to Read your Facebook Page Insights data.
✔️ Once authenticated, you will be directed back to Whatsdash. Your Facebook Insights Integration will appear in the Connected Integrations list.

✔️ You can now create or customize dashboards using your Facebook Ads Metrics and Dimensions.
👉 How to visualize this data in your dashboard, visit the Dashboard Documentation Guide
🔗 Facebook Ads Metrics
Below is a comprehensive list of Facebook Ads metrics, categorized by purpose.
| Name | Category | Description |
|---|---|---|
| Cost per 3-Second Video View | Engagement | The average cost for each 3-second video view. |
| Appointments Scheduled | Conversion | The number of schedule events tracked by the pixel on your website and attributed to your ads. |
| 30-Second Video Views | Engagement | The number of times the video was watched for a total of at least 30 seconds, or nearly its total length. |
| Applications Submitted | Conversion | The number of submit application events tracked by the pixel on your website and attributed to your ads. |
| 3-Second Video Views | Engagement | The number of times your video was watched for at least 3 seconds or nearly its full length. |
| Actions | Performance | Total actions users took that can be directly attributed to the ads (engagement, clicks, or conversions). |
| Applications Submitted Conversion Value | Conversion | Total value of submit application events tracked with the conversions objective. |
| Appointments Scheduled Conversion Value | Conversion | Total value of schedule events tracked with the conversions objective. |
| Cost per Applications Submitted | Conversion | Average cost of each submit application event. |
| Cost per Event Response | Engagement | Average cost for each event response. |
| Cost Per Inline Post Engagement | Engagement | Average cost of each inline post engagement. |
| Cost per Landing Page View | Engagement | Average cost for each landing page view. |
| Cost per Outbound Click | Engagement | Average cost for each outbound click. |
| Cost per Post Engagement | Engagement | Average cost of each post engagement. |
| Cost per Post Share | Engagement | Average cost of each post share. |
| Cost per Website Checkout Initiated | Conversion | Average cost of each initiated website checkout. |
| Cost per Website Purchase | Conversion | Average cost of each website purchase. |
| CTR (Link Click-Through Rate) | Engagement | Percentage of times users saw the ad and completed a link click. |
| Frequency | Performance | Average number of times each user saw the ad. |
| Inline Post Engagement | Engagement | Total number of actions users took involving the ads (or posts). |
| Link Clicks | Engagement | Number of clicks on ad links to select destinations or experiences. |
| Location Searches | Conversion | Number of find location events tracked by the pixel on your website. |
| Page Likes | Engagement | Number of Facebook Page likes attributed to your ads. |
| People Taking Actions | Performance | Total number of users who took an action attributed to the ads. |
| Products Customized | Conversion | Number of customize product events tracked by the pixel and attributed to your ads. |
| ROI (Return on Investment in %) | Conversion | ROI percentage based on conversion value minus cost, divided by campaign cost. |
| Amount Spent | Performance | Estimated total amount of money spent on the campaign, ad set, or ad. |
| Unique Clicks (All) | Engagement | Total number of unique users who clicked on the ad. |
| Website Purchases Conversion Value | Conversion | Total value of website purchases conversions. |
| Website Registration Completed | Conversion | Number of completed registration events tracked and attributed to your ads. |
| Clicks (All) | Performance | Total number of clicks on an ad. |
| Contacts | Conversion | Number of contact events tracked by the pixel and attributed to your ads. |
| Contacts Conversion Value | Conversion | Total value of contact events tracked with the conversions objective. |
| Cost per Contacts | Conversion | Average cost of each contact event. |
| CPC (Cost per Inline Link Click) | Engagement | Average cost for each inline link click. |
| Cost per Page Mention | Engagement | Average cost of each Facebook Page mention. |
| Cost per ThruPlay | Engagement | Average cost for each ThruPlay. |
| Cost Per Unique Action | Performance | Cost divided by total unique users who took an action attributed to the ads. |
| Cost per Website Registration Completed | Conversion | Average cost of each website registration completed. |
| Event Responses | Engagement | Number of people who responded "Interested" or "Going" to a Facebook event. |
| Link Clicks Conversion Rate | Conversion | Number of conversions divided by number of link clicks. |
| Outbound Clicks | Engagement | Clicks on links that take people off Facebook-owned properties. |
| Return on Ad Spend (ROAS in $) | Conversion | Total return on ad spend from website conversions in currency. |
| ThruPlays | Engagement | Number of times your video was played to completion or at least 15 seconds. |
| Total Leads | Conversion | Number of leads attributed to your ads (on and off Facebook). |
| Website Adds To Cart | Conversion | Number of add-to-cart events tracked and attributed to your ads. |
| Website Leads | Conversion | Number of lead events tracked by the pixel and attributed to your ads. |
| Cost per Appointments Scheduled | Conversion | Average cost of each schedule event. |
| Cost per On-Facebook Lead | Conversion | Average cost of each On-Facebook Lead. |
| Cost per Page Like | Engagement | Average cost for each Facebook Page like. |
| Cost per Post Comment | Engagement | Average cost for each post comment. |
| Cost per Subscriptions | Conversion | Average cost of each subscribe event. |
| Cost per Total Leads | Conversion | Average cost of each total lead event. |
| Cost per Website Add To Cart | Conversion | Average cost of each website add-to-cart event. |
| Cost per Website Content Views | Conversion | Average cost of each website content view. |
| Cost Per Unique Click (All) | Engagement | Average cost for each unique click (all). |
| CPM (Cost per 1000 Impressions) | Performance | Average cost for 1,000 impressions. |
| CTR (All) | Performance | Percentage of times users saw the ad and clicked (all). |
| Landing Page Views | Engagement | Number of times users viewed your ad’s destination URL after clicking. |
| On-Facebook Leads | Conversion | Number of leads submitted directly on Facebook-owned platforms. |
| Outbound CTR | Engagement | Percentage of times users saw your ad and performed an outbound click. |
| Post Comments | Engagement | Number of comments on your ads. |
| Post Shares | Engagement | Number of times your ads were shared. |
| Reach | Performance | Total number of unique users who saw the ads at least once. |
| Subscriptions | Conversion | Number of subscribe events tracked and attributed to your ads. |
| Total Conversion Value | Performance | Total value of all conversions attributed to the ad. |
| Unique Link Clicks | Engagement | Number of people who performed a link click. |
| Video Watches at 100% | Engagement | Number of times a video was watched to completion. |
| Website Checkouts Initiated | Conversion | Number of initiated checkout events tracked by the pixel. |
| Website Content Views | Conversion | Number of view-content events recorded by the pixel. |
| Website Purchase ROAS (Return on Ad Spend - $) | Conversion | ROAS from website purchases in currency. |
| Cost Per Any Action | Performance | Total cost divided by number of actions taken on an ad. |
| CPC (Cost per Link Click) | Engagement | Average cost for each link click. |
| Cost per Location Searches | Conversion | Average cost for each find location event. |
| Cost per Post Reaction | Engagement | Average cost for each post reaction. |
| Cost per Products Customized | Conversion | Average cost for each product customization event. |
| Cost per Unique Link Click | Engagement | Average cost for each unique link click. |
| Cost per Website Lead | Conversion | Average cost for each website lead. |
| CPC (All) | Performance | Average cost for all clicks. |
| Cost per 1000 People Reached | Performance | Reach of ad divided by total cost, multiplied by 1,000. |
| Impressions | Performance | Number of times an ad was displayed (including repeats). |
| Inline Link Clicks | Engagement | Clicks on links to select destinations or experiences within ads. |
| Location Searches Conversion Value | Conversion | Total value of find location events tracked with the conversions objective. |
| Page Engagement | Engagement | Total number of attributed actions taken on your Page or posts. |
| Page Mentions | Engagement | Number of times your Page was mentioned in posts or comments. |
| Post Engagement | Engagement | Total number of actions people took involving your ads. |
| Post Reactions | Engagement | Number of reactions (Like, Love, Wow, etc.) on your ads. |
| Products Customized Conversion Value | Conversion | Total value of customize product events tracked with the conversions objective. |
| Return on Ad Spend (ROAS in %) | Conversion | Percentage-based return on ad spend from website conversions. |
| ROI (Return on Investment in $) | Conversion | ROI in currency calculated from conversion value minus cost. |
| Subscribe Conversion Value | Conversion | Total value of subscribe events tracked with the conversions objective. |
| Unique CTR (All) | Engagement | Percentage of people who saw the ad and performed a unique click. |
| Website Purchases | Conversion | Number of purchase events tracked by the pixel. |
| Website Purchase ROAS (Return on Ad Spend - %) | Conversion | Percentage-based ROAS from website purchases. |
🔗 Facebook Ads Dimensions
The table below lists the Facebook Ads Dimensions available through the Whatsdash Facebook Ads Integration.
| Name | Category | Why It’s Useful |
|---|---|---|
| Ad ID | Performance | Identifies each ad uniquely, allowing precise tracking and troubleshooting. |
| Device Category (Desktop / Mobile) | Performance | Shows whether users engage more on mobile or desktop, helping optimize device targeting. |
| Ad Set | Performance | Analyzes results grouped by ad sets to adjust audience, bid, or creative strategies. |
| Ad Name | Performance | Useful for comparing the performance of specific ad creatives by name. |
| Ad with Image | Performance | Displays ad creatives alongside performance data for visual context and review. |
| Gender | Performance | Helps determine which gender group responds better to your ads. |
| Action Type | Performance | Breaks down actions (clicks, likes, shares, etc.) to identify high-performing interactions. |
| Ad Account Name | Performance | Distinguishes data across multiple ad accounts under the same business. |
| Region | Performance | Provides insight into which regions perform best, useful for localizing campaigns. |
| Ad Account Name (with ID) | Performance | Prevents confusion between accounts with similar names by using unique IDs. |
| Platform & Device | Performance | Highlights where your ads perform best — e.g., Facebook Mobile Feed vs. Instagram Stories. |
| Age | Performance | Reveals which age groups are most engaged, aiding in demographic targeting. |
| Campaign Name | Performance | Links results directly to campaigns, simplifying reporting and comparison. |
| Country ISO Code | Performance | Standardized country code helps in exporting and filtering international campaign data. |
| Impression Device | Performance | Identifies which devices users used to view ads for better optimization. |
| Placement | Performance | Analyzes where your ads were shown (e.g., Feed, Reels, Marketplace) to improve delivery strategy. |
| Platform | Performance | Distinguishes between platforms (Facebook, Instagram, Messenger, etc.) for cross-platform insights. |
|
🔗 Explore More Integrations
Whatsdash supports a wide range of marketing, analytics, and eCommerce integrations to give you a holistic view of your business performance.
👉 Visit the Integrations Page to explore all available connections
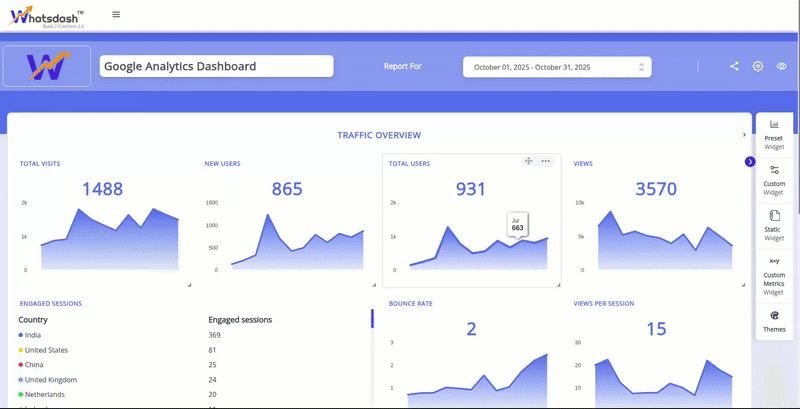
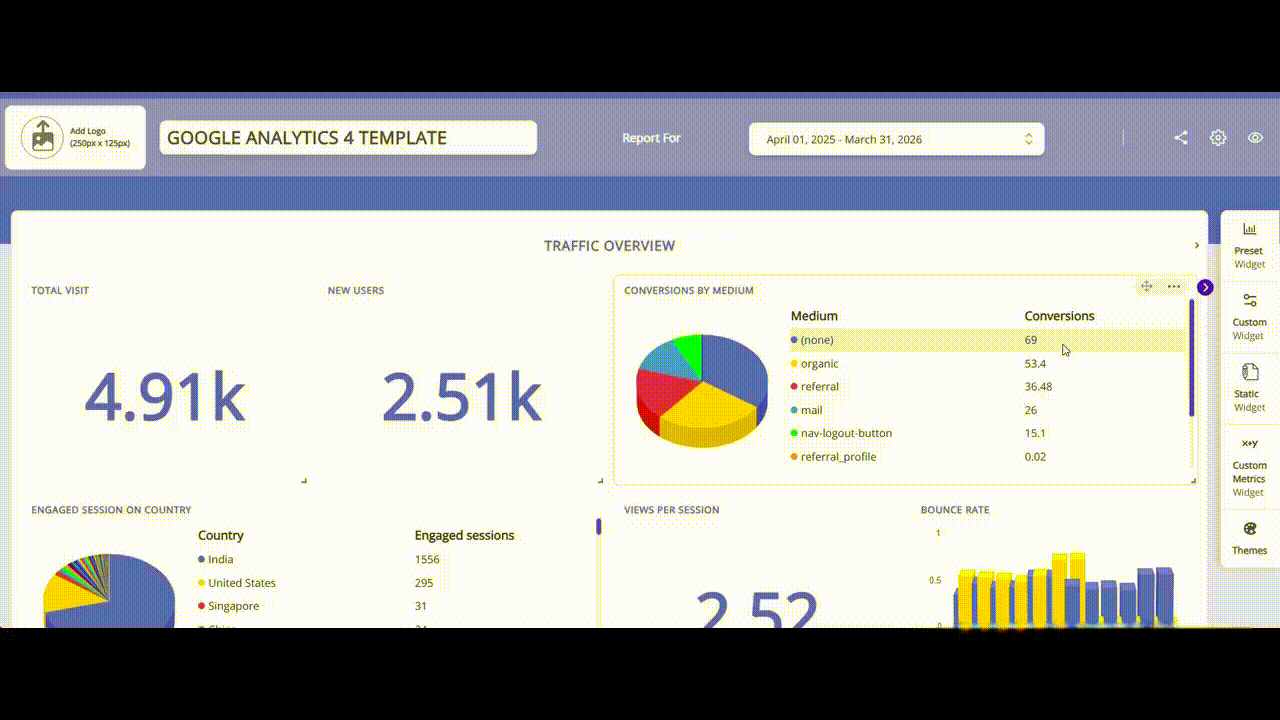
Google Analytics 4
Google Analytics 4 allows you to integrate user and event data directly into Whatsdash for advanced reporting and analysis alongside other business metrics.
Why Connect GA4 to Whatsdash?
Integrate your GA4 data with Whatsdash to transforms raw website and app data into clear, actionable business insights for all users, regardless of their technical skill level.
- Simplified Reporting & Dashboards : Get instant, visual reports using pre-built templates without having to navigate GA4's complex exploration tools.
- Custom Metrics & Granular Control : Go beyond the standard GA4 reports by creating Custom Metrics and visualizations based on the event-driven data model, giving you precise control over how complex user behavior is measured and presented.
- Data Blending & Cross-Channel Analysis : Blend granular GA4 event data with sales, CRM, and ad spend data from other sources.
📋 Steps to Integrate your Google Analytics 4 account to Whatsdash
✔️ Navigate to the 'Integrations' page using the navigation bar at the top.
✔️ Select Google Analytics 4 from the list of Available Integrations.
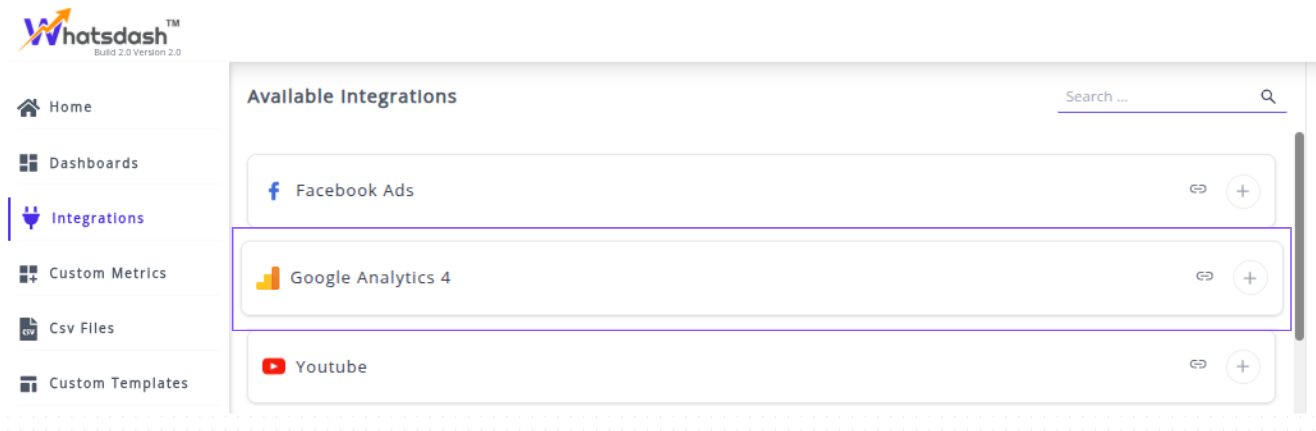
✔️ Click + button to open the Facebook authorization window.

✔️ You will be redirected to a Google sign-in page. Select the Google account that has access to your GA4 property.
✔️ Grant Whatsdash the necessary permissions to Read your Google Analytics data.
✔️ Once authenticated, you will be directed back to Whatsdash. Your Google Analytics Integration will appear in the Connected Integrations list.

✔️ You can now create or customize dashboards using your Google Analytics (GA4) metrics and Dimensions.
👉 How to visualize this data in your dashboard, visit the Dashboard Documentation Guide
🔗 Google Analytics 4 Metrics
Below is a comprehensive list of GA4 metrics, categorized by purpose.
You can use this as a reference when building dashboards, mapping API fields, or explaining metric meanings.
| Name | Category | Why It's Useful |
|---|---|---|
| Add-to-carts | Ecommerce | Tracks early purchase intent and interest in products. |
| Advertiser Ads Cost Per Click | Advertising | Helps optimize ad spend efficiency per click. |
| Average purchase revenue per user | Revenue | Measures revenue contribution per active user. |
| Bounce rate | Session | Identifies sessions with low engagement for UX improvements. |
| Cost per purchase | Conversions | Evaluates cost-effectiveness of driving purchases. |
| Engaged sessions | Session | Tracks sessions with meaningful engagement. |
| Engaged sessions per user | Acquisition | Measures engagement depth per user. |
| Item list clicks | Ecommerce | Shows interest in products from listings. |
| Items purchased | Ecommerce | Tracks product sales volume. |
| Item promotion views | Ecommerce | Monitors exposure of promoted products. |
| Purchase-to-view rate | Ecommerce | Measures conversion efficiency from product views. |
| Session conversion rate | Acquisition | Indicates conversion likelihood per session. |
| Shipping amount | Ecommerce | Useful for revenue tracking from shipping. |
| Total revenue | Revenue | Measures total earnings across all sources. |
| Active users | User | Counts distinct users visiting site/app. |
| Margin | Advertising | Evaluates profitability after ad costs. |
| Average purchase revenue | Revenue | Tracks average transaction value. |
| Cart-to-view rate | Ecommerce | Measures conversion from product views to cart additions. |
| First-time purchasers per new user | User | Tracks new user conversion into buyers. |
| Views | Page / screen | Monitors content consumption per user. |
| Scrolled Users | User | Measures content engagement depth. |
| Transactions | Ecommerce | Tracks completed purchases. |
| Transactions per purchaser | Ecommerce | Measures purchase frequency per buyer. |
| Cost Per Conversion | Advertising | Evaluates cost efficiency for driving conversions. |
| Average session duration | User | Measures average engagement time per session. |
| Checkouts | Ecommerce | Tracks number of checkout initiations. |
| Conversions | Event | Counts conversion events triggered. |
| Purchase | Conversions | Measures number of purchase conversions. |
| E-commerce purchases | Ecommerce | Tracks completed e-commerce transactions. |
| Engagement rate | Session | Indicates percentage of engaged sessions. |
| Event count per user | Event | Measures average event interactions per user. |
| Event value | Event | Tracks total value attributed to events. |
| First-time purchaser conversion % | User | Percentage of new users making first purchase. |
| First-time purchasers | User | Counts users completing first purchase. |
| Item views | Ecommerce | Tracks number of times product details are viewed. |
| Item promotion clicks | Ecommerce | Measures interaction with promoted items. |
| Views per session | Page / screen | Shows average pages/screens viewed per session. |
| Sessions | Session | Tracks total sessions initiated. |
| Sessions per user | Acquisition | Measures average sessions per user. |
| User conversion rate | Acquisition | Percentage of users triggering any conversion. |
| Advertiser Ads Clicks | Advertising | Tracks total ad clicks. |
| Advertiser Ads Cost | Advertising | Measures total spend on ads. |
| Advertiser Ads Impressions | Advertising | Shows total ad impressions delivered. |
| CTR (%) | Advertising | Indicates ad effectiveness in generating clicks. |
| Average engagement time per session | User | Tracks time spent actively engaging per session. |
| Event count | Event | Total number of events triggered. |
| Events per session | Event | Average events per session for interaction analysis. |
| Item list views | Ecommerce | Shows product discovery via item lists. |
| Item revenue | Ecommerce | Measures revenue generated from individual items. |
| New users | User | Counts first-time users for growth tracking. |
| % New Users | User | Tracks proportion of new users. |
| Purchase revenue | Ecommerce | Total revenue from purchases. |
| Purchaser conversion % | User | Percentage of users who completed one or more purchases. |
| Return On Ad Spend ($) | Advertising | Measures ad spend profitability. |
| Tax amount | Ecommerce | Tracks taxes associated with transactions. |
| Total purchasers | User | Counts users who completed purchases. |
| Total users | User | Counts all unique active users. |
| User engagement duration | User | Measures total active engagement time on site/app. |
🔗 Google Analytics 4 Dimensions
Below is a comprehensive list of GA4 dimensions used in reporting, along with their categories and why they are useful for analysis.
| Name | Category | Why It's Useful |
|---|---|---|
| Interest | Ecommerce | Helps understand users’ preferences and shopping funnel segments. |
| Day of week | Time | Useful for identifying patterns by day for engagement or conversion. |
| First user source / medium | Traffic source | Tracks acquisition channels for new users. |
| Google Ads Keyword text | Google Ads | Measures keyword performance for conversion events. |
| Hour | Time | Useful to analyze time-of-day activity and peak usage hours. |
| Item category | Ecommerce | Organizes products for detailed reporting and analysis. |
| Item category 2 | Ecommerce | Provides second-level classification for product analysis. |
| Item category 3 | Ecommerce | Provides third-level classification for product analysis. |
| Item category 4 | Ecommerce | Provides fourth-level classification for product analysis. |
| Item category 5 | Ecommerce | Provides fifth-level classification for product analysis. |
| Session campaign | Traffic source | Tracks which campaign initiated the user session. |
| Continent | Geography | Useful for regional segmentation of users. |
| City | Geography | Helps analyze user activity at a city level. |
| Region | Geography | Tracks activity at regional level for reporting. |
| Country | Geography | Provides country-level analytics for user activity. |
| First user Google Ads account name | Google Ads | Tracks which Google Ads account first acquired the user. |
| Google Ads ad group name | Google Ads | Useful for ad group-level performance analysis. |
| First user Google Ads ad group name | Google Ads | Measures initial acquisition performance by ad group. |
| First user Google Ads campaign | Google Ads | Tracks which Google Ads campaign acquired the user. |
| First user Google Ads campaign type | Google Ads | Helps analyze campaign type effectiveness in acquiring users. |
| Session Google Ads campaign type | Google Ads | Tracks campaign type driving sessions. |
| Campaign | Attribution | Measures which marketing campaign drove conversions. |
| Campaign ID | Google Ads | Useful for identifying specific campaigns in reporting. |
| Default channel grouping | Attribution | Helps group conversions by default marketing channel. |
| First user default channel grouping | Traffic source | Tracks acquisition channel for new users. |
| Source / medium | Attribution | Provides detailed channel-level attribution. |
| Source | Attribution | Helps analyze where conversions originated from. |
| Source platform | Attribution | Measures the platform responsible for the conversion. |
| Session source platform | Traffic source | Tracks platform that initiated a session. |
| First user source platform | Traffic source | Tracks platform responsible for first user acquisition. |
| First user source | Traffic source | Identifies the initial acquisition source. |
| Session source | Traffic source | Tracks the source that initiated a session. |
| Session medium | Traffic source | Identifies medium initiating a session (e.g., email, social). |
| First user medium | Traffic source | Identifies acquisition medium for new users. |
| Google Ads customer ID | Google Ads | Unique identifier for Google Ads accounts for attribution. |
| Google Ads ad network type | Google Ads | Tracks which ad network led to conversion. |
| Session Google Ads ad network type | Google Ads | Identifies network driving the session. |
| Google Ads query | Google Ads | Tracks keyword that led to conversion. |
| First user Google Ads query | Google Ads | Measures initial search query acquiring the user. |
| Session Google Ads query | Google Ads | Tracks keyword that drove a session. |
| Full page URL | Page / screen | Analyzes specific pages visited by users. |
| Page location | Page / screen | Helps track exact URL of user activity. |
| Page path + query string | Page / screen | Useful for understanding the user journey. |
| Page path and screen class | Page / screen | Helps analyze specific screens or pages in apps/web. |
| Page path without query string | Page / screen | Simplifies URL reporting by removing query parameters. |
| Page title | Page / screen | Tracks content titles for reporting. |
| Page title and screen class | Page / screen | Analyzes pages or screens by their titles/classes. |
| Page title and screen name | Page / screen | Useful to identify content consumed by users. |
| Landing page | Page / screen | Identifies the entry page for sessions. |
| Content group | Page / screen | Organizes content for grouped reporting. |
| Content type | Page / screen | Categorizes content for analytics purposes. |
| Video URL | Video | Tracks the source URL for video engagement. |
| Video title | Video | Measures video-level engagement by title. |
| Video provider | Video | Identifies the video platform for tracking performance. |
| Device | Platform / device | Tracks user device type for segmentation. |
| Device category | Platform / device | Helps separate Desktop, Mobile, or Tablet users. |
| Device brand | Platform / device | Measures engagement by device manufacturer. |
| Device model | Platform / device | Useful for understanding device-specific behavior. |
| Mobile model | Platform / device | Tracks specific mobile device models. |
| Operating system | Platform / device | Segments users by OS for compatibility analysis. |
| OS version | Platform / device | Useful for analyzing activity by OS version. |
| Operating system with version | Platform / device | Provides detailed OS version analytics. |
| Screen resolution | Platform / device | Helps design UX/UI for the most common screen sizes. |
| Platform | Platform / device | Measures which platform users are on (web, iOS, Android). |
| Stream name | Platform / device | Identifies data stream for tracking website/app. |
| Stream ID | Platform / device | Numeric identifier for website/app data stream. |
| Language | Platform / device | Tracks user language preference for localization. |
| Browser | Platform / device | Measures which browsers users are using. |
| Hour | Time | Helps analyze activity by hour of the day. |
| Day of week | Time | Tracks day-level engagement patterns. |
| Week | Time | Tracks week-level user activity trends. |
| Month | Time | Analyzes monthly trends. |
| Year | Time | Tracks annual trends. |
| Date | Time | Exact date for time-specific reporting. |
| Age | Demographics | Segments users by age brackets. |
| Gender | Demographics | Segments users by gender. |
| New / established | User | Differentiates new vs. returning users. |
| Session manual ad content | Session | Tracks ad content leading to sessions for analysis. |
| Session manual term | Session | Identifies search term that led to a session. |
| Method | General | Tracks how events were triggered. |
| Percent scrolled | General | Measures user engagement with content. |
| File extension | General | Useful to track file download types. |
| File name | General | Identifies downloaded file paths. |
| Property Name | General | Helps distinguish analytics properties. |
| Event name | Event | Identifies user actions for analysis. |
| Is conversion event | Event | Tracks whether the event counts as a conversion. |
| Link URL | Link | Monitors outbound link clicks for tracking. |
| Link text | Link | Tracks link text clicked by users. |
| Link domain | Link | Measures domain-level outbound link activity. |
| Link classes | Link | Useful for tracking link-specific CSS classes. |
| Link ID | Link | Tracks ID of outbound links or downloads. |
| Outbound | Custom | Identifies outbound links for tracking external traffic. |
| Item ID | Ecommerce | Tracks unique product identifiers. |
| Item name | Ecommerce | Monitors specific product activity. |
| Item affiliation | Ecommerce | Tracks affiliate or vendor for transactions. |
| Item variant | Ecommerce | Measures product variations for analysis. |
| Item brand | Ecommerce | Tracks performance by brand. |
| Item list name | Ecommerce | Organizes products in lists for discovery tracking. |
| Item list views | Ecommerce | Monitors product discovery in lists. |
| Item list clicks | Ecommerce | Tracks engagement with item lists. |
| Item revenue | Ecommerce | Measures revenue generated by specific items. |
| Item promotion name | Ecommerce | Tracks specific promotions driving engagement. |
| Item promotion views | Ecommerce | Monitors visibility of item promotions. |
| Item promotion clicks | Ecommerce | Measures interaction with promotions. |
| Transaction ID | Ecommerce | Tracks individual purchase transactions. |
| Order coupon | Ecommerce | Monitors coupon usage for promotions. |
| Shipping tier | Ecommerce | Tracks shipping selection for orders. |
💡 Tip : Connecting your Google Analytics 4 (GA4) property allows you to track website and app performance in one centralized dashboard. You can monitor user behavior, conversions, and content engagement across multiple streams in Whatsdash.
🔗 Explore More Integrations
Whatsdash supports a wide range of marketing, analytics, and eCommerce integrations to give you a holistic view of your business performance.
👉 Visit the Integrations Page to explore all available connections
Youtube
YouTube is the world's largest video-sharing platform, essential for content creators, marketers, and businesses to build brand awareness, engage audiences, and drive traffic. It provides detailed analytics on viewer behavior and content performance.
Why Connect YouTube to Whatsdash?
Integrating your YouTube data with Whatsdash transforms video performance and audience metrics into clear, actionable content insights for all users, regardless of their technical skill level.
-
Custom Video Performance Tracking : Go beyond the YouTube Studio dashboard by creating custom reports that analyze key metrics like Views, Watch Time, and Average View Duration by Video Title and Country, helping you refine your content strategy.
-
Automated ROI & Conversion Tracking : Use Custom Metrics to blend YouTube Ad Revenue or Estimated Earnings with lead or sale data from your CRM/GA4 to calculate the true Return On Investment (ROI) of your video marketing efforts.
-
Audience Engagement & Reach : Track Youtube Metrics like Comments, Likes, and Subscribers alongside Impressions and Click-Through-Rate (CTR) to measure the organic reach and community engagement effectiveness of your video content.
-
Simplified Reporting & Dashboards : Get instant, visual reports on high-level KPIs like Total Views, Subscriber Growth, and Estimated Revenue, allowing for quick, data-driven decisions on video production budget and strategy.
📋 Steps to Integrate your YouTube account to Whatsdash
✔️ Navigate to the 'Integrations' page using the Navigation bar.
✔️ Select YouTube from the Available Integrations.

✔️ Click the + button to open the Google authorization window.

✔️ You will be redirected to a Google sign-in page. Select the Google account that has ownership or manager access to the YouTube Channel you wish to connect.
✔️ Grant Whatsdash the necessary permissions to Read your YouTube Analytics and Reporting data.
✔️ Once authenticated, you will be directed back to Whatsdash. Your YouTube Integration will appear in the Connected Integrations list.

✔️ You can now create or customize dashboards using your YouTube Metrics and Dimensions.
👉 How to visualize this data in your dashboard, visit the Dashboard Documentation
🔗 Youtube Metrics
The table below lists the Youtube Metrics available through the Whatsdash Youtube Integration.
| Name | Category | Why it’s Useful |
|---|---|---|
| Comments Count | Engagement | Measures audience interaction and feedback on your videos. |
| Average View Duration Seconds | Watch time | Shows how long viewers watch on average, indicating content quality. |
| Likes | Engagement | Tracks positive viewer feedback and engagement with videos. |
| Subscribers Gained | Engagement | Indicates the number of new subscribers, helping assess growth. |
| Subscribers Lost | Engagement | Shows subscriber churn, helping identify content or engagement issues. |
| Views | View | Measures total video views, a key indicator of reach. |
| Estimated Minutes Watched | Watch time | Tracks total time viewers spend watching, reflecting video performance. |
| Dislikes | Engagement | Shows negative feedback, useful for content improvement. |
| Shares | Engagement | Indicates how often viewers share your content, helping measure virality. |
🔗 Youtube Dimensions
The table below lists the Youtube Dimensions available through the Whatsdash Youtube Integration.
| Name | Category | Why it’s Useful |
|---|---|---|
| Insight Playback Location Type | Playback Locations | Shows where your videos are being watched (e.g., YouTube watch page, embedded), helping optimize distribution. |
| Sharing Service | Engagement and content sharing | Indicates which platforms viewers use to share your content, useful for cross-platform promotion. |
| Insight Traffic Source Type | Traffic Sources | Shows how viewers are discovering your videos (e.g., search, suggested videos), helping refine SEO and promotion. |
| Country | Geographic areas | Identifies the countries where your audience is located, helping tailor content and marketing strategies. |
🔗 Explore More Integrations
Whatsdash supports a wide range of marketing, analytics, and eCommerce integrations to give you a holistic view of your business performance.
👉 Visit the Integrations Page to explore all available connections
HubSpot
HubSpot is a leading, AI-powered customer platform that brings together a full suite of software products designed to help businesses manage and grow their customer relationships.
It is an all-in-one solution for inbound marketing, sales, customer service, and operations, all centered around a free, flexible Customer Relationship Management (CRM) database.
Why Connect HubSpot to Whatsdash?
Integrate your HubSpot data with Whatsdash to transforms raw CRM and marketing automation data into clear, actionable business insights for all users, regardless of their technical skill level.
- Maintain Data Synchronization & Health : Automatically sync custom property data, lead scores, and list membership changes, ensuring your segmented lists and automation workflows run on clean, real-time data for peak efficiency.
- Enhance Sales Forecast Accuracy : Visualize pipeline velocity (how fast deals move) and compare historical sales cycle length against current performance to predict revenue more reliably.
- Achieve a 360-Degree Customer View : Report on the full customer lifecycle, linking service tickets, support interactions, and customer satisfaction (CSAT) scores directly to their initial marketing source for end-to-end attribution.
📋 Steps to Integrate your HubSpot account to Whatsdash
✔️ Navigate to the 'Integrations' page using the Navigation bar.
✔️ Select HubSpot from the Available Integrations.

✔️ Click the + button to open the HubSpot authorization window.

✔️ You will be redirected to the HubSpot login page. Enter your credentials and select the HubSpot account you wish to connect.
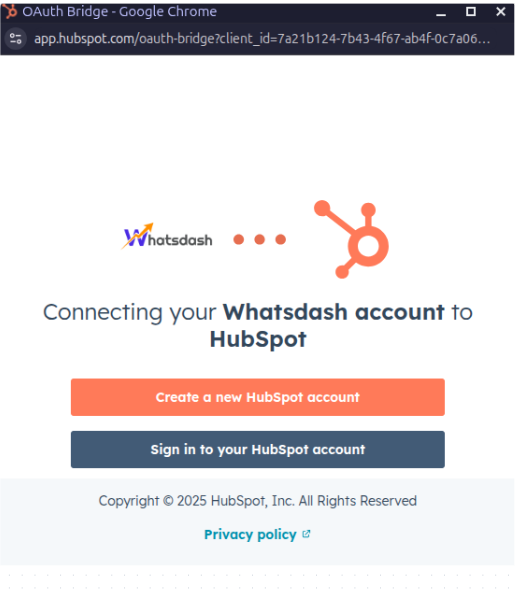
✔️ Review the requested permissions and click Connect App or Grant Access.
✔️ Once authenticated sucessfully, you will be directed back to Whatsdash. Your HubSpot Integration will appear in the Connected Integrations list.

✔️ You can now create or customize dashboards using your HubSpot Metrics and Dimensions.
👉 How to visualize this data in your dashboard, visit the Dashboard Documentation Guide
🔗 HubSpot Metrics
Below is a comprehensive list of HubSpot Metrics, categorized by purpose.
| Name | Category | Why It’s Useful |
|---|---|---|
| Customers (companies) | Companies | Tracks total customer companies to measure overall conversion success. |
| MQL (companies) | Companies | Monitors companies reaching marketing-qualified lead stage to assess lead generation quality. |
| New customers (companies) | Companies | Identifies newly converted customer companies over time for growth analysis. |
| New MQL (companies) | Companies | Shows how many companies have recently become marketing-qualified leads. |
| New subscribers (companies) | Companies | Tracks new company subscribers to monitor engagement expansion. |
| Customers (contacts) | Contacts | Measures total converted contacts to analyze sales success at individual level. |
| New subscribers (contacts) | Contacts | Tracks growth in new subscriber contacts for audience building. |
| Email Bounce Rate | Evaluates email deliverability issues to improve sender reputation. | |
| Email Click Rate | Measures engagement effectiveness of email content. | |
| Email Click-Through Rate | Reveals how engaging your emails are once opened. | |
| Email Open Rate | Indicates how well subject lines and timing attract attention. | |
| Emails Delivered | Confirms successful email delivery rate for campaign reliability. | |
| Average Session Duration | Web Analytics | Measures how long visitors stay on your website for engagement insights. |
| Companies | Companies | Tracks total companies stored in HubSpot for overall CRM health. |
| New opportunity (companies) | Companies | Identifies newly created company-level opportunities. |
| Subscribers (companies) | Companies | Monitors the number of companies in early engagement stage. |
| Contacts | Contacts | Counts total contacts to evaluate CRM size and growth. |
| Evangelists (contacts) | Contacts | Measures high-loyalty contacts who promote your brand. |
| Leads (contacts) | Contacts | Tracks leads in the CRM to gauge top-of-funnel activity. |
| List member count (contacts) | Contacts | Shows audience size per list for segmentation analysis. |
| MQL (contacts) | Contacts | Tracks contacts who meet marketing qualification criteria. |
| New leads (contacts) | Contacts | Measures how many new leads are entering your pipeline. |
| New MQL (contacts) | Contacts | Identifies recent marketing-qualified leads for nurturing. |
| New opportunity (contacts) | Contacts | Shows newly qualified sales opportunities at contact level. |
| SQL (contacts) | Contacts | Tracks sales-qualified leads ready for handoff to sales. |
| Subscribers (contacts) | Contacts | Monitors early-stage contacts engaged through subscriptions. |
| Email Spam Reports Rate | Measures spam complaints to maintain sender credibility. | |
| Pageviews | Web Analytics | Tracks total website views to measure overall web activity. |
| Emails Sent | Tracks total outbound email volume for campaign pacing. | |
| New Session Rate | Web Analytics | Shows percentage of first-time visitors for audience growth tracking. |
| Bounce Rate | Web Analytics | Indicates how often users leave after viewing one page — key for UX optimization. |
| New evangelists (companies) | Companies | Tracks company-level advocates who actively promote your brand. |
| New leads (companies) | Companies | Measures company-level lead generation growth. |
| Opportunity (companies) | Companies | Identifies companies currently in the opportunity stage. |
| Evangelists (companies) | Companies | Monitors companies that actively promote your brand. |
| Leads (companies) | Companies | Tracks company-level leads for pipeline visibility. |
| New SQL (companies) | Companies | Identifies companies newly qualified for sales. |
| SQL (companies) | Companies | Measures total companies ready for sales engagement. |
| New customers (contacts) | Contacts | Tracks newly converted customers at the contact level. |
| New SQL (contacts) | Contacts | Shows contacts recently moved to sales-qualified stage. |
| Email Opens | Tracks total number of times emails were opened. | |
| Email Reply Rate | Measures responsiveness of recipients to your email content. | |
| Pageviews Per Session | Web Analytics | Indicates average engagement per session for content performance. |
| New evangelists (contacts) | Contacts | Identifies contacts who recently became advocates. |
| Opportunity (contacts) | Contacts | Tracks contacts currently in opportunity stage. |
| Email Clicks | Shows total engagement with links in your emails. | |
| Email Delivered Rate | Measures the success rate of email delivery. | |
| Email Replies | Tracks direct responses to assess engagement depth. | |
| Email Spam Reports | Identifies total spam complaints to manage deliverability risk. | |
| Email Unsubscribes | Measures contact attrition from your mailing list. | |
| Emails Bounced | Tracks total failed email deliveries to maintain clean lists. | |
| Sessions | Web Analytics | Represents active engagement periods for visitor activity tracking. |
🔗 HubSpot Dimensions
Below is a comprehensive list of HubSpot Dimensions, categorized by purpose.
| Name | Category | Why It’s Useful |
|---|---|---|
| Lifecycle stage (companies) | Companies | Understands where each company stands in your sales funnel. |
| Original source (contacts) | Contacts | Identifies the first touchpoint for your contact acquisition. |
| UTM Content | Web Analytics | Tracks which content variation drives the most traffic or conversions. |
| Original source drill-down 2 (companies) | Companies | Provides detailed attribution for how companies first found you. |
| Original source (companies) | Companies | Reveals the original acquisition source for company-level contacts. |
| Latest source (contacts) | Contacts | Tracks the most recent interaction source to understand user behavior shifts. |
| Original source drill-down 1 (companies) | Companies | Adds more granular context on how companies discovered your brand. |
| Lifecycle stage (contacts) | Contacts | Helps categorize contacts by sales-readiness for targeted nurturing. |
| Last referring site (contacts) | Contacts | Shows which external site last referred visitors, useful for partnership tracking. |
| Last touch converting campaign (contacts) | Contacts | Identifies which campaign last converted a contact. |
| Last page seen (contacts) | Contacts | Reveals the last page a contact viewed for understanding drop-off behavior. |
| Latest source drill-down 1 (companies) | Companies | Tracks detailed source data for a company’s most recent visit. |
| Latest source drill-down 2 (contacts) | Contacts | Provides deeper insight into the latest session’s acquisition channel. |
| UTM Medium | Web Analytics | Helps analyze which medium (email, social, paid ads) drives key traffic. |
| UTM Campaign | Web Analytics | Associates traffic with specific marketing campaigns for performance tracking. |
| Source (web traffic) | Web Analytics | Identifies general traffic origin (e.g., organic, paid, referral). |
| Last touch converting campaign (companies) | Companies | Helps measure which campaign last converted associated contacts. |
| Latest source drill-down 2 (companies) | Companies | Gives advanced insight into the company’s most recent visit source. |
| Original source drill-down 1 (contacts) | Contacts | Offers detailed insight into a contact’s first acquisition source. |
| Original source drill-down 2 (contacts) | Contacts | Complements source drill-down 1 with more specific acquisition data. |
| Latest source drill-down 1 (contacts) | Contacts | Tracks which channel recently drove the contact’s website session. |
| List Name (contacts) | Contacts | Useful for segmenting or filtering contacts by predefined lists. |
| UTM Source | Web Analytics | Identifies the main source (Google, Facebook, etc.) driving visits. |
| First touch converting campaign (contacts) | Contacts | Attributes contact creation to the initial campaign touchpoint. |
| Latest source (companies) | Companies | Tracks the most recent traffic or interaction source for companies. |
| First touch converting campaign (companies) | Companies | Reveals which campaign initially created engagement at company level. |
| Email Name | Tracks performance across specific HubSpot email campaigns. | |
| First referring site (contacts) | Contacts | Identifies which external website first referred traffic. |
| First page seen (contacts) | Contacts | Helps analyze entry pages to understand visitor acquisition behavior. |
| Page | Web Analytics | Provides page-level context for engagement and performance tracking. |
🔗 Explore More Integrations
Whatsdash supports a wide range of marketing, analytics, and eCommerce integrations to give you a holistic view of your business performance.
👉 Visit the Integrations Page to explore all available connections
Facebook Insights
Facebook Insights is the native analytics tool for Facebook Business Pages, providing page administrators with a wealth of data on page performance, audience demographics, and content engagement.
Connecting Facebook Insights to Whatsdash lets you quickly and easily review your content reach, audience engagement, and follower growth on your Facebook Business Pages,centralized alongside your website traffic and sales data.
Why Connect Facebook Insights to Whatsdash?
Integrating your Facebook Insights data with Whatsdash transforms raw social media metrics into clear, actionable business intelligence, making it accessible for everyone on your team.
-
Content Performance Tracking : Monitor post-level Metrics like Post Engagement, Reach, and Video Views to quickly identify top-performing content and optimize posting schedules.
-
Audience Demographics & Segmentation : Visualize audience data (Age, Gender, Location) and blend it with conversion metrics from GA4 to understand the profile of users driven by social media.
-
Brand Awareness & Growth : Track high-level KPIs like Net Page Likes and Total Reach over time, providing a clear view of brand presence and growth across the platform.
-
Simplified, Blended Reporting : Create instant, visual reports using Facebook data blended with other sources without having to manually navigate and export data from the native Facebook tool.
📋 Steps to Integrate your Facebook Insights Account to Whatsdash
✔️ Navigate to the 'Integrations' page using the Navigation bar.
✔️ Select Facebook Insights from the Available Integrations.
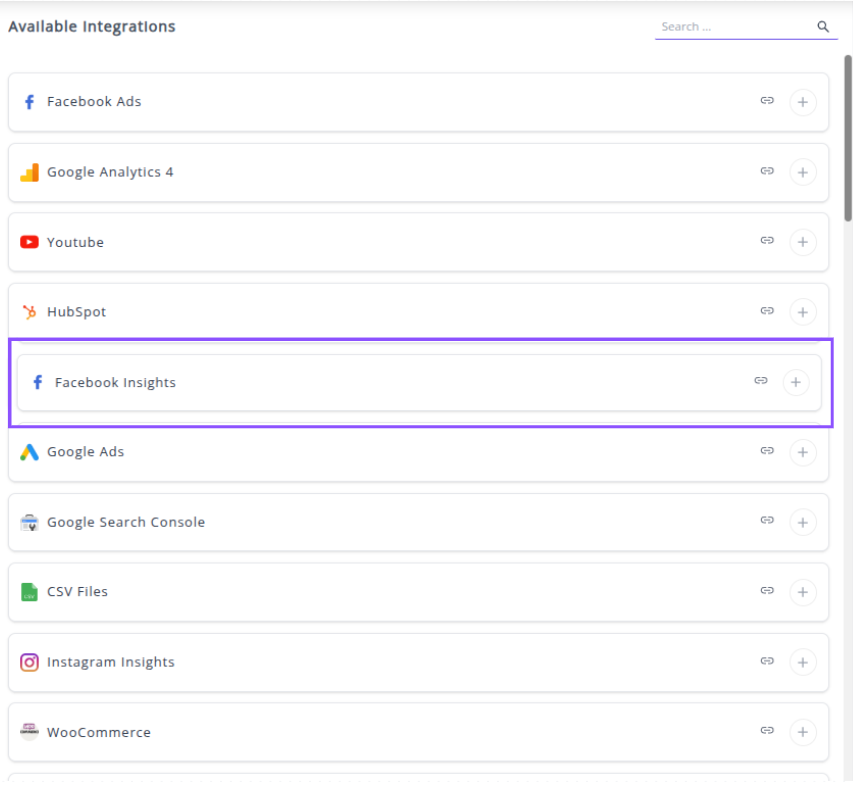
✔️ Click the + button to open the Facebook authorization window.

✔️ You will be redirected to a Facebook login and authorization page. Select the Facebook account that is an administrator or editor of the Facebook Business Page you want to track.
✔️ Grant Whatsdash the necessary permissions to Read your Facebook Page Insights data.
✔️ Once authenticated, you will be directed back to Whatsdash. Your Facebook Insights Integration will appear in the Connected Integrations list.

✔️ You can now create or customize dashboards using your Facebook Insights Metrics and Dimensions.
👉 How to visualize this data in your dashboard, visit the Dashboard Documentation Guide
🔗 Facebook Insights Metrics
This table lists all key Facebook Page, Post, and Video Analytics Metrics available through the Facebook Insights integration.
| Name | Category | Why It’s Useful |
|---|---|---|
| New Fans (New Page Likes) | Page | Helps you understand how many new followers your Page gained in a specific period, showing audience growth. |
| Page Unlikes | Page | Indicates audience dissatisfaction or disengagement with your Page content. |
| Page Organic Impressions | Page | Shows the total unpaid visibility of your Page content. Useful for tracking organic reach trends. |
| Page Viral Impressions | Page | Measures how much your Page is shared through friends’ interactions — a strong indicator of virality. |
| Page Organic 30sec. Views | Page Video | Tracks how often videos are viewed organically for over 30 seconds, reflecting engagement depth. |
| Page Video Views | Page Video | Measures total video views beyond 3 seconds — a key engagement metric for video content. |
| Page Views | Page | Tracks total visits to your Page, indicating interest in your brand or content. |
| Average Reach Per Post | Posts | Helps evaluate the average number of people reached per post, showing post effectiveness. |
| Post Engage User | Posts | Reveals how many users actively interacted with your post (likes, comments, shares). |
| Post Impressions | Posts | Measures total views of your posts — critical for understanding exposure levels. |
| Post Video Views | Post Video | Shows how often your videos were watched for at least 3 seconds — key for video engagement. |
| Post Paid Video Views | Post Video | Evaluates the impact of paid campaigns on video performance. |
| Page Engagement | Page | Reflects how interactive your audience is with your content — likes, clicks, comments, and shares. |
| Page Engagement Rate | Page | Shows engagement efficiency compared to reach — helps measure audience interest. |
| Fans (Page Likes) | Page | Indicates total people who like your Page — a baseline metric of your audience size. |
| Page Paid Reach | Page | Tracks the reach achieved through paid promotions — useful for ad performance measurement. |
| Page Reach | Page | Measures unique users who saw any content related to your Page — a key awareness metric. |
| Page Negative Feedback | Page | Helps identify content that drives users to take negative actions (e.g., hide post). |
| Mobile Check-ins | Checkins | Shows mobile-based location engagement, reflecting local audience activity. |
| Unique Check-ins | Checkins | Indicates how many unique people checked into your place — useful for in-store performance. |
| Page Total 30sec. Video Views | Page Video | Measures deeper video engagement (views over 30 seconds). |
| Page Auto-Played 30sec. Views | Page Video | Tracks autoplayed video completions — useful for measuring passive engagement. |
| Page Paid 30sec. Views | Page Video | Evaluates engagement from promoted video campaigns. |
| Page Auto-Played Video Views | Page Video | Helps track how autoplay affects short-term video engagement. |
| Page Organic Video Views | Page Video | Reflects how organic reach contributes to video views. |
| Page Unique Video Views | Page Video | Shows how many unique users watched your video — indicates audience spread. |
| Average Comments Per Post | Posts | Helps measure how discussion-oriented your content is. |
| Average Shares Per Post | Posts | Evaluates virality potential through user shares. |
| Post Organic Reach | Posts | Reveals how many people saw your post organically. |
| Post Viral Reach | Posts | Indicates how many users saw your post through others’ engagement. |
| Angry | Reactions | Tracks negative emotional responses to gauge audience sentiment. |
| Total Reactions | Reactions | Provides an overview of emotional engagement with your content. |
| Post Unique Video Views | Post Video | Measures unique video viewers — great for understanding reach. |
| Total Social Impact | Custom | Combines all engagement types (likes, shares, reactions) to reflect total influence. |
| Page Engaged Users | Page | Shows total people who interacted with your Page content — an overall engagement score. |
| Followers | Page | Indicates how many users are subscribed to see your content updates. |
| Page Paid Impressions | Page | Tracks ad-driven exposure for performance evaluation. |
| Page Viral Reach | Page | Measures how often content spreads through user actions — a key metric for virality. |
| Unique Mobile Check-ins | Checkins | Tracks unique users who checked in via mobile, reflecting mobile engagement. |
| Check-ins | Checkins | Measures overall in-person visits or brand interactions. |
| Page Positive Feedback | Page | Indicates user appreciation (likes, shares, etc.) for your content. |
| Total Actions on Page | Page | Tracks clicks on Page CTAs (call, visit, message) — useful for conversion analysis. |
| Page Unique Video 30sec. Views | Page Video | Measures unique viewers watching at least 30 seconds — strong engagement signal. |
| Page Clicked-to-Play Video Views | Page Video | Reflects intentional video engagement (manual play clicks). |
| Page Paid Video Views | Page Video | Tracks engagement generated through paid promotions. |
| Average Likes Per Post | Posts | Measures audience appreciation for your posts on average. |
| Posts Count | Posts | Tracks content consistency and posting frequency. |
| Post Organic Impressions | Posts | Helps you measure total organic post visibility. |
| Post Paid Reach | Posts | Tracks paid distribution of your posts — useful for ad ROI. |
| Post Reach | Posts | Measures how many users saw your post overall. |
| Post Viral Impressions | Posts | Reflects impressions generated by user interactions — shows shareability. |
| Posts Likes | Posts | Measures audience appreciation across posts. |
| Wow | Reactions | Captures surprised or amazed reactions — positive engagement metric. |
| Post Auto-Played Video Views | Post Video | Tracks passive video engagement (autoplay views). |
| Post Comment | Posts | Measures discussions and community engagement levels. |
| Consumptions Per 1000 Impressions | Custom | Measures engagement efficiency per impression — great for optimization. |
| Page Stories | Page | Tracks how many user-generated stories mention your Page — brand buzz metric. |
| Action Button Clicks | Page | Measures CTA interactions — key for conversion tracking. |
| Page Impressions | Page | Tracks total number of times Page content was displayed — overall visibility metric. |
| Page Organic Reach | Page | Reflects unpaid audience exposure — essential for organic growth analysis. |
| Page Clicked-to-Play 30sec. Views | Page Video | Tracks deeper engagement via user-initiated long video views. |
| Post Paid Impressions | Posts | Measures impressions from paid reach. |
| Haha | Reactions | Indicates humor or delight responses — positive sentiment measure. |
| Loves | Reactions | Tracks emotional connection with content — strong engagement indicator. |
| Sad | Reactions | Captures sympathy or negative sentiment — useful for tone analysis. |
| Post Clicked-to-Play Video Views | Post Video | Tracks engagement from manual video plays — more intentional viewer action. |
| Post Organic Video Views | Post Video | Measures unpaid video visibility — key for content reach analysis. |
| Post Shares | Posts | Indicates how often users amplify your content — great for virality and engagement tracking. |
🔗Facebook Insights Dimensions
The table below lists the Facebook Insights Dimensions available through the Whatsdash Facebook Insights Integration.
| Name | Category | Why It’s Useful |
|---|---|---|
| City | Helps identify which cities your followers and engaged users come from, useful for local targeting and city-specific campaigns. | |
| Likes Sources | Shows where your Page Likes originated (e.g., ads, posts, page suggestions) — helps optimize growth strategies. | |
| Age Gender | Breaks down your audience by age and gender, enabling better audience segmentation and ad targeting. | |
| Story Type | Identifies the types of stories or content (e.g., photo, link, video) performing best, guiding content planning. | |
| Language | Reveals the preferred languages of your audience, helping you tailor captions and messaging accordingly. | |
| Feedback Type | Shows the nature of audience feedback (positive or negative), helping monitor content sentiment. | |
| Post | Displays engagement and performance per individual post — essential for post-level analysis. | |
| Country | Highlights the countries where your audience is based, useful for regional strategy and international growth. |
🔗 Explore More Integrations
Whatsdash supports a wide range of marketing, analytics, and eCommerce integrations to give you a holistic view of your business performance.
👉 Visit the Integrations Page to explore all available connections
Google Ads
Google Ads is Google's online advertising platform that enables businesses to create and display targeted ads to potential customers through search results, websites, mobile apps, and video content. It is essential for driving targeted traffic, generating leads, and maximizing sales conversions.
Why Connect Google Ads to Whatsdash?
Integrating your Google Ads data with Whatsdash transforms campaign performance numbers into clear, actionable business insights for all users, regardless of their technical skill level.
-
Custom Bidding & Keyword Reports : Go beyond the standard Google Ads interface by creating custom visualizations that isolate performance by Keyword, Ad Group, and Campaign ID, helping you optimize bid strategies and budget allocation.
-
Automated ROAS & Cost Analysis : Use Custom Metrics to calculate True Profit Margin or Customer Lifetime Value (CLV) by blending Google Ads Cost data with sales and revenue data from platforms like GA4 or your CRM.
-
Lead Quality & Conversion Path : Blend lead/conversion volume (from Google Ads) with CRM stage data (from your CRM integration) to evaluate the quality of traffic generated by specific campaigns.
-
Simplified Reporting & Dashboards : Get instant, visual reports on high-level KPIs like Total Spend, Conversions, and Cost Per Acquisition (CPA) across all campaigns, enabling quick, strategic budget decisions.
📋 Steps to Integrate your Google Ads account to Whatsdash
✔️ Navigate to the 'Integrations' page using the Navigation bar.
✔️ Select Google Ads from Available Integrations.

✔️ Click the + button to open the Google authorization window.

✔️ You will be redirected to a Google sign-in page. Select the Google account that has administrative access to the Google Ads Account(s) you wish to connect.
✔️ Grant Whatsdash the necessary permissions to Read your Google Ads data.
✔️ Once authenticated, you will be directed back to Whatsdash. Your Google Ads Integration will appear in the Connected Integrations list.

✔️ You can now create or customize dashboards using your Google Ads Metrics and Dimensions.
👉 How to visualize this data in your dashboard, visit the Dashboard Documentation Guide
🔗 Google Ads Metrics
The table below lists the Google Ads Metrics available through the Whatsdash Google Ads Integration.
| Name | Category | Why it’s Useful |
|---|---|---|
| All Conversions | All Conversions | Measures the total number of conversions across all conversion actions, giving an overall view of campaign success. |
| Cost / All Conversions | All Conversions | Shows the average cost per conversion across all conversion actions, helping evaluate cost efficiency. |
| Phone-Through Rate (PTR) | Call Details | Tracks the effectiveness of phone number impressions in generating calls. |
| Search Impression Share | Competitive metrics | Shows the proportion of possible impressions received, indicating competitive ad visibility. |
| Conversion Rate | Conversions | Indicates how effectively ad interactions lead to conversions. |
| Effective Revenue Share (ERS) for Conv. | Conversions | Measures the efficiency of ad spend relative to conversion value. |
| Cost Per Click (CPC) | Performance | Shows the cost efficiency per click, critical for budget management. |
| Impressions (Top) % | Performance | Indicates how often ads appear above organic search results, affecting visibility. |
| Average Cost Per View (CPV) | Video | Measures cost efficiency for video ad views. |
| Video played to 25% | Video | Tracks partial engagement with video content, useful for content optimization. |
| Video played to 50% | Video | Tracks deeper engagement with video ads. |
| Phone calls | Call Details | Shows the total number of offline calls generated by ads. |
| Search Lost IS (budget) | Competitive metrics | Highlights lost opportunities due to insufficient budget, helping optimize allocation. |
| Cost / Conversions | Conversions | Calculates the average cost per conversion, essential for ROI analysis. |
| Cross Device Conversions | Conversions | Tracks conversions across devices, showing multi-device effectiveness. |
| Gmail Clicks To Website | Gmail Metrics | Measures clicks on Gmail ads leading to landing pages, indicating ad effectiveness. |
| Avg. Cost per Interaction | Performance | Shows cost efficiency per user interaction, helping optimize ad spend. |
| Click-Through Rate (CTR) | Performance | Measures engagement by showing the ratio of clicks to impressions. |
| Engagement Rate | Performance | Tracks user interaction with ads, including expansions or other engagements. |
| Engagements | Performance | Counts total engagements, reflecting ad appeal. |
| All Conversions Rate | All Conversions | Measures conversion efficiency across all interactions, including multiple conversions per user. |
| All Conversions Value | All Conversions | Shows the total monetary value of all conversions. |
| Avg. Conversion Value (All Conv.) | All Conversions | Tracks average revenue per conversion, aiding in ROI assessment. |
| Phone impressions | Call Details | Counts how often phone numbers were shown, helping measure exposure. |
| Display Impression Share | Competitive metrics | Shows ad visibility on Display Network, useful for display campaigns. |
| Display Lost IS (budget) | Competitive metrics | Highlights missed display impressions due to budget limitations. |
| Conversion Value | Conversions | Shows total value of conversions, key for revenue tracking. |
| Conversions | Conversions | Counts total conversions, allowing performance comparison across campaigns. |
| Clicks | Performance | Measures user interaction through clicks, core to performance evaluation. |
| Cost Per Thousand Impressions (CPM) | Performance | Shows cost efficiency for every 1,000 ad impressions. |
| Impressions (Absolute Top) % | Performance | Indicates how often the ad is the very first above organic results, critical for visibility. |
| Interactions | Performance | Tracks meaningful interactions (clicks or views) per ad format. |
| Views | Video | Shows total video ad views, reflecting content reach. |
| All Conversion Value / Click | All Conversions | Measures average conversion value per click, useful for ROI insights. |
| Effective Revenue Share (ERS) for All Conv. | All Conversions | Compares ad cost against total conversion value, indicating efficiency. |
| Search Lost IS (rank) | Competitive metrics | Shows lost search impressions due to low ad rank, guiding optimization. |
| Avg. Conversion Value (Conv.) | Conversions | Measures average value of chosen conversions, informing profitability. |
| Conversion Value / Click | Conversions | Tracks revenue per click, key for campaign ROI. |
| Impressions | Performance | Counts total ad impressions, showing overall reach. |
| Interaction Rate | Performance | Ratio of interactions to impressions, showing ad engagement. |
| Viewable Impressions | Performance | Indicates when ads were visible to users, important for viewability standards. |
| Video played to 75% | Video | Measures deeper engagement with video content. |
| Video played to 100% | Video | Shows full video views, indicating maximum engagement. |
| View rate | Video | Measures the proportion of impressions that resulted in video views. |
🔗 Google Ads Dimensions
The table below lists the Google Ads Dimensions available through the Whatsdash Google Ads Integration.
| Name | Category | Why it’s Useful |
|---|---|---|
| Description | Attributes | Shows the text of an ad, helping evaluate messaging effectiveness. |
| Ad Group Status | Attributes | Tracks whether an ad group is active, paused, or removed, helping manage campaigns. |
| Customer Name | Overview | Identifies the account name, useful for reporting across multiple accounts. |
| Display Keyword | Targeting | Shows the targeted keyword for display ads, helping optimize targeting. |
| Age Range | Demographics | Allows segmentation of performance by user age, aiding audience targeting. |
| Ad Group | Overview | Identifies the ad group, helping organize performance analysis. |
| Campaign | Overview | Shows the campaign name, key for campaign-level reporting. |
| Video Title | Overview | Displays the title of video ads, useful for analyzing video performance. |
| Bidding Strategy Type | Targeting | Indicates the type of bidding strategy, helping assess cost-effectiveness. |
| Placement URL | Targeting | Shows the URL where ads were displayed, useful for placement optimization. |
| Keyword | Overview | Displays the keyword targeted in search campaigns, critical for search performance insights. |
| Ad Network | Targeting | Identifies the network used (Search, Display, etc.), aiding channel performance analysis. |
| Device | Targeting | Shows the device type (mobile, desktop, tablet), helping optimize device-specific strategies. |
| Campaign Status | Attributes | Tracks whether a campaign is active, paused, or removed, important for managing campaigns. |
| Click Type | Attributes | Shows which part of the ad was clicked, helping optimize ad components. |
| Headline | Attributes | Displays the ad headline, useful for testing and refining messaging. |
| Gender | Demographics | Allows performance segmentation by gender, aiding audience targeting. |
| Display Ad with image | Overview | Shows the ad and its image, helpful for visual ad performance analysis. |
| Keyword Without Match Type | Overview | Aggregates all keyword variants, simplifying keyword-level reporting. |
🔗 Explore More Integrations
Whatsdash supports a wide range of marketing, analytics, and eCommerce integrations to give you a holistic view of your business performance.
👉 Visit the Integrations Page to explore all available connections
Google Search Console
Google Search Console (GSC) is a free service from Google that helps you monitor, maintain, and troubleshoot your site's presence in Google Search results. It gives you direct access to information on how Google crawls, indexes, and ranks your website, making it an indispensable tool for Search Engine Optimization (SEO).
Connecting Google Search Console (GSC) to Whatsdash allows the admin to pull detailed organic search performance data—including clicks, impressions, and keyword rankings—directly into Whatsdash for advanced reporting and analysis alongside other business metrics.
Why Connect Google Search Console to Whatsdash?
Integrating your GSC data with Whatsdash transforms raw search performance and site health information into clear, actionable SEO insights for all users, regardless of their technical skill level.
-
Custom Keyword Analysis & Segmentation : Go beyond the GSC interface by creating custom dashboards with engagement metrics (from GA4) to pinpoint high-potential keywords and optimize underperforming content.
-
Proactive Site Health Monitoring : Use Custom Metrics to track and alert on critical issues , ensuring your site's technical foundation is always optimized for Google.
-
Data Blending & Cross-Channel ROI : Blend organic search performance metrics (Clicks and Impressions) with paid media and conversion data to accurately measure the holistic effectiveness and true ROI of your SEO efforts.
-
Simplified Reporting & Dashboards : Get instant, visual reports on Average Position and organic traffic trends, allowing for quick, data-driven decisions without navigating complex search tool menus.
📋 Steps to Integrate your Google Search Console account to Whatsdash
✔️ Navigate to the 'Integrations' page using the Navigation bar.
✔️ Select Google Search Console from the Available Integrations.
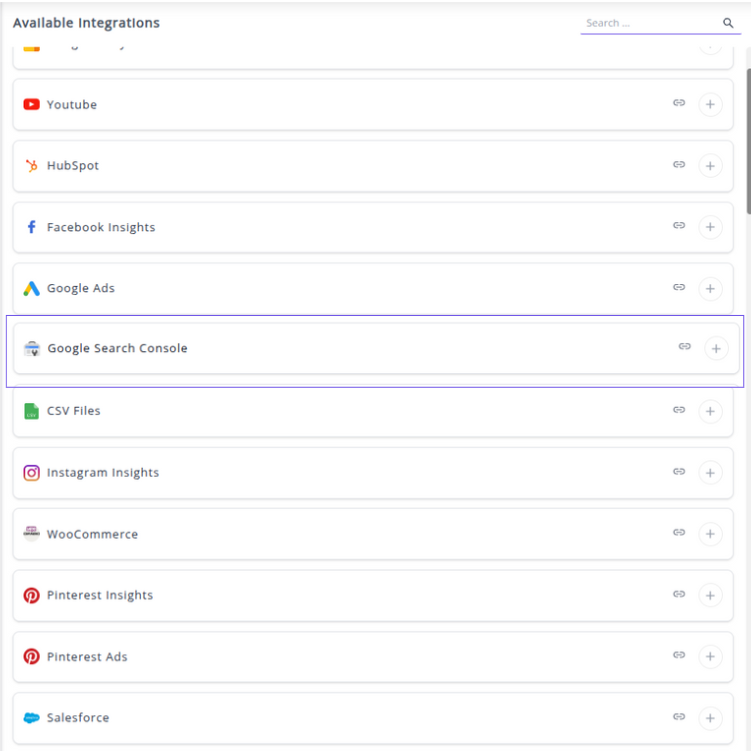
✔️ Click the + button to open the Google authorization window.
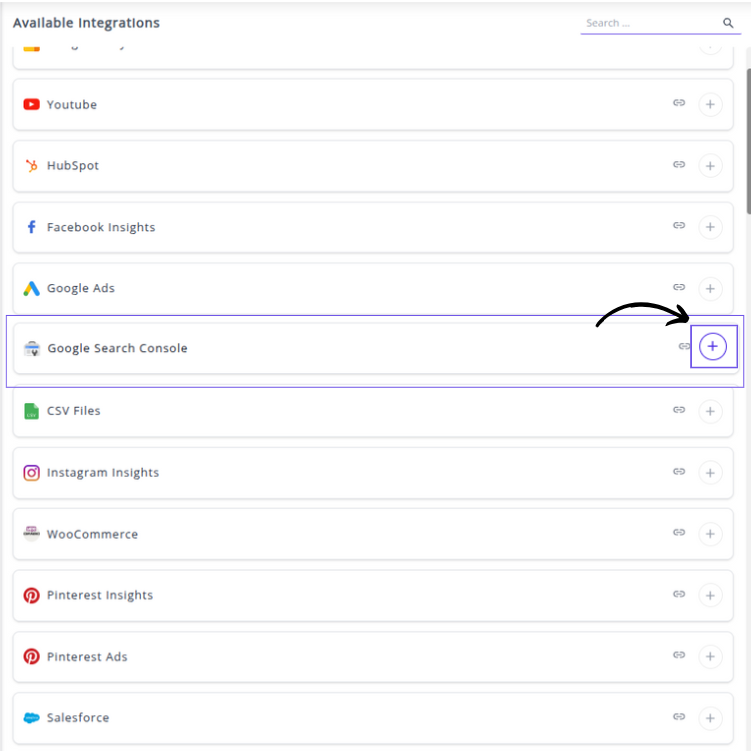
✔️ You will be redirected to a Google sign-in page. Select the Google account that has ownership access to your GSC property.
✔️ Grant Whatsdash the necessary permissions to Read your Google Search Console data.
✔️ Once authenticated, you will be directed back to Whatsdash. Your Google Search Console Integration will appear in the Connected Integrations list.
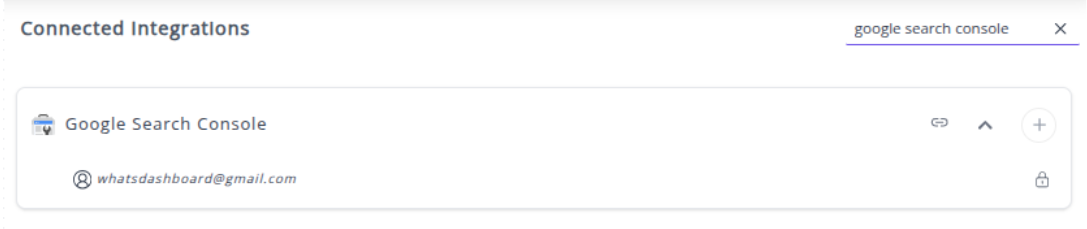
✔️ You can now create or customize dashboards using your Google Search Console Metrics and Dimensions.
👉 How to visualize this data in your dashboard, visit the Dashboard Documentation Guide
🔗 Google Search Console Metrics
The table below lists the Google Search Console Metrics available through the Whatsdash Google Search Console Integration.
| Name | Why it’s Useful |
|---|---|
| Avg. CTR | Helps measure how effective your page titles and descriptions are at driving clicks from search results. |
| Avg. position | Indicates how well your site ranks compared to competitors, helping identify opportunities to improve SEO. |
| Clicks | Shows how often users are visiting your site from Google Search, revealing engagement and search success. |
| Impressions | Tracks how often your site appears in search results, helping evaluate your content’s visibility. |
🔗 Google Search Console Dimensions
The table below lists the Google Search Console Dimensions available through the Whatsdash Google Search Console Integration.
| Name | Why it’s Useful |
|---|---|
| Country | Helps identify which countries drive the most traffic, allowing for regional targeting and localization. |
| Device Type | Shows whether users access your site via desktop, mobile, or tablet, helping optimize user experience across devices. |
| Page | Identifies which pages are receiving impressions, helping track content performance and optimize high-value pages. |
| Query | Reveals the search terms that triggered impressions, helping refine SEO strategy and content targeting. |
🔗 Explore More Integrations
Whatsdash supports a wide range of marketing, analytics, and eCommerce integrations to give you a holistic view of your business performance.
👉 Visit the Integrations Page to explore all available connections
CSV Files
The CSV Files integration allows you to securely upload and consolidate custom or external business data directly into Whatsdash for reporting and analysis alongside automated metrics.
Why Connect CSV Files to Whatsdash?
Integrating CSV data is crucial for filling data gaps, providing context to automated reports, and ensuring all relevant business metrics are centralized for decision-making.
- Offline Data Inclusion : Upload monthly budget allocations or cost data not tracked in an ad platform to calculate ROAS against actual spend.
- Manual Data Centralization : Import data from proprietary or legacy systems to gain a holistic view of operational performance.
- Cross-Platform Merging : Use a common Date or Customer ID column in the CSV to blend custom data (like lead scoring adjustments) with automated data from integrations like HubSpot or GA4.
📋 Steps to Integrate your CSV Files to Whatsdash
✔️ Navigate to the 'Integrations' page using the navigation bar at the top.
✔️ Select CSV Files from the list of Available Integrations.

✔️ Click the + button to initiate the upload process.

✔️ After clicking + icon, a list of all your explicitly created CSV Templates will appear. Select the template corresponding to the data you wish to upload and analyze in your dashboard.
webp

💡 Need to create a new CSV template? For instructions on structuring and mapping a new template, please visit the CSV Template Creation Guide.
✔️ Once processed, your CSV data integration will appear in the Connected Integrations list.
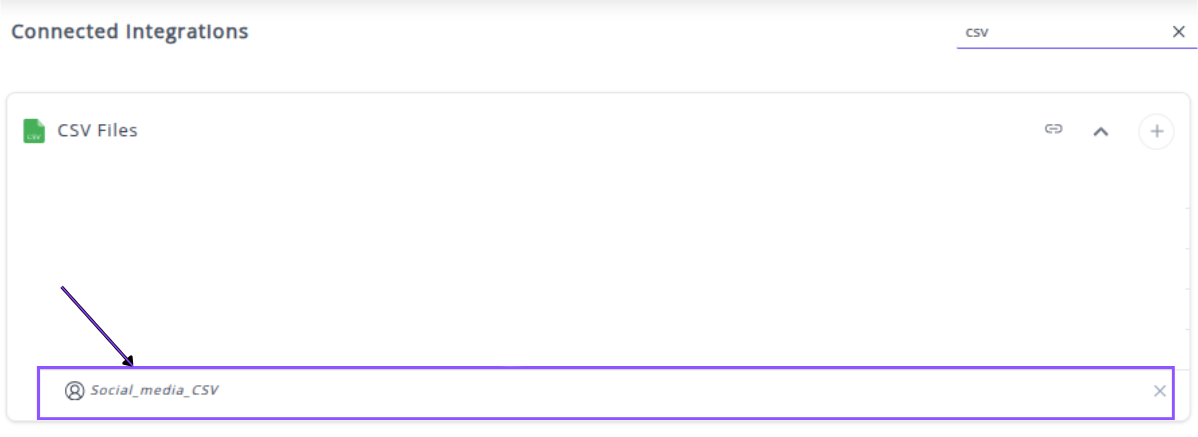
✔️ You can now create or customize dashboards using your custom CSV Metrics and Dimensions.
👉 How to visualize this data in your dashboard, visit the Dashboard Documentation Guide
💡 Tip : For maximum analytical power, ensure your CSV includes a Date column and a common identifier (like Customer ID or Transaction ID). This allows you to blend your offline or budget data with highly granular metrics from your automated integrations (e.g., GA4 or HubSpot).
🔗 Explore More Integrations Whatsdash supports a wide range of marketing, analytics, and eCommerce integrations to give you a holistic view of your business performance.
👉 Visit the Integrations Page to explore all available connections
Instagram Insights
Instagram Insights allows you to integrate your detailed organic profile performance, post metrics, and audience data directly into Whatsdash for centralized social media reporting and analysis alongside other business metrics.
Why Connect Instagram Insights to Whatsdash?
Integrating your Instagram Insights data with Whatsdash transforms raw engagement and audience numbers into clear, actionable business insights, enabling a comprehensive view of your brand's visual content performance.
-
Content Performance Tracking : Monitor the organic Reach, Impressions, and Engagement for all your Posts and Stories in one unified dashboard, quickly identifying high-performing content types and formats.
-
Audience Demographics & Growth : Track key Metrics like Follower Engagement Rate and segment your audience by Age and Gender to ensure your content effectively reaches your target demographic.
-
Create Custom Metrics & Views : Use the raw data pulled from Instagram to create specific metrics, ratios, and custom dashboards tailored exactly to your unique reporting requirements.
-
Cross-Platform Social View : Compare Instagram's organic engagement rate directly against Facebook and other social channels to understand which platform is most effectively building community and driving interest.
📋 Steps to Integrate your Instagram Insights account to Whatsdash
✔️ Navigate to the 'Integrations' page using the Navigation bar.
✔️ Select Instagram Insights from the Available Integrations.

✔️ Click the + button to open the Meta authorization window.

✔️ You will be redirected to a Facebook login page. Select the account that has the necessary permissions to manage the Facebook Page linked to your desired Instagram Business or Creator Account.
✔️ Grant Whatsdash the necessary permissions to Read your Instagram Insights data. Ensure you select the correct Instagram Business Account(s) to track.
✔️ Once authenticated, you will be directed back to Whatsdash. Your Instagram Insights Integration will appear in the Connected Integrations .

✔️ You can now create or customize dashboards using your Instagram Insights Metrics and Dimensions.
👉 How to visualize this data in your dashboard, visit the Dashboard Documentation Guide.
🔗 Instagram Insights Metrics
Below is a comprehensive list of Instagram Insights metrics, categorized by purpose.
| Name | Category | Why It’s Useful |
|---|---|---|
| Post Count | Account | Measures your posting frequency to assess content consistency. |
| Followers | Account | Tracks audience growth and brand reach over time. |
| Comments | Engagement | Indicates audience interaction and sentiment on posts. |
| Page Engagement Rate | Engagement | Shows how actively users interact with all types of your content. |
| Follower Engagement Rate | Engagement | Measures how engaged your followers are compared to total followers. |
| Likes | Engagement | Tracks positive audience reactions to your content. |
| Post Engagement Rate | Engagement | Evaluates engagement levels on standard posts (excluding Reels). |
| Website Clicks | Engagement | Measures how effectively your profile drives traffic to your website. |
| Impressions | Performance | Indicates how many times your content was displayed to users. |
| Post Impressions | Performance | Tracks impressions specifically for posts, excluding Reels. |
| Reach | Performance | Measures the total unique users who viewed your content. |
| Video Views | Performance | Evaluates the total number of times your videos were viewed. |
| Engagement | Engagement | Summarizes total interactions (likes, comments, saves, shares). |
| Saves | Engagement | Reflects how valuable users find your content for later reference. |
| Engagement Rate | Engagement | Provides an overall metric for how interactive your audience is. |
| Shares | Engagement | Tracks how often your content is shared, boosting organic visibility. |
| Page Impressions | Performance | Shows the total visibility of your Instagram page and content. |
| Reel Views | Performance | Measures the performance and reach of your short-form videos. |
| Total Views | Performance | Combines all video and reel views to assess total watch activity. |
| Profile Views | Performance | Indicates how many users visited your profile, showing interest in your brand. |
🔗 Instagram Insights Dimensions
Below is a comprehensive list of Instagram Insights metrics, categorized by purpose.
| Name | Why it’s Useful |
|---|---|
| Gender | Helps understand the gender distribution of your followers, enabling better audience targeting. |
| City | Reveals which cities your followers come from, aiding in location-specific content planning. |
| Country | Shows the countries where your audience is located, supporting global marketing decisions. |
| Hashtag | Identifies which hashtags are being used, allowing optimization of hashtag strategy for better reach. |
| Post with image | Useful for visual content analysis, helping you identify which images attract more engagement. |
| Age | Provides insights into the age demographics of your followers, informing tone and style of content. |
| Post Name | Helps track and analyze specific posts based on their captions for performance insights. |
| Post Type | Useful for determining which types of posts (photo, video, reel, etc.) perform best. |
| Post Link | Enables tracking of individual post URLs to analyze traffic or engagement per post. |
💡 Tip : To measure the true loyalty and virality of your content, analyze Total Engagements segmented by the Follower Status dimension. High engagement from Non-Followers suggests your content is highly shareable and effective at generating organic discovery.
🔗 Explore More Integrations Whatsdash supports a wide range of marketing, analytics, and eCommerce integrations to give you a holistic view of your business performance.
👉 Visit the Integrations Page to explore all available connections
WooCommerce
WooCommerce is a leading open-source e-commerce platform built on WordPress, enabling businesses to set up and run online stores with ease.
🚀 Why Connect WooCommerce to Whatsdash?
Integrating your WooCommerce store with Whatsdash allows you to centralize key e-commerce performance indicators with your marketing and advertising data for holistic business analysis.
-
🧾 Unified Sales Reporting : Monitor vital e-commerce metrics like revenue, orders, and customer data alongside your marketing campaign performance — all in a single dashboard.
-
⏱️ Real-time Performance Tracking : Get up-to-date information on your product sales and inventory status without needing to log into your WordPress admin panel.
-
📊 Contextual Business Intelligence : Correlate ad spend from platforms like Google Ads and Snapchat with your actual sales and product data from WooCommerce to calculate true Return on Ad Spend (ROAS).
📋 Steps to Integrate Your WooCommerce Store with Whatsdash
Follow these simple steps to connect your WooCommerce store:
-
Navigate to Integrations Page
Go to the 'Integrations' page using the Navigation bar. -
Select WooCommerce
From the list of available integrations, select WooCommerce.
-
Initiate Connection
Click the ➕ button to start the connection process.
A pop-up window titled "Please enter following params" will appear.

-
Enter Required Field
- Store URL: Enter the full URL of your WordPress website where your WooCommerce store is hosted.
Example:https://www.yourstore.com
- Store URL: Enter the full URL of your WordPress website where your WooCommerce store is hosted.
-
Authenticate the Connection
Click Next to proceed. You’ll be prompted to log in to your WooCommerce account and approve Whatsdash to securely access your data (Orders, Products, Customers, etc.). -
Complete Integration
Once authenticated, you’ll be redirected back to Whatsdash.
Your WooCommerce Integration will now appear in the Connected Integrations list.
-
Start Building Dashboards
You can now create or customize dashboards using your WooCommerce metrics and Dimensions.
🔗 WooCommerce Metrics
The table below lists the WooCommerce Metrics available through the Whatsdash WooCommerce Integration.
| Name | Why it’s useful |
|---|---|
| Country | Helps identify where your traffic or users are coming from, useful for regional targeting and localization strategies. |
| Device Type | Reveals which devices your audience uses most, allowing you to optimize content and ads for mobile, desktop, or tablet. |
| Page | Shows which pages attract the most visits, helping prioritize content and improve user engagement. |
| Query | Provides insights into what users are searching for, enabling better keyword optimization and content strategy. |
🔗 WooCommerce Dimensions
The table below lists the WooCommerce Dimensions available through the Whatsdash WooCommerce Integration.
| Name | Category | Why it’s useful |
|---|---|---|
| Customer ID | Order | Helps identify and track each customer uniquely for analyzing purchase patterns and customer lifetime value. |
| Coupon | Order | Useful for measuring the impact of discounts and promotions on sales performance. |
| Order ID | Subscription | Enables precise tracking of recurring or subscription-based purchases for revenue forecasting. |
| Date | Subscription | Helps analyze subscription activity and renewal trends over time. |
| Product Name | Order | Identifies which products are selling the most, supporting inventory and marketing decisions. |
| Order ID | Order | Essential for uniquely identifying and managing individual customer transactions. |
| Date | Order | Useful for tracking order trends, seasonality, and overall sales performance. |
| Order Status | Order | Provides visibility into order processing stages, helping manage fulfillment and customer experience. |
| Order Status | Subscription | Helps monitor the status of subscription orders, ensuring timely renewals and customer retention. |
🔗 Explore More Integrations
Whatsdash supports a wide range of marketing, analytics, and eCommerce integrations to give you a holistic view of your business performance.
👉 Visit the Integrations Page to explore all available connections
Pinterest Insights
Pinterest Insights is the official reporting and analytics suite for Pinterest Business Accounts. It provides detailed metrics and dimensions about the performance of your organic content (Pins and Boards) and paid campaigns (Promoted Pins), as well as a deep understanding of your audience.
Why Connect Pinterest Insights to Whatsdash?
Integrating your Pinterest data with Whatsdash transforms raw performance and audience data into clear, actionable business intelligence alongside your other marketing and sales channels.
-
Conversion & Traffic Attribution : Track Outbound Clicks and Conversions from specific Pins, allowing you to attribute sales and traffic directly back to your Pinterest content and campaigns.
-
Content Performance & Engagement : Monitor Impressions, Saves, and Pin Clicks to quickly identify high-performing content types and topics that are inspiring your audience and driving viral reach.
-
Audience Insights & Optimization : Segment performance by Age, Gender, and Interest to refine your targeting and ensure your content effectively reaches your target demographic.
-
Cross-Platform Social View : Compare Pinterest's unique engagement metrics (like Saves) against other social channels to understand which platform is most effectively building product interest and purchase intent.
📋 Steps to Integrate your Pinterest Insights account to Whatsdash
✔️ Navigate to the 'Integrations' page using the navigation bar at the top.
✔️ Select Pinterest Insights from the list of Available Integrations.

✔️ Click the + button to open the Pinterest authorization window.

✔️ You will be redirected to the Pinterest sign-in page. Log in with the account that has access to your Pinterest Business Profile.
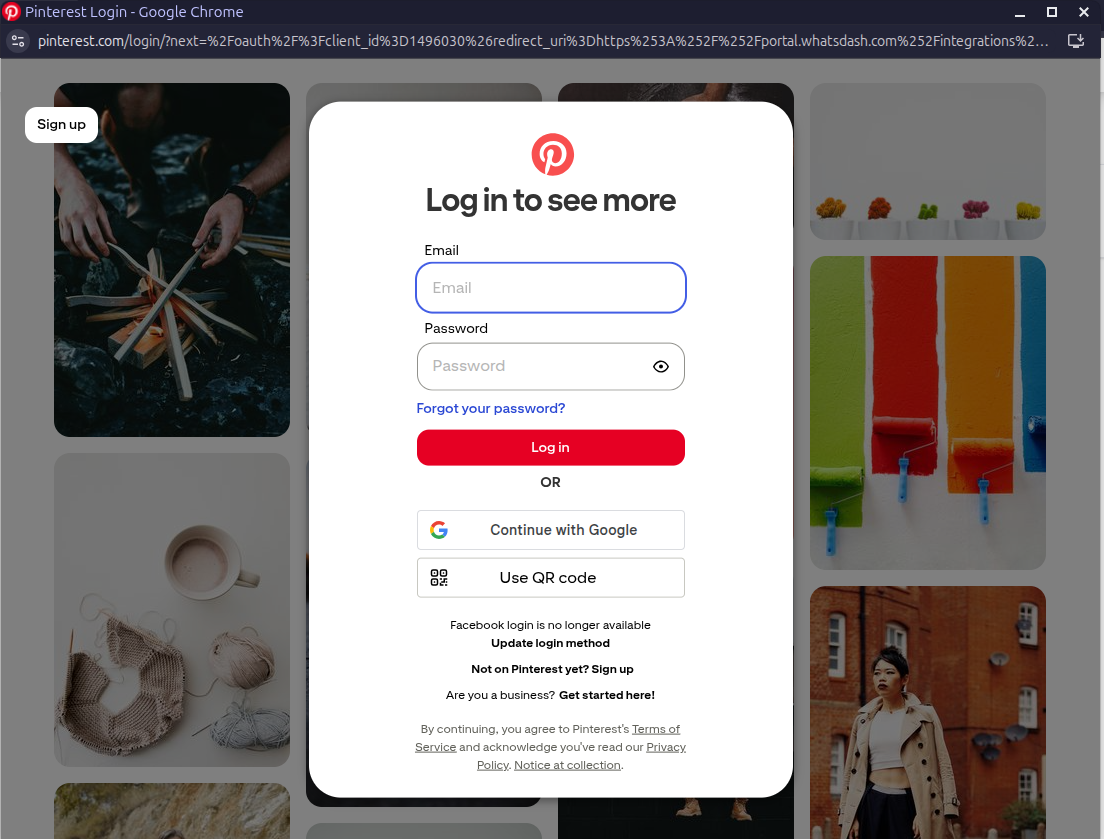
✔️ Grant Whatsdash the necessary permissions to Read your Pinterest Analytics and Ads data.
✔️ Once authenticated, you will be directed back to Whatsdash. Your Pinterest Insights Integration will appear in the Connected Integrations list.

✔️ You can now create or customize dashboards using your Pinterest Insights Metrics and Dimensions.
👉 How to visualize this data in your dashboard, visit the Dashboard Documentation Guide.
🔗 Pinterest Insights Metrics
The table below lists the Pinterest Insights Metrics available through the Whatsdash Pinterest Insights Integration.
| Name | Category | Why it’s Useful |
|---|---|---|
| Impressions | User Analytics | Shows how many times your Pins were displayed, helping measure content visibility. |
| Engagement | User Analytics | Tracks total user interactions, indicating overall interest in your content. |
| Engagement Rate | User Analytics | Helps evaluate how engaging your Pins are by comparing interactions to impressions. |
| Outbound Clicks | User Analytics | Reveals how many times users clicked to visit external sites, measuring referral traffic. |
| Outbound Clicks Rate | User Analytics | Indicates the effectiveness of Pins in driving users to your website. |
| Pin Clicks | User Analytics | Measures how often users clicked on a Pin to view it in detail, showing engagement depth. |
| Pin Click Rate | User Analytics | Helps assess click efficiency by showing the percentage of users who clicked after viewing. |
| Save | User Analytics | Tracks how many users saved your Pin, reflecting content value and inspiration potential. |
| Save Rate | User Analytics | Shows the percentage of users who saved Pins, useful for understanding content appeal. |
| Video Average Watch Time | User Analytics | Measures how long users watch videos, helping gauge content quality and retention. |
| Video 50% Watch | User Analytics | Indicates how many viewers watched at least half of your video, showing engagement strength. |
| 95th Percentile View Count | User Analytics | Helps identify high-performing videos by showing the top 5% of view counts. |
| Video Start | User Analytics | Measures the percentage of users who start watching your videos, indicating initial interest. |
| Video 10s Views | User Analytics | Tracks how often users watched videos for at least 10 seconds, revealing meaningful engagement. |
| Video Media Response Rate | User Analytics | Evaluates how effectively video content generates responses or actions. |
| Video 50% Watch | Pin Analytics | Shows engagement with videos at the Pin level by measuring 50% watch completion. |
| 95th Percentile View Count | Pin Analytics | Highlights top-performing Pins based on video view distribution. |
| Save | Pin Analytics | Tracks how many users saved a specific Pin, indicating individual content performance. |
| Video Start | Pin Analytics | Measures how many users start a video from a specific Pin, showing appeal. |
| Video Media Response Rate | Pin Analytics | Assesses user response and interaction rate for video Pins. |
| Pin Clicks | Pin Analytics | Tracks how often users clicked a specific Pin for more details, measuring engagement. |
| Outbound Clicks | Pin Analytics | Shows how many users clicked a link within a Pin to leave Pinterest. |
| Impressions | Pin Analytics | Indicates how many times a Pin appeared in users’ feeds or searches. |
| Video 10s Views | Pin Analytics | Reveals the number of users who watched a specific Pin’s video for 10 seconds or more. |
| Save Rate | Pin Analytics | Shows the ratio of saves to impressions for Pins, indicating visual content effectiveness. |
| Video Average Watch Time | Pin Analytics | Measures average time users spend watching a video Pin, useful for optimizing length and content quality. |
🔗 Pinterest Insights Dimensions
The table below lists the Pinterest Insights Metrics available through the Whatsdash Pinterest Insights Integration.
| Name | Category | Why it’s Useful |
|---|---|---|
| Date | User Analytics | Helps analyze performance trends over specific time periods. |
| Date | Pin Analytics | Allows tracking of individual Pin activity over time for better trend analysis. |
| Link | Pin Analytics | Identifies the destination URL for a Pin, useful for tracking referral sources and traffic. |
| Title | Pin Analytics | Helps recognize Pins by their titles, aiding in performance comparison across content types. |
| Type | Pin Analytics | Categorizes Pins by media type (image, video, etc.), useful for comparing engagement across formats. |
🔗 Explore More Integrations
Whatsdash supports a wide range of marketing, analytics, and eCommerce integrations to give you a holistic view of your business performance.
👉 Visit the Integrations Page to explore all available connections
Pinterest Ads
Pinterest Ads is the platform's advertising solution for promoting Pins (content) to reach a wider, highly-engaged audience with commercial intent.
Connecting Pinterest Ads to Whatsdash lets you quickly and easily review your campaign spend, performance metrics, and return on ad spend (ROAS) for all your paid Pinterest initiatives alongside your organic and other paid marketing data.
Why Connect Pinterest Ads to Whatsdash?
Integrating your Pinterest Ads data with Whatsdash gives you the dedicated financial and performance reporting which is needed to optimize your paid spend and measure its overall impact on your business.
-
Budget Monitoring & ROI : Consolidate Spend, CPA, and ROAS across all Pinterest campaigns and compare them with other ad platforms in a single financial dashboard to manage budgets efficiently.
-
Granular Ad Performance : Break down etrics like CTR and Conversions by Campaign, Ad Group, and Pin to quickly identify which creative ad targets is driving the best results.
-
Conversion Path Visibility : Track both Click-through and Engagement Conversions to understand the full user journey from initial Pin interaction to final purchase.
-
Automated Reporting : Move beyond manual reporting by accessing instant, visual dashboards that turn raw ad data into clear performance trends for all stakeholders.
📋 Steps to Integrate your Pinterest Ads account to Whatsdash
✔️ Navigate to the 'Integrations' page using the Navigation bar .
✔️ Select Pinterest Ads from the Available Integrations.

✔️ Click the + button to open the Pinterest authorization window.
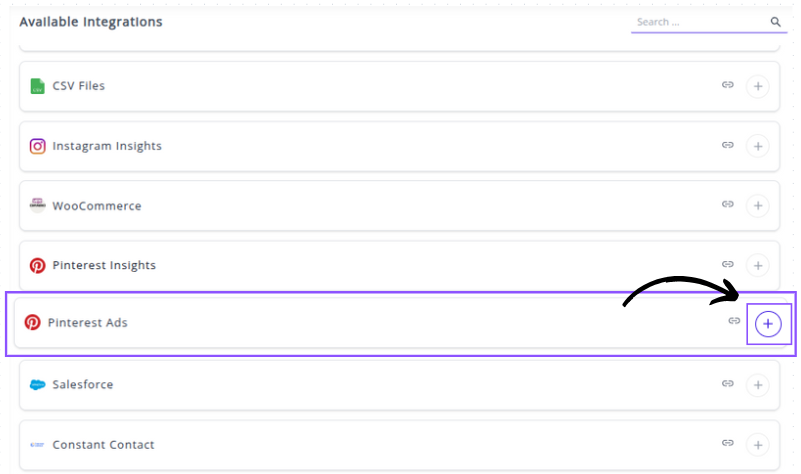
✔️ You will be redirected to the Pinterest sign-in page. Log in with the account that has administrative access to your Pinterest Ad Accounts.
✔️ Once authenticated, you will be directed back to Whatsdash. Your Pinterest Ads Integration will appear in the Connected Integrations ,witht the connected Pinterest accounts.

✔️ You can now create or customize dashboards using your Pinterest Ads Metrics and Dimensions.
👉 How to visualize this data in your dashboard, visit the Dashboard Documentation Guide
🔗 Pinterest Ads Metrics
The table below lists Pinterest Ads Metrics available in Whatsdash.
| Name | Category | Why It's Useful |
|---|---|---|
| Spend in Micro Dollar | Ad Analytics | Tracks exact ad spend for ROI and budget planning. |
| Paid Impressions | Ad Analytics | Measures paid reach to evaluate campaign visibility. |
| CPC in Micro Dollar | Ad Analytics | Monitors cost per click to optimize bids and cost-efficiency. |
| ECPC in Micro Dollar | Ad Analytics | Shows effective CPC after automated bid adjustments. |
| ECPC in Dollar | Ad Analytics | Readable effective CPC for budget and reporting. |
| Click-Through Rate (CTR) | Ad Analytics | Indicates how compelling ads are at driving clicks. |
| Effective Click-Through Rate | Ad Analytics | Measures real-world CTR across impressions for performance comparison. |
| Total Engagement | Ad Analytics | Tracks total interactions to understand audience interest. |
| Effective Cost Per Engagement in Dollar | Ad Analytics | Evaluates cost efficiency of driving engagements. |
| Engagement Rate | Ad Analytics | Shows percentage of users interacting with ads; good for creative testing. |
| ECPM in Micro Dollar | Ad Analytics | Measures revenue or cost per thousand impressions for monetization comparisons. |
| Repins Rate | Ad Analytics | Indicates how often paid content is reshared — a sign of organic appeal. |
| Cost per Mille (CPM) in Micro Dollar | Ad Analytics | Tracks cost per 1,000 impressions for awareness budgeting. |
| Cost per Mille (CPM) in Dollar | Ad Analytics | Readable CPM for reporting and comparisons. |
| Gross Impressions | Ad Analytics | Measures first-placement impressions for reach analysis. |
| Gross Click-Through Rate (CTR) | Ad Analytics | Evaluates initial link performance at gross level. |
| Total Click-throughs | Ad Analytics | Absolute clicks from ads for conversion funnel analysis. |
| Total Impressions | Ad Analytics | Overall ad exposure — baseline reach metric. |
| Frequency | Ad Analytics | Shows average times users saw ads, useful to detect ad fatigue. |
| Cost per Outbound Click in Dollar | Ad Analytics | Tracks cost to drive external traffic (conversions potential). |
| Total Engagement Signups | Ad Analytics | Measures engagements that led to signups — conversion indicator. |
| Total Engagement to Checkout | Ad Analytics | Tracks engagements that progressed to checkout. |
| Total Engagement Leads | Ad Analytics | Shows engagements that resulted in lead events. |
| Total Clicks on Signup | Ad Analytics | Counts clicks on signup CTAs to measure intent. |
| Total Clicks on Checkout | Ad Analytics | Counts clicks to checkout flows for funnel analysis. |
| Total Clicks on Add to Cart | Ad Analytics | Tracks intent signals toward purchase. |
| Total Clicks on Lead Generation | Ad Analytics | Measures clicks on lead-gen actions for pipeline health. |
| Total Views on Signup | Ad Analytics | Views of signup pages to evaluate top-of-funnel interest. |
| Total Views on Checkout | Ad Analytics | Views of checkout pages to monitor purchase intent. |
| Total Views on Add to Cart | Ad Analytics | Views indicating product interest before add-to-cart. |
| Total Views on Lead Generation | Ad Analytics | Views of lead pages — useful for conversion optimization. |
| Total Conversions | Ad Analytics | Core conversions count — measures campaign success. |
| Total Engagement Value for Sign-up in Micro Dollar | Ad Analytics | Monetary value of engagement-driven signups for ROAS. |
| Total Engagement Value for Checkout in Micro Dollar | Ad Analytics | Value from engagement-driven checkouts for revenue analysis. |
| Total Click Value for Sign-up in Micro Dollar | Ad Analytics | Click-attributed value for signup actions. |
| Total Click Value for Checkout in Micro Dollar | Ad Analytics | Click-attributed checkout value to assess paid click quality. |
| Total View Value for Sign-up in Micro Dollar | Ad Analytics | View-attributed signup value for view-through attribution. |
| Total View Value for Checkout in Micro Dollar | Ad Analytics | View-attributed checkout value for multi-touch insights. |
| Total Page Visits | Ad Analytics | Visits driven by ads — measures site traffic volume from Pinterest. |
| Total Web Sessions | Ad Analytics | Sessions generated by ads; helps assess session quality. |
| Total Signups | Ad Analytics | Signup conversions attributed to ads — lead gen KPI. |
| Total Checkouts | Ad Analytics | Completed purchases attributed to ads — ecommerce KPI. |
| Total Custom Events | Ad Analytics | Tracks custom events to measure bespoke campaign goals. |
| Total Leads | Ad Analytics | Leads generated from ads for sales pipeline tracking. |
| Total Signup Value in Micro Dollar | Ad Analytics | Monetary value of signups for ROI and LTV estimates. |
| Total Checkout Value in Micro Dollar | Ad Analytics | Checkout revenue attributed to ads for revenue tracking. |
| Total Custom Value in Micro Dollar | Ad Analytics | Value from custom conversions for bespoke ROI metrics. |
| Page Visit Cost per Action | Ad Analytics | Cost to drive page visits — useful for traffic campaigns. |
| Page Visit ROAS | Ad Analytics | ROAS specifically for page visits to evaluate profitability. |
| Checkout ROAS | Ad Analytics | ROAS for checkout events — key ecommerce metric. |
| Custom ROAS | Ad Analytics | ROAS for custom conversion types. |
| Total Video 3-Second Views | Ad Analytics | Measures short video attention — baseline video engagement. |
| Total Video 100% Complete Views | Ad Analytics | Tracks full video completions — strong engagement signal. |
| Total Video Average Watch Time in Seconds | Ad Analytics | Average watch duration to measure content effectiveness. |
| Web Checkout Cost per Action in Micro Dollar | Ad Analytics | Cost to drive web checkouts — critical for purchase ROI. |
| Web Checkout Return on Ad Spend (ROAS) | Ad Analytics | ROAS for web checkouts to measure ad profitability. |
| Total Web Checkouts | Ad Analytics | Total web purchases from ads — direct revenue metric. |
| Total Web Checkout Value in Micro Dollar | Ad Analytics | Total checkout revenue in micro dollars for precise accounting. |
| Total Web Clicks to Checkout | Ad Analytics | Clicks that led to checkout pages for funnel tracking. |
| Total Web Click Checkout Value in Micro Dollar | Ad Analytics | Value from clicks that led to checkouts for attribution. |
| Total Web Engagements Leading to Checkout | Ad Analytics | Engagements that progressed to checkout, showing funnel efficiency. |
| Total Web Engagement Checkout Value in Micro Dollar | Ad Analytics | Monetary value of engagement->checkout conversions. |
| Total Web View Checkout | Ad Analytics | View-through checkout events for view attribution. |
| Total Web View Checkout Value in Micro Dollar | Ad Analytics | Value from view-through checkout events. |
| In-App Checkout Cost per Action in Micro Dollar | Ad Analytics | Cost to drive in-app checkouts for mobile ROAS. |
| Cost per Lead | Ad Analytics | Cost to acquire leads — essential for CPA management. |
| Showcase Pin Click-Throughs | Ad Analytics | CTR for showcase pins to assess their performance. |
| Total Checkout Conversion Rate | Ad Analytics | Percentage of checkout completions — conversion efficiency. |
| Total View Category Conversion Rate | Ad Analytics | Conversion rate for specific view categories — segmentation insight. |
| Total Add to Cart Conversion Rate | Ad Analytics | Rate at which views or clicks converted to add-to-cart. |
| Total Signup Conversion Rate | Ad Analytics | Signup conversion efficiency from ad-driven traffic. |
| Total Page Visit Conversion Rate | Ad Analytics | Conversion rate based on page visits — funnel indicator. |
| Total Lead Conversion Rate | Ad Analytics | Measures how well ad traffic converts into leads. |
| Total Search Conversion Rate | Ad Analytics | Conversion rate from search-driven Pinterest traffic. |
| Total Watched Video Conversion Rate | Ad Analytics | Conversion rate from video viewers — measures video impact. |
| Total Unknown Conversion Rate | Ad Analytics | Captures conversions not mapped to standard types. |
| Total Custom Conversion Rate | Ad Analytics | Conversion rate for custom conversion definitions. |
| Total Audience | Audience Analytics | Size of targeted or exposed audience for reach planning. |
| Your Engaged Audience | Audience Analytics | Number of engaged users to assess active reach. |
| Pinterest Total Audience | Audience Analytics | Platform-wide audience baseline for benchmarking. |
| Frequency | Ad Group Analytics | Impressions per user at ad-group level — manage ad fatigue. |
| Cost per Outbound Click in Dollar | Ad Group Analytics | Ad-group-level cost to drive external clicks for granular CPA control. |
| Total Engagement Signups | Ad Group Analytics | Engagement-driven signups at ad-group level to assess creative impact. |
| Total Engagement to Checkout | Ad Group Analytics | Engagement->checkout counts per ad-group for funnel optimization. |
| Total Engagement Leads | Ad Group Analytics | Leads generated from engagements by ad-group for targeting tests. |
| Total Clicks on Signup | Ad Group Analytics | Signup CTA clicks per ad-group to evaluate conversions. |
| Total Clicks on Checkout | Ad Group Analytics | Checkout CTA clicks per ad-group for performance split-testing. |
| Total Clicks on Add to Cart | Ad Group Analytics | Add-to-cart clicks per ad-group for product interest signals. |
| Total Clicks on Lead Generation | Ad Group Analytics | Lead-gen clicks per ad-group to assess campaign efficacy. |
| Total Views on Signup | Ad Group Analytics | Views on signup pages per ad-group to monitor top-of-funnel activity. |
| Total Views on Checkout | Ad Group Analytics | Views on checkout pages per ad-group to monitor purchase intent. |
| Total Views on Add to Cart | Ad Group Analytics | Views on add-to-cart per ad-group for product interest breakdown. |
| Total Views on Lead Generation | Ad Group Analytics | Views on lead pages per ad-group for lead nurturing. |
| Total Conversions | Ad Group Analytics | Conversions at ad-group level for granular ROI analysis. |
| Total Engagement Value for Sign-up in Micro Dollar | Ad Group Analytics | Engagement value for signups by ad-group for attribution. |
| Total Engagement Value for Checkout in Micro Dollar | Ad Group Analytics | Engagement value for checkouts by ad-group for revenue mapping. |
| Total Click Value for Sign-up in Micro Dollar | Ad Group Analytics | Click-attributed value for signups at ad-group level. |
| Total Click Value for Checkout in Micro Dollar | Ad Group Analytics | Click-attributed checkout value by ad-group. |
| Total View Value for Sign-up in Micro Dollar | Ad Group Analytics | View-attributed signup value per ad-group. |
| Total View Value for Checkout in Micro Dollar | Ad Group Analytics | View-attributed checkout value per ad-group. |
| Total Page Visits | Ad Group Analytics | Page visits from an ad-group for traffic attribution. |
| Total Web Sessions | Ad Group Analytics | Sessions by ad-group for engagement-quality checks. |
| Total Signups | Ad Group Analytics | Signups attributed to specific ad-groups for campaign optimization. |
| Total Checkouts | Ad Group Analytics | Checkouts attributed to ad-groups for revenue attribution. |
| Total Custom Events | Ad Group Analytics | Custom event counts per ad-group for custom KPIs. |
| Total Leads | Ad Group Analytics | Leads per ad-group for granular lead quality analysis. |
| Total Signup Value in Micro Dollar | Ad Group Analytics | Signup revenue per ad-group for ROI calculations. |
| Total Checkout Value in Micro Dollar | Ad Group Analytics | Checkout revenue per ad-group for profitability checks. |
| Total Custom Value in Micro Dollar | Ad Group Analytics | Custom conversion value per ad-group for specialized reporting. |
| Page Visit Cost per Action | Ad Group Analytics | Cost per page visit at ad-group level for CPA tuning. |
| Page Visit ROAS | Ad Group Analytics | ROAS for page visits per ad-group to compare tactics. |
| Checkout ROAS | Ad Group Analytics | Checkout ROAS per ad-group for purchase-focused optimization. |
| Custom ROAS | Ad Group Analytics | Custom-action ROAS per ad-group for non-standard goals. |
| Total Video 3-Second Views | Ad Group Analytics | Short video attention per ad-group for creative assessment. |
| Total Video 100% Complete Views | Ad Group Analytics | Full video completion counts per ad-group for strong engagement signals. |
| Total Video Average Watch Time in Seconds | Ad Group Analytics | Average watch time per ad-group to compare creative performance. |
| Web Checkout Cost per Action in Micro Dollar | Ad Group Analytics | Web checkout CPA per ad-group for accurate cost tracking. |
| Web Checkout Return on Ad Spend (ROAS) | Ad Group Analytics | Web checkout ROAS per ad-group for profitability by tactic. |
| Total Web Checkouts | Ad Group Analytics | Web purchases attributed to ad-groups for fine-grained revenue reporting. |
| Total Web Checkout Value in Micro Dollar | Ad Group Analytics | Value of web checkouts per ad-group in micro dollars. |
| Total Web Clicks to Checkout | Ad Group Analytics | Clicks leading to checkout per ad-group for funnel tracing. |
| Total Web Click Checkout Value in Micro Dollar | Ad Group Analytics | Checkout value from clicks per ad-group in micro dollars. |
| Total Web Engagements Leading to Checkout | Ad Group Analytics | Web engagements that turned into checkouts per ad-group. |
| Total Web Engagement Checkout Value in Micro Dollar | Ad Group Analytics | Value from engagement->checkout per ad-group in micro dollars. |
| Total Web View Checkout | Ad Group Analytics | View-through checkout events per ad-group for attribution. |
| Total Web View Checkout Value in Micro Dollar | Ad Group Analytics | View-through checkout value per ad-group. |
| In-App Checkout Cost per Action in Micro Dollar | Ad Group Analytics | In-app checkout CPA per ad-group for mobile optimization. |
| Cost per Lead | Ad Group Analytics | Lead CPA per ad-group to control cost of acquisition. |
| Showcase Pin Click-Throughs | Ad Group Analytics | Showcase pin clicks per ad-group for format-specific insight. |
| Total Checkout Conversion Rate | Ad Group Analytics | Checkout conversion rate per ad-group for conversion optimization. |
| Total View Category Conversion Rate | Ad Group Analytics | Conversion rate per view category to identify high-performing categories. |
| Total Add to Cart Conversion Rate | Ad Group Analytics | Add-to-cart conversion rate per ad-group to measure purchase intent. |
| Total Signup Conversion Rate | Ad Group Analytics | Signup conversion rate per ad-group to optimize lead funnels. |
| Total Page Visit Conversion Rate | Ad Group Analytics | Conversion rate based on page visits per ad-group for funnel insights. |
| Total Lead Conversion Rate | Ad Group Analytics | Lead conversion rate per ad-group for lead quality checks. |
| Total Search Conversion Rate | Ad Group Analytics | Conversion rate from search on Pinterest Ads per ad-group. |
| Total Watched Video Conversion Rate | Ad Group Analytics | Conversion from video viewers per ad-group to assess video ROI. |
| Total Unknown Conversion Rate | Ad Group Analytics | Rate of conversions not mapped to known types — useful for gap analysis. |
| Total Custom Conversion Rate | Ad Group Analytics | Custom conversion rate per ad-group for bespoke KPIs. |
| Total Audience | Audience Analytics | Size of reachable audience for campaign planning. |
| Your Engaged Audience | Audience Analytics | Engaged users count to evaluate active reach. |
| Pinterest Total Audience | Audience Analytics | Platform-wide audience for benchmarking. |
| Add a scroll in the div | — | (UI instruction applied above.) |
🔗 Pinterest Ads Dimensions
The table below lists the Pinterest Ads Dimensions available through the Whatsdash Pinterest Ads Integration.
| Name | Category | Why it’s useful |
|---|---|---|
| Location | Ad Analytics | Helps identify which geographical areas perform best for your Pinterest ads. |
| Placement | Ad Analytics | Reveals where your ads appear on Pinterest, aiding optimization of placements for better performance. |
| Country | Ad Analytics | Allows you to track ad performance across different countries. |
| Region | Ad Analytics | Provides regional-level insights for localized ad performance tracking. |
| Targeted Interest | Ad Group Analytics | Shows which audience interests drive engagement in ad groups. |
| Geography | Ad Group Analytics | Offers geographical breakdown for ad group-level performance insights. |
| Location | Campaign Analytics | Identifies top-performing locations for campaign-level analysis. |
| Targeted Interest | Campaign Analytics | Helps optimize campaigns based on the audience interests being targeted. |
| Keyword | Ad Analytics | Lets you analyze ad performance by targeted keywords. |
| Pinner Interest | Ad Analytics | Reveals the interests of users interacting with your ads. |
| Audience Include | Ad Analytics | Helps track which audiences are included in targeting strategies. |
| Country | Ad Group Analytics | Provides insight into which countries deliver the best ad group performance. |
| Audience Include | Ad Group Analytics | Tracks inclusion of specific audiences in ad group targeting. |
| App Type | Campaign Analytics | Helps understand which app type (mobile/web) drives better campaign results. |
| Placement | Campaign Analytics | Reveals ad performance based on placement within Pinterest. |
| App Type | Ad Analytics | Tracks ad performance across app types to optimize delivery channels. |
| Geography | Ad Analytics | Offers geographical segmentation for ad performance analytics. |
| Age Bucket | Ad Analytics | Allows targeting and performance evaluation across age groups. |
| Keyword | Ad Group Analytics | Lets you assess ad group performance by specific keywords. |
| App Type | Ad Group Analytics | Measures performance variations across app types within ad groups. |
| Gender | Ad Group Analytics | Helps optimize ad group targeting based on gender demographics. |
| Pinner Interest | Ad Group Analytics | Provides insights into audience interests that lead to engagement. |
| Keyword | Campaign Analytics | Evaluates campaign success based on keyword performance. |
| Targeted Interest | Ad Analytics | Analyzes engagement based on user interests targeted by ads. |
| Gender | Ad Analytics | Breaks down performance by gender to optimize audience targeting. |
| Location | Ad Group Analytics | Identifies top-performing locations for ad groups. |
| Placement | Ad Group Analytics | Reveals which placements generate higher engagement. |
| Age Bucket | Ad Group Analytics | Enables age-based segmentation for ad groups. |
| Region | Ad Group Analytics | Tracks performance across different regions. |
| Country | Campaign Analytics | Provides country-level insights into campaign success. |
| Pinner Interest | Campaign Analytics | Understands which audience interests contribute most to campaign engagement. |
| Audience Include | Campaign Analytics | Helps evaluate the impact of audience inclusion on campaign performance. |
| Category | Audience Analytics | Analyzes content categories most engaging to your audience. |
| Gender | Audience Analytics | Provides gender distribution insights of your audience. |
| Gender | Campaign Analytics | Breaks down campaign performance by gender for precise targeting. |
| Geography | Campaign Analytics | Offers regional segmentation for campaign performance tracking. |
| Age Bucket | Campaign Analytics | Enables understanding of how different age groups respond to your campaigns. |
| Device | Audience Analytics | Identifies which devices are most used to interact with your content. |
| City | Audience Analytics | Provides performance insights at a city or metro level. |
| Region | Campaign Analytics | Offers regional-level performance tracking for campaigns. |
| Age | Audience Analytics | Allows segmentation and reporting by audience age groups. |
| Country | Audience Analytics | Tracks audience engagement by country for geographic insights. |
🔗 Explore More Integrations
Whatsdash supports a wide range of marketing, analytics, and eCommerce integrations to give you a holistic view of your business performance.
👉 Visit the Integrations Page to explore all available connections
SalesForce
Salesforce is the world's leading Customer Relationship Management (CRM) platform, helping companies manage and track all customer interactions, sales pipelines, and service activities. It provides a central hub for sales, service, marketing, and commerce data.
Connecting Salesforce to Whatsdash lets you quickly and easily review your sales pipeline health, service ticket status, and marketing-qualified lead (MQL) conversion rates as they move from initial contact to closed-won opportunities.
Why Connect Salesforce to Whatsdash?
Integrating your Salesforce data with Whatsdash transforms complex CRM information into clear, executive-ready reports, making critical sales and service metrics accessible to everyone.
-
Pipeline & Forecasting : Visualize the Sales Pipeline by Stage, monitor Weighted Pipeline Value, and track Time to Close to accurately forecast revenue and identify bottlenecks.
-
High-Level Performance : Consolidate top-line Metrics like Converted Revenue, Number of New Leads, and Customer Conversion Rate alongside financial and marketing data.
-
Lead-to-Opportunity Analysis : Blend Salesforce Lead and Opportunity data with GA4 or ad platform metrics to calculate the true Cost Per Acquisition (CPA) and measure the ROI of marketing campaigns.
-
Service Metrics : Monitor key service data like Average Case Resolution Time and Case Volume by Status/Priority to optimize service team efficiency and customer satisfaction.
📋 Steps to Integrate your Salesforce account to Whatsdash
✔️ Navigate to the 'Integrations' page using the Navigation bar.
✔️ Select Salesforce from the Available Integrations.

✔️ Click the + button to open the Salesforce authorization window.
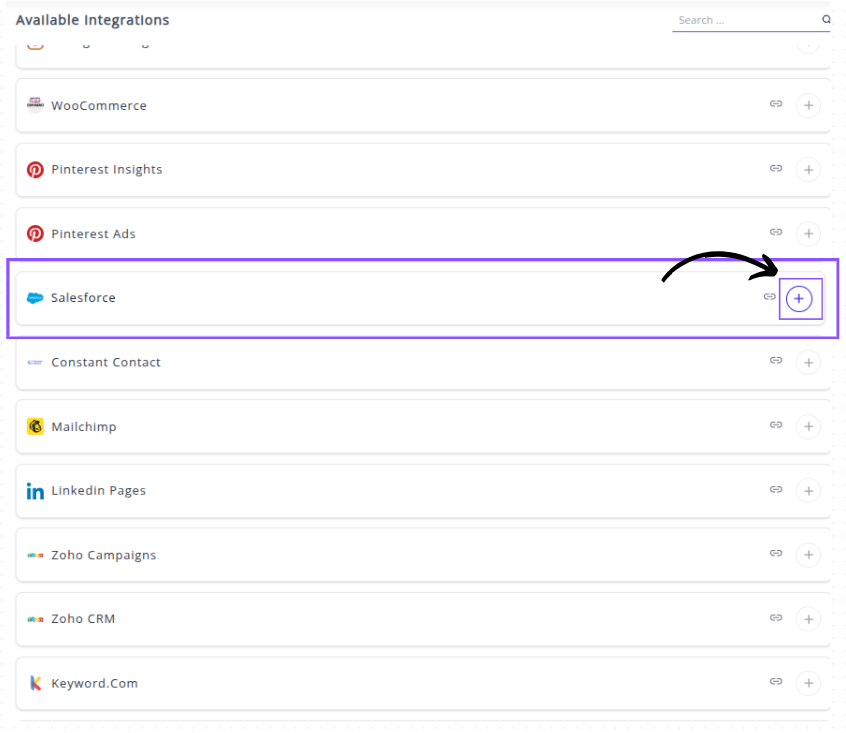
✔️ You will be redirected to the Salesforce Instance URL screen .Provide your SalesForce Instance URL to connect your SalesForce Account with Whatsdash.

✔️ Once authenticated successfully, you will be directed back to Whatsdash. Your Salesforce Integration will appear in the Connected Integrations list with connected accounts.
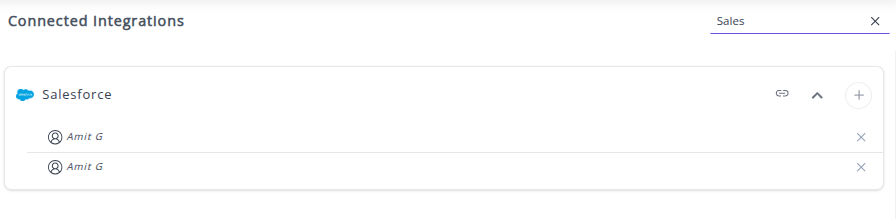
✔️ You can now create or customize dashboards using your Salesforce Metrics and Dimensions.
👉 How to visualize this data in your dashboard, visit the Dashboard Documentation Guide
🔗 SalesForce Metrics
The table below lists key Salesforce Metrics integrated into Whatsdash.
| Name | Category | Why it’s useful |
|---|---|---|
| Leads | Lead | Tracks potential customers who have shown interest in your products or services. |
| Converted Leads | Lead | Helps measure how many leads successfully turn into qualified customers or opportunities. |
| New Customer | Opportunity | Identifies recently acquired customers to assess new business growth. |
| Opportunity | Opportunity | Represents potential sales or deals, helping track revenue opportunities in the pipeline. |
| Amount | Opportunity | Monitors the potential or actual revenue associated with each sales deal. |
| Amount Won | Opportunity | Shows the total revenue earned from successfully closed deals (Closed Won). |
| Amount Lost | Opportunity | Indicates revenue lost from deals that were not successfully closed. |
| Expected Revenue | Opportunity | Projects potential income from opportunities, helping forecast revenue. |
| Expected Revenue | Campaign | Estimates potential revenue impact of marketing campaigns. |
| Win Rate | Opportunity | Measures the percentage of deals won versus total opportunities to assess sales effectiveness. |
| Actual Cost | Campaign | Tracks actual spending on marketing campaigns for budget control. |
| Budgeted Cost | Campaign | Records planned spending, enabling comparison against actual expenses. |
| Campaign | Campaign | Tracks and manages overall marketing initiatives and performance. |
| Amount All Opportunities | Campaign | Summarizes total potential revenue from all opportunities linked to a campaign. |
| Num Sent | Campaign | Monitors the total number of people included in a campaign’s target audience. |
| Contact | Contact | Stores details about individual or business contacts for relationship management. |
| Won Opportunities | Opportunity | Reflects the number of deals successfully closed, indicating sales success. |
| Conversion Rate | Other | Shows the efficiency of converting leads into opportunities using the formula: (Opportunities ÷ Leads) × 100. |
| Converted Revenue | Opportunity | Displays total revenue generated from successfully converted opportunities (Closed Won). |
🔗 SalesForce Dimensions
The table below lists key Salesforce Dimensions integrated into Whatsdash.
| Name | Category | Why it’s useful |
|---|---|---|
| Status | Other | Indicates the current condition or progress of a record, useful for tracking workflow or deal stages. |
| Name | Other | Serves as a standard identifier across objects, enabling consistent referencing of records. |
| Rating | Other | Helps assess the quality or strength of a relationship with an account, aiding in prioritization. |
| Type | Other | Defines the object category or customization level, helping organize records by purpose or usage. |
| Stage | Other | Represents a phase in the sales or business process, useful for tracking deal progress. |
| Country | Other | Provides geographic segmentation to analyze performance or customers by region. |
| Industry | Other | Classifies businesses by industry type, enabling targeted marketing and reporting. |
🔗 Explore More Integrations
Whatsdash supports a wide range of marketing, analytics, and eCommerce integrations to give you a holistic view of your business performance.
👉 Visit the Integrations Page to explore all available connections
Constant Contact
Constant Contact is a widely used email marketing and marketing automation platform that helps businesses create, send, and track professional email campaigns, manage contact lists, and drive audience engagement.
Connecting Constant Contact to Whatsdash lets you quickly and easily review your email campaign performance, audience growth, and crucial engagement rates as they contribute to your overall marketing goals.
Why Connect Constant Contact to Whatsdash?
Integrating your Constant Contact data with Whatsdash centralizes your email marketing reporting, allowing you to measure the effectiveness of your communications and see how email contributes to conversions alongside other channels.
-
Campaign Effectiveness : Track essential Metrics like Open Rate, Click Rate , and Bounce Rate for every campaign to quickly optimize subject lines and content.
-
Audience Health & Growth : Monitor List Growth, Subscribes, and Unsubscribes over time to ensure the health of your email list and measure audience acquisition success.
-
Channel Comparison : See email revenue and engagement metrics alongside social media, paid ads, and website analytics (like GA4) to assess the true ROI of your email channel.
-
Automated Reporting : Get instant, visual reports on email performance without logging into the Constant Contact platform, saving time on manual data compilation.
📋 Steps to Integrate your Constant Contact account to Whatsdash
✔️ Navigate to the 'Integrations' page using the Navigation bar.
✔️ Select Constant Contact from the list of Available Integrations.
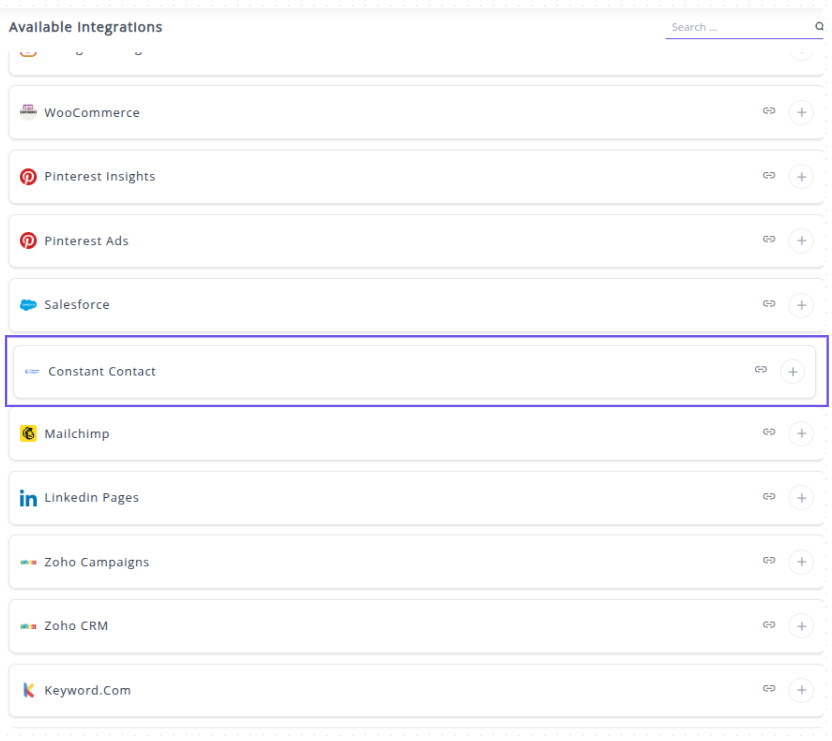
✔️ Click the + button to open the Constant Contact authorization window.
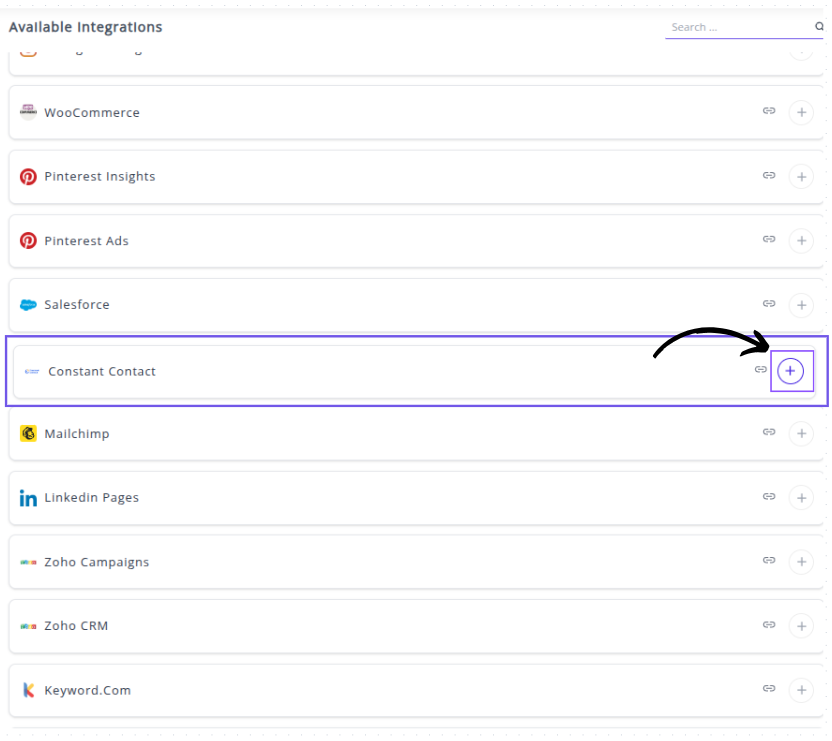
✔️ You will be redirected to the Constant Contact Sign-in page. Log in with the account credentials for your Constant Contact profile.

✔️ Once authenticated successfully, you will be directed back to Whatsdash. Your Constant Contact Integration will appear in the Connected Integrations list.
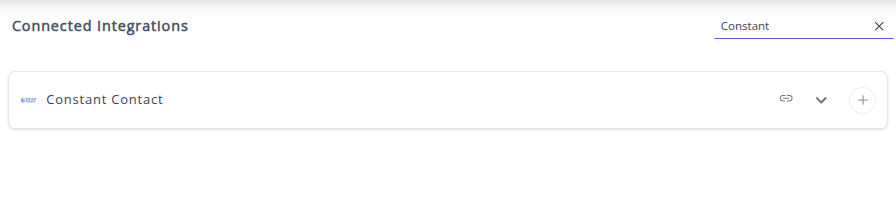
✔️ You can now create or customize dashboards using your Constant Contact Metrics and Dimensions.
👉 How to visualize this data in your dashboard, visit the Dashboard Documentation Guide
🔗 Constant Contact Metrics
The table below lists key Constant Contact Metrics integrated into Whatsdash.
| Name | Category | Why it’s useful |
|---|---|---|
| Bounces | Tracks the number of emails that failed to reach recipients, helping identify deliverability issues. | |
| Bounce Rate | Shows the percentage of emails that bounced, indicating list quality and deliverability health. | |
| Clicks | Measures unique recipients who clicked links, reflecting engagement with email content. | |
| Non-Unique Clicks | Tracks total clicks (including multiple clicks per recipient), showing overall interaction volume. | |
| Click Rate | Indicates the proportion of engaged recipients who clicked, useful for assessing content effectiveness. | |
| Delivered | Shows successfully delivered emails, helping calculate other engagement metrics accurately. | |
| Did Not Open | Counts recipients who didn’t open the email, useful for identifying low engagement segments. | |
| Did Not Open Rate | Percentage of recipients who didn’t open the email, highlighting content or subject line effectiveness. | |
| Forwards | Measures how many recipients shared the email, indicating viral engagement potential. | |
| Open Rate | Shows the percentage of recipients who opened the email, a key metric for campaign performance. | |
| Opens | Counts unique email opens, useful for tracking individual engagement. | |
| Non-Unique Opens | Tracks all opens, including multiple opens by the same recipient, showing content interest. | |
| Send | Number of emails sent, providing a baseline for performance metrics. | |
| Unsubscribes | Counts recipients who opted out, helping monitor list health and content relevance. | |
| Unsubscribe Rate | Percentage of recipients who unsubscribed, important for evaluating email strategy impact. |
🔗 Constant Contact Dimensions
This table lists the key Constant Contact Dimensions for analyzing your email campaigns in Whatsdash.
| Name | Category | Why it’s useful |
|---|---|---|
| Campaign Name | Campaign | Identifies the email campaign, helping analyze performance at the campaign level. |
| Contact Name | Contact | Shows which contact received the email, useful for personalized tracking and engagement analysis. |
| Device Type | Other | Indicates which device was used to view the email, helping optimize emails for mobile, desktop, or tablet. |
| Activity Type | Shows the type of activity (e.g., open, click), allowing detailed engagement analysis. | |
| Email Address | Identifies the recipient email address, useful for tracking deliverability and engagement per user. |
🔗 Explore More Integrations
Whatsdash supports a wide range of marketing, analytics, and eCommerce integrations to give you a holistic view of your business performance.
👉 Visit the Integrations Page to explore all available connections
Mailchimp
Mailchimp is a popular email marketing and automation platform that provides tools for creating, sending, and analyzing email campaigns, managing contact lists, and building landing pages.
Connecting Mailchimp to Whatsdash lets you quickly and easily review your email campaign performance, audience growth, and crucial email engagement metrics as they drive traffic and sales for your business.
Why Connect Mailchimp to Whatsdash?
Integrating your Mailchimp data with Whatsdash consolidates your email marketing efforts into a unified reporting dashboard, allowing you to effectively measure campaign success and list health alongside other key business metrics.
-
Campaign Performance Analysis : Instantly compare the Open Rate, Click-Through Rate (CTR), and Unsubscribe Rate across different campaigns to determine successful content and targeting strategies.
-
Audience Acquisition & Retention : Monitor List Growth and segmentation performance to track audience acquisition success and identify which lists are the most engaged.
-
Holistic Marketing ROI : Visualize email performance and revenue metrics next to data from platforms like GA4 and ad campaigns to understand the overall effectiveness of your marketing mix.
-
Simplified Reporting : Access critical email stats via customizable widgets, eliminating the need to log into multiple platforms for performance reviews.
📋 Steps to Integrate your Mailchimp account to Whatsdash
✔️ Navigate to the 'Integrations' page using the Navigation bar.
✔️ Select Mailchimp from the Available Integrations.
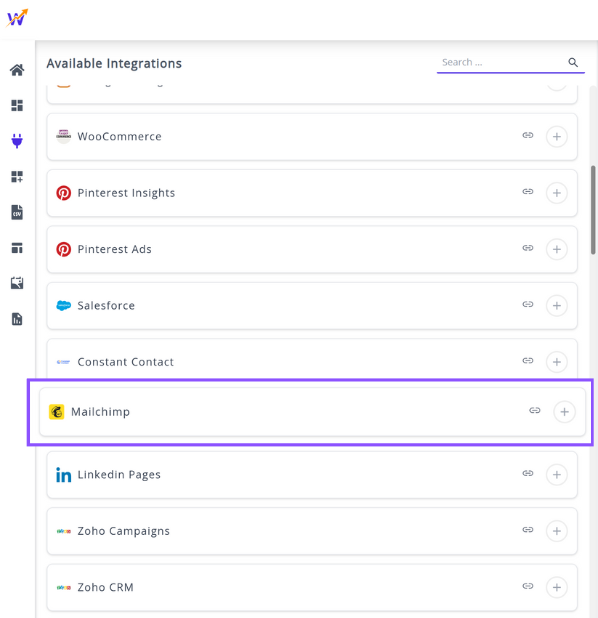
✔️ Click the + button to open the Mailchimp authorization window.


✔️ Once authenticated successfully, you will be directed back to Whatsdash. Your Mailchimp Integration will appear in the Connected Integrations list.

✔️ You can now create or customize dashboards using your Mailchimp Metrics and Dimensions.
👉 How to visualize this data in your dashboard, visit the Dashboard Documentation Guide
🔗 Mailchimp Metrics
The table below lists the Mailchimp Metrics available through the Whatsdash Mailchimp Integration.
| Name | Category | Why it’s useful |
|---|---|---|
| Unique Clicks | Campaign | Tracks the number of unique recipients who clicked links, helping measure engagement quality. |
| Bounce Rate | Campaign | Indicates email deliverability issues by showing the percentage of failed deliveries. |
| Total Clicks | Campaign | Measures total engagement, including multiple clicks from the same user. |
| Unique Opens | Campaign | Identifies how many unique users opened your campaign, reflecting audience reach. |
| Users Who Clicked Rate (Clicks / Recipients) | Campaign | Measures click-through performance relative to total recipients. |
| Hard Bounces | Automation Campaign | Helps detect invalid or inactive email addresses that result in permanent delivery failure. |
| Users Who Clicked Rate (Clicks / Recipients) | Automation Campaign | Assesses engagement by showing what percentage of recipients clicked links. |
| Hard Bounces | A/B Campaign | Evaluates email quality and deliverability by counting permanent bounce failures. |
| Users Who Clicked | Automation Campaign | Tracks how many people interacted by clicking links in automated campaigns. |
| Soft Bounces | Campaign | Identifies temporary delivery failures to optimize future send lists. |
| Hard Bounces | Campaign | Helps clean lists by tracking permanently undeliverable addresses. |
| Unique Opens | Automation Campaign | Measures how many unique recipients opened automated emails. |
| Bounce Rate | A/B Campaign | Indicates delivery success rate in A/B test variations. |
| Total Opens | A/B Campaign | Reflects overall engagement by counting all opens, including repeats. |
| Users Who Clicked Rate (Clicks / Recipients) | A/B Campaign | Helps determine which A/B variant performed best based on click rates. |
| Users Who Clicked Rate (clicks_total / unique_opens) | A/B Campaign | Measures post-open engagement by comparing clicks to opens. |
| Users Who Clicked Rate (clicks_total / unique_opens) | Engagement Metrics | Evaluates engagement depth — how many openers also clicked. |
| Bounce Rate | Automation Campaign | Tracks deliverability performance for automated emails. |
| Soft Bounces | Automation Campaign | Identifies temporary issues preventing delivery. |
| Emails Sent | Automation Campaign | Shows how many contacts received automated emails. |
| Soft Bounces | A/B Campaign | Tracks temporary delivery issues during A/B tests. |
| Open Rate | A/B Campaign | Indicates engagement by showing the percentage of recipients who opened. |
| Users Who Clicked | Campaign | Shows audience engagement by counting those who clicked links. |
| Users Who Clicked | A/B Campaign | Compares engagement between A/B variations based on clicks. |
| Emails Sent | Campaign | Displays total send volume for campaign tracking. |
| Open Rate | Campaign | Helps measure how compelling subject lines and send timing are. |
| Total Opens | Campaign | Measures total interest, including repeat opens from engaged users. |
| Total Clicks | Automation Campaign | Reflects total link interactions across all recipients in automations. |
| Unique Clicks | Automation Campaign | Counts distinct recipients who engaged via clicks. |
| Open Rate | Automation Campaign | Measures engagement by showing how many recipients opened automated messages. |
| Total Opens | Automation Campaign | Shows overall open activity for automated messages. |
| Users Who Clicked Rate (clicks_total / unique_opens) | Automation Campaign | Indicates how many openers took action by clicking. |
| Total Clicks | A/B Campaign | Tracks engagement level across both variants. |
| Emails Sent | A/B Campaign | Displays total send count for each A/B test version. |
| Unique Opens | A/B Campaign | Measures reach by counting unique openers for each version. |
| Unique Clicks | A/B Campaign | Determines click performance across A/B test variants. |
| List Member Count | Audience | Tracks audience list size to monitor growth and segmentation. |
| Unsubscribe Count | Audience | Shows how many users opted out, helping gauge content relevance and fatigue. |
🔗 Mailchimp Dimensions
The table below lists the Mailchimp Dimensions available through the Whatsdash Mailchimp Integration.
| Name | Category | Why it’s useful |
|---|---|---|
| Campaign | Campaign | Helps identify and analyze the performance of individual email campaigns. |
| Campaign Type | Campaign | Allows comparison of different campaign types (e.g., promotional vs. automated) for strategy optimization. |
| Segment | Campaign | Enables performance tracking across specific audience segments or lists. |
| Region | Audience | Provides insights into geographic performance and regional engagement trends. |
| Mailing List | Audience | Helps evaluate engagement and results for each targeted mailing list. |
🔗 Explore More Integrations
Whatsdash supports a wide range of marketing, analytics, and eCommerce integrations to give you a holistic view of your business performance.
👉 Visit the Integrations Page to explore all available connections
LinkedIn Pages
LinkedIn Pages are the official presence for businesses, organizations, and educational institutions on LinkedIn. They are used to build brand awareness, share company news, attract talent, and engage with followers in a professional context.
Connecting LinkedIn Pages to Whatsdash lets you quickly and easily review your content performance, audience demographics, and organic engagement metrics to measure your professional social presence and reach.
Why Connect LinkedIn Pages to Whatsdash?
Integrating your LinkedIn Pages data with Whatsdash provides essential insights into your professional social marketing, allowing you to track the effectiveness of your organic content and audience growth efforts.
-
Content Performance : Monitor post-level Metrics like Impressions, Reactions, and Comments to identify which content formats resonate most with your professional audience.
-
Audience Growth & Reach : Track Follower Growth Rate and Total Followers alongside demographics like Seniority and Industry to ensure your organic content is reaching the right professional target.
-
Cross-Channel Social: View Compare LinkedIn's professional engagement rates against other social channels to understand where your B2B audience is most active.
📋 Steps to Integrate your LinkedIn Pages account to Whatsdash
✔️ Navigate to the 'Integrations' page using the Navigation bar.
✔️ Select LinkedIn Pages from the Available Integrations.
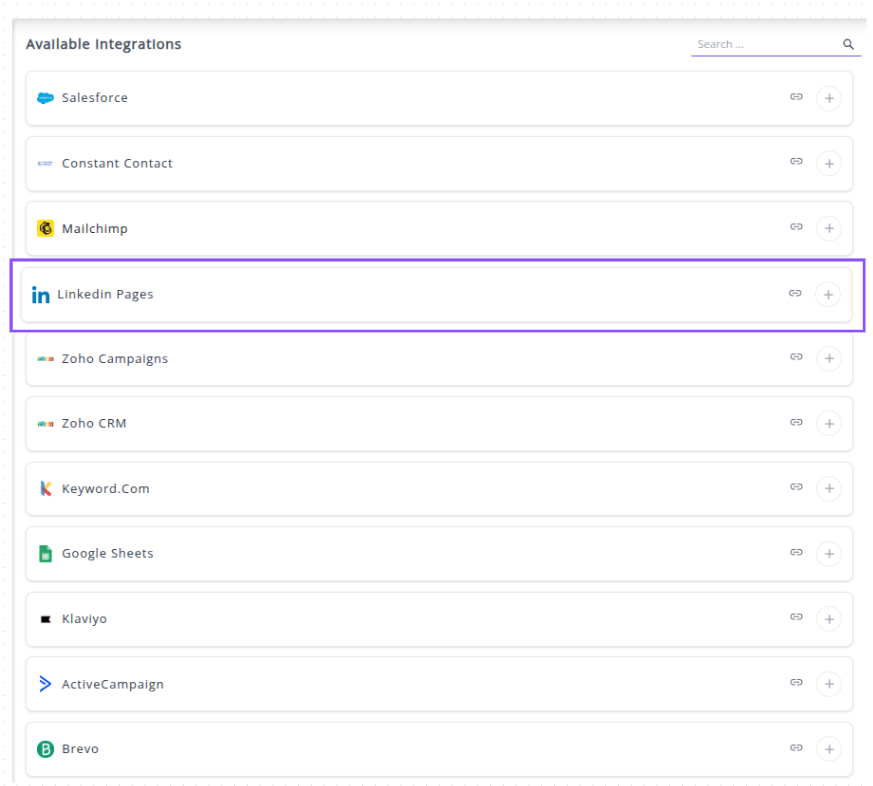
✔️ Click the + button to open the LinkedIn authorization window.

✔️ You will be redirected to the LinkedIn sign-in page. Log in with a personal LinkedIn account that has Admin Access to the Company Page(s) you wish to report on.

✔️ Once authenticated successfully, you will be directed back to Whatsdash. Your LinkedIn Pages Integration will appear in the Connected Integrations list.

✔️ You can now create or customize dashboards using your LinkedIn Pages Metrics and Dimensions.
👉 How to visualize this data in your dashboard, visit the Dashboard Documentation Guide.
🔗 Linkedin Pages Metrics
Below is a comprehensive list of Metrics covering your organic presence, audience, and post performance on LinkedIn Pages.
| Name | Category | Why it’s useful |
|---|---|---|
| Clicks | Post | Helps measure how many people interacted by clicking links or CTAs in your posts. |
| Comments | Post | Shows how engaging your content is through user discussions and feedback. |
| Engagement | Post | Provides an overall view of audience interaction by combining all engagement types. |
| Engagement Rate | Post | Useful for comparing engagement performance relative to impressions. |
| Impressions | Post | Indicates how many times your post appeared to users, helping assess visibility. |
| Likes | Post | Measures how positively your audience responds to your content. |
| Shares | Post | Reflects content virality and how often your posts are reshared by others. |
| Follower Engagement Rate | Follower | Reveals how actively your followers interact with your posts. |
| Followers | Follower | Tracks audience growth and reach potential. |
| Engaged Viewers | Video | Helps understand how many unique users actively interacted with your videos. |
| Time Watched | Video | Indicates audience retention and how engaging your video content is over time. |
| Video Views | Video | Measures how many people watched your video for at least a few seconds. |
🔗 Linkedin Pages Dimensions
The table below lists the Linkedin Pages Dimensions available through the Whatsdash Linkedin Pages Integration.
| Name | Category | Why it’s useful |
|---|---|---|
| Post with image | Post | Helps visually identify and analyze post performance through both text and image. |
| Video | Video | Useful for tracking and reviewing engagement across different video posts. |
🔗 Explore More Integrations
Whatsdash supports a wide range of marketing, analytics, and eCommerce integrations to give you a holistic view of your business performance.
👉 Visit the Integrations Page to explore all available connections
Zoho Campaigns
Zoho Campaigns is an email marketing automation software that helps businesses create, send, and track email campaigns, manage subscribers, and automate workflows.
Connecting Zoho Campaigns to Whatsdash lets you quickly and easily review your email campaign success, list growth, and crucial engagement rates such as opens, clicks, and bounces, centralized alongside other business data.
Why Connect Zoho Campaigns to Whatsdash?
Integrating your Zoho Campaigns data with Whatsdash gives you clear, visual access to your email marketing performance, enabling you to measure audience health and campaign effectiveness without needing to manually extract reports.
-
Campaign ROI & Engagement : Quickly analyze Open Rate and Click Rate by individual campaign to fine-tune content, subject lines, and timing for future sends.
-
Audience Health Monitoring : Track the health of your email lists by monitoring Subscribers, Unsubscribes, and Bounce Rate over time to maintain data quality and compliance.
-
Cross-Channel Performance : Combine Zoho Campaigns metrics with data from Zoho CRM or other marketing platforms to understand the full customer journey and attribute sales to email efforts.
-
Automated Insights : Get instant, visual updates on email performance via dashboards, eliminating the need for manual report generation and sharing.
📋 Steps to Integrate your Zoho Campaigns account to Whatsdash
✔️ Navigate to the 'Integrations' page using the Navigation bar.
✔️ Select Zoho Campaigns from the Available Integrations.

✔️ Click the + button to open the "Zoho" authorization window.

✔️ Select your Zoho Data Center : You will first be directed to a screen to choose your regional data center . This ensures Whatsdash connects to the correct Zoho server.

✔️ You will then be redirected to the Zoho Sign-in page. Log in with the Zoho account that has administrative access to your Zoho Campaigns data.

✔️ Grant Whatsdash the necessary permissions to Read your Campaign and List data.
✔️ Once authenticated, you will be directed back to Whatsdash. Your Zoho Campaigns Integration will appear in the Connected Integrations list.

✔️ You can now create or customize dashboards using your Zoho Campaigns Metrics and Dimensions.
👉 How to visualize this data in your dashboard, visit the Dashboard Documentation Guide
🔗 Zoho Campaigns Metrics
The table below lists the Zoho Campaigns Metrics available through the Whatsdash Zoho Campaigns Integration.
| Name | Category | Why it’s useful |
|---|---|---|
| Forwards (Percentage) | Campaign Analytics | Measures how often recipients forward your email, indicating shareable or valuable content. |
| Hard Bounce | Campaign Analytics | Helps identify invalid or unreachable email addresses to maintain list quality. |
| Unsent | Campaign Analytics | Tracks how many emails weren’t sent due to errors or suppression lists. |
| Bounce (Percentage) | Campaign Analytics | Shows the overall health of your email list by measuring delivery issues. |
| Unique clicks (Percentage) | Campaign Analytics | Evaluates recipient engagement by measuring the percentage of users who clicked links. |
| Unopened | Campaign Analytics | Indicates audience disinterest or poor subject line performance. |
| Unsubscribe (Percentage) | Campaign Analytics | Helps assess audience retention and campaign relevance. |
| Spams | Campaign Analytics | Identifies the number of recipients marking your email as spam to prevent deliverability issues. |
| Spams (Percentage) | Campaign Analytics | Highlights the spam complaint rate to monitor sender reputation. |
| Delivered (Percentage) | Campaign Analytics | Measures successful delivery rate, helping evaluate technical deliverability. |
| Delivered | Campaign Analytics | Tracks the total number of emails successfully delivered to inboxes. |
| Complaints | Campaign Analytics | Monitors user dissatisfaction or potential email fatigue. |
| Unopened (Percentage) | Campaign Analytics | Helps measure content engagement by tracking how many didn’t open the email. |
| Autoreply | Campaign Analytics | Indicates how many automated responses were received, useful for cleaning engagement metrics. |
| Soft Bounce | Campaign Analytics | Tracks temporary delivery failures like full inboxes or server issues. |
| Opens | Campaign Analytics | Measures how many recipients opened your email, indicating subject line effectiveness. |
| Unique clicks | Campaign Analytics | Identifies the number of unique recipients engaging with links. |
| Unsubscribe | Campaign Analytics | Tracks how many recipients opted out, helping gauge campaign relevance. |
| Complaints (Percentage) | Campaign Analytics | Shows the percentage of recipients who complained, aiding in compliance monitoring. |
| Bounces | Campaign Analytics | Monitors total failed deliveries to maintain sender reputation. |
| Unsent (Percentage) | Campaign Analytics | Measures the proportion of emails that failed to send. |
| Opens (Percentage) | Campaign Analytics | Evaluates engagement by comparing opens to total delivered emails. |
| Click-to-open rate | Campaign Analytics | Measures how compelling your email content is after being opened. |
| Forwards | Campaign Analytics | Tracks how often recipients share your email content. |
| Sent | Campaign Analytics | Shows how many total emails were successfully sent. |
| Reach | Campaign Analytics | Indicates total audience exposure for the campaign. |
| Contacts | Campaign Analytics | Tracks the total number of recipients or contacts included in the campaign. |
🔗 Zoho Campaigns Dimensions
The table below lists the Zoho Campaigns Dimensions available through the Whatsdash Zoho Campaigns Integration.
| Name | Category | Why it’s useful |
|---|---|---|
| Platform | Campaign Analytics | Helps identify which platform your campaign was shared on, allowing analysis of performance by channel. |
| List Name | List Analytics | Tracks the name of each list created to organize and manage audience segments effectively. |
| Campaign Name | Campaign Analytics | Identifies which campaign an activity or result belongs to, helping in performance comparison and reporting. |
🔗 Explore More Integrations
Whatsdash supports a wide range of marketing, analytics, and eCommerce integrations to give you a holistic view of your business performance.
👉 Visit the Integrations Page to explore all available connections
Zoho CRM
Zoho CRM is a comprehensive Customer Relationship Management platform that helps businesses manage sales, marketing, and customer support across all channels. It provides a central system to organize, automate, and analyze customer data.
Connecting Zoho CRM to Whatsdash lets you quickly and easily review your sales pipeline health, lead generation efficiency, and overall revenue performance by tracking leads, contacts, accounts, and opportunities in a unified dashboard.
Why Connect Zoho CRM to Whatsdash?
Integrating your Zoho CRM data with Whatsdash transforms raw customer and sales data into focused, actionable reports, making it easier for sales managers and executives to track goals and forecast revenue.
-
Pipeline Visibility : Visualize the Sales Pipeline by Stage, monitor the Revenue, and track Time to Close to accurately forecast revenue and pinpoint bottlenecks.
-
Lead-to-Opportunity Metrics : Blend CRM Lead Source data with marketing campaign Metrics to measure the conversion rate from initial lead to qualified opportunity.
-
Revenue & Retention : Consolidate top-line metrics like Total Converted Revenue, Number of New Accounts, and Customer Retention alongside financial and marketing data.
-
Simplified, Blended Reporting : Create instant, visual reports using Zoho CRM data blended with other sources without having to navigate complex CRM reporting tools.
📋 Steps to Integrate your Zoho CRM account to Whatsdash
✔️ Navigate to the 'Integrations' page using the Navigation bar.
✔️ Select Zoho CRM from the Available Integrations.
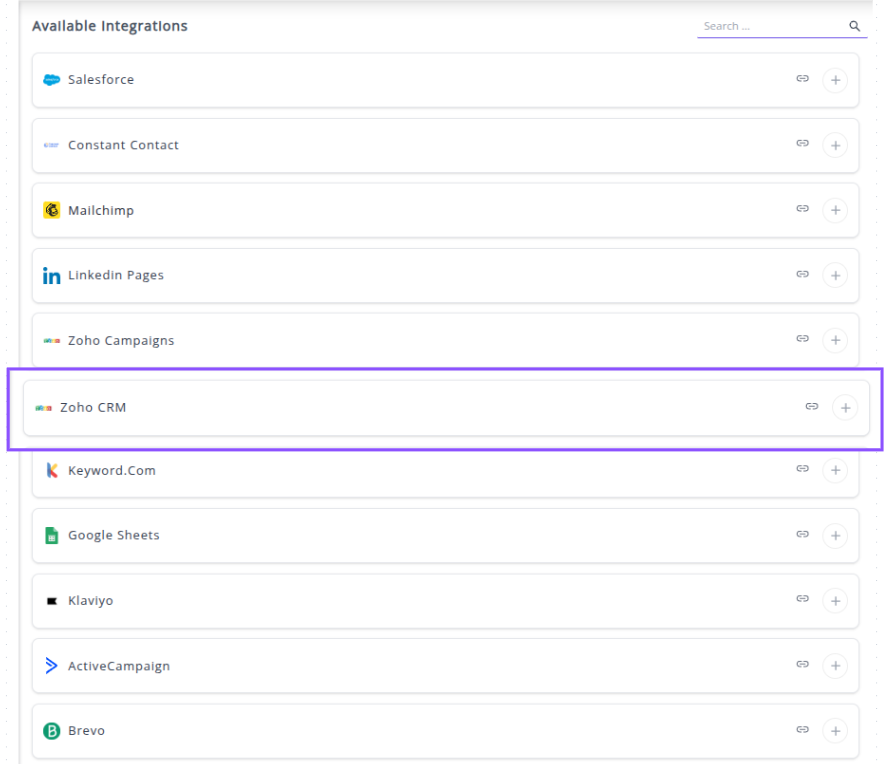
✔️ Click the + button to open the "Zoho" authorization window.
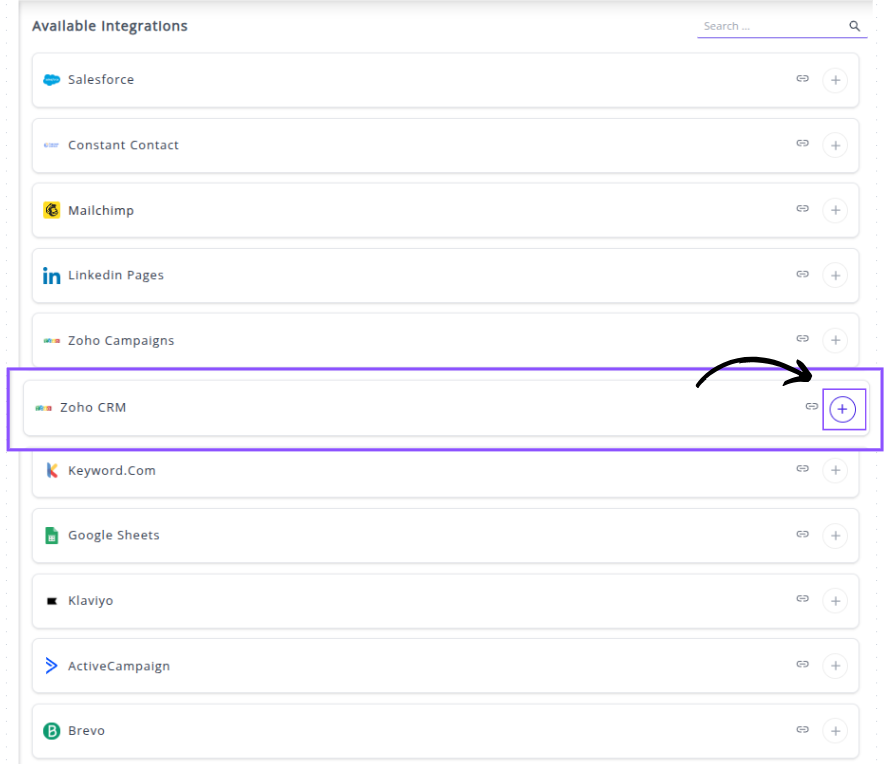
✔️ Select your Zoho Data Center : You will first be directed to a screen to choose your regional data center . This ensures Whatsdash connects to the correct Zoho server.
✔️ You will then be redirected to the Zoho Sign-in page. Log in with the Zoho account that has administrative access to your Zoho Campaigns data.
✔️ Grant Whatsdash the necessary permissions to Read your Campaign and List data.
✔️ Once authenticated, you will be directed back to Whatsdash. Your Zoho Campaigns Integration will appear in the Connected Integrations list.

✔️ You can now create or customize dashboards using your Zoho Campaigns Metrics and Dimensions.
👉 How to visualize this data in your dashboard, visit the Dashboard Documentation Guide
🔗 Zoho CRM Metrics
The table below lists the Zoho CRM Metrics available through the Whatsdash Zoho CRM Integration.
| Name | Category | Why it’s useful |
|---|---|---|
| Accounts | Accounts | Helps you track the total number of accounts managed within your CRM. |
| Converted Leads | Leads | Measures how effectively your team converts leads into opportunities or customers. |
| Leads | Leads | Tracks potential customers who have shown interest but aren’t yet qualified. |
| Annual Revenue | Leads | Helps estimate the financial potential of each lead based on their yearly income. |
| No of Employees | Leads | Useful for understanding the company size and tailoring sales strategies accordingly. |
| Contacts | Contacts | Represents key individuals or business connections relevant to sales and customer relations. |
| Amount | Deals | Tracks potential or actual revenue linked to a sales deal for better forecasting. |
| Deals | Deals | Monitors and manages sales opportunities throughout the pipeline. |
| Won Amount | Deals | Displays the total revenue generated from successfully closed deals. |
| Won Deals | Deals | Indicates the number of deals that reached the “Closed Won” stage, showing success rate. |
| Win Rate | Deals | Evaluates overall sales performance by comparing won deals against total deals. |
| Lost Amount | Deals | Identifies potential revenue lost to understand where deals fail. |
| Expected Revenue | Deals | Provides estimated future income from ongoing or potential deals. |
| Probability | Deals | Indicates the likelihood of closing a specific deal, helping with sales forecasting. |
| Tasks | Tasks | Helps track assigned and pending activities for better time and workflow management. |
| Meetings | Events | Shows how many meetings are scheduled or completed to maintain client engagement. |
| Calls | Calls | Tracks the number of calls made or received for sales follow-ups or customer service. |
| Campaigns | Campaigns | Helps manage and evaluate marketing initiatives promoting products or services. |
| Actual Cost | Campaigns | Monitors actual expenses incurred in running marketing campaigns. |
| Budgeted Cost | Campaigns | Tracks planned campaign budgets to compare against actual spending. |
| Expected Revenue | Campaigns | Estimates potential financial return from campaign activities. |
| Expected Response | Campaigns | Measures anticipated audience engagement or participation in a campaign. |
| Num Sent | Campaigns | Indicates the number of recipients targeted in a marketing campaign. |
🔗 Zoho CRM Dimensions
The table below lists the Zoho CRM Dimensions available through the Whatsdash Zoho CRM Integration.
| Name | Category | Why it’s useful |
|---|---|---|
| Lead Source | Leads | Helps identify where your leads originate from (e.g., ads, referrals, or organic), improving marketing attribution. |
| Lead Status | Leads | Tracks the current stage of a lead in the sales funnel for better pipeline management. |
| Rating | Leads | Allows sales teams to prioritize leads based on quality or potential value. |
| Stage | Deals | Helps monitor progress through different sales stages and identify conversion bottlenecks. |
| Type | Deals | Categorizes deals by type (e.g., new business, renewal) for more accurate reporting. |
| Priority | Tasks | Assists in managing workload by defining the urgency or importance of each task. |
| Status | Tasks | Indicates whether a task is pending, in progress, or completed for workflow tracking. |
| Call Type | Calls | Differentiates between call categories like outbound, inbound, or follow-up. |
| Call Purpose | Calls | Helps track the intent behind a call (e.g., sales, support, follow-up). |
| Call Result | Calls | Captures the outcome of each call to evaluate call effectiveness and next steps. |
🔗 Explore More Integrations
Whatsdash supports a wide range of marketing, analytics, and eCommerce integrations to give you a holistic view of your business performance.
👉 Visit the Integrations Page to explore all available connections
Keyword.com
Keyword.com is a powerful SEO rank tracking and monitoring software that provides accurate, real-time data on your keyword positions, search trends, and competitor analysis. It is designed to help SEO professionals, agencies, and in-house marketing teams optimize their content and drive organic growth.
Why Connect Keyword.com to Whatsdash?
Integrating your Keyword.com data with Whatsdash transforms raw rank tracking data into clear, understandable SEO performance reports for clients and stakeholders, empowering you to optimize your SEO and content strategies.
-
Real-Time Performance Tracking: Get up-to-the-minute updates on keyword rankings, SERP features, and overall search visibility.
-
Simplified Reporting & Dashboards: Consolidate your Keyword.com statistics into a single, understandable dashboard using pre-built templates, eliminating the need to manually navigate and export data.
-
Marketing Strategy Optimization: Blending keyword rank data with analytics (like GA4) and sales data provides a holistic view, helping you refine your SEO strategy to drive targeted traffic and improve conversions.
-
Customizable Insights: Leverage a wide range of available Metrics and dimensions to create custom widgets, and reports focused on the KPIs that matter most to your business.
📋 Steps to Integrate your Keyword.com account to Whatsdash
- Obtain Your API Token from Keyword.com:
-
Log into your Keyword.com account.
-
Navigate to your account settings or API key page.

- Copy your unique API Token.
- Connect in Whatsdash:
Navigate to the 'Integrations' page using the Navigation bar .
Select Keyword.com from the Available Integrations.
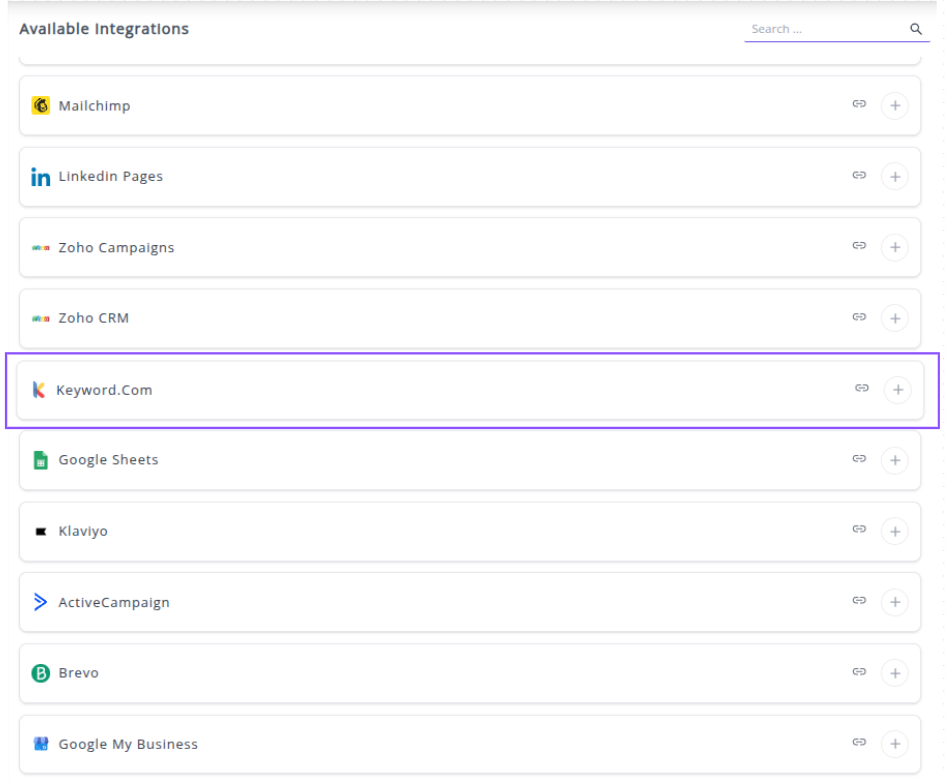
Click the + button to open the connection window.
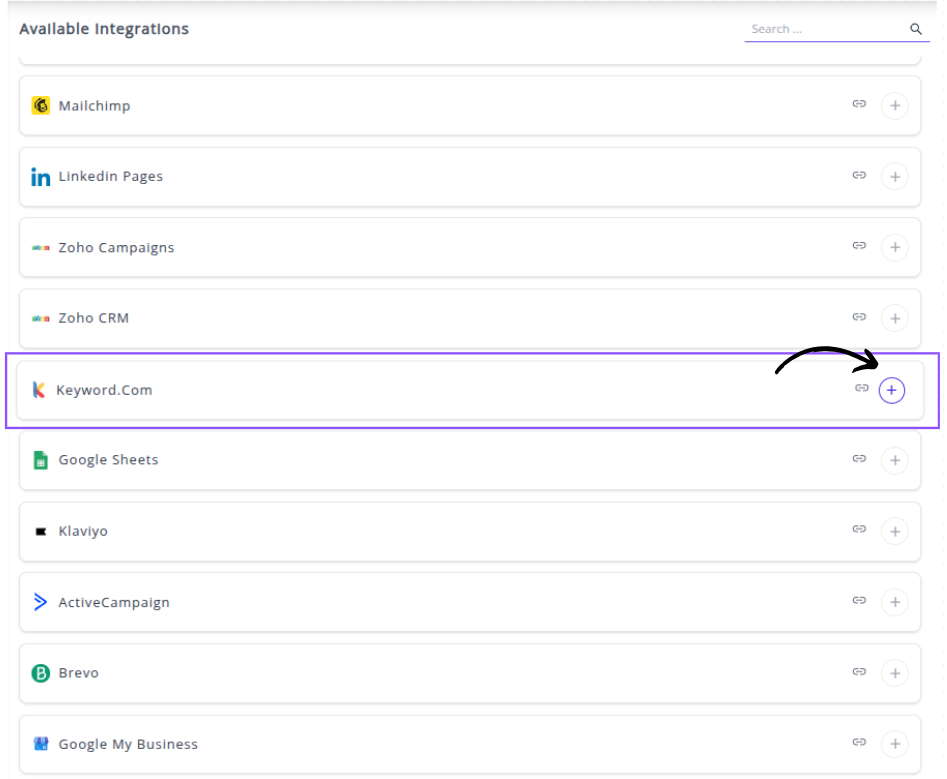
In the pop-up window:
Paste the API Token you copied from Keyword.com.
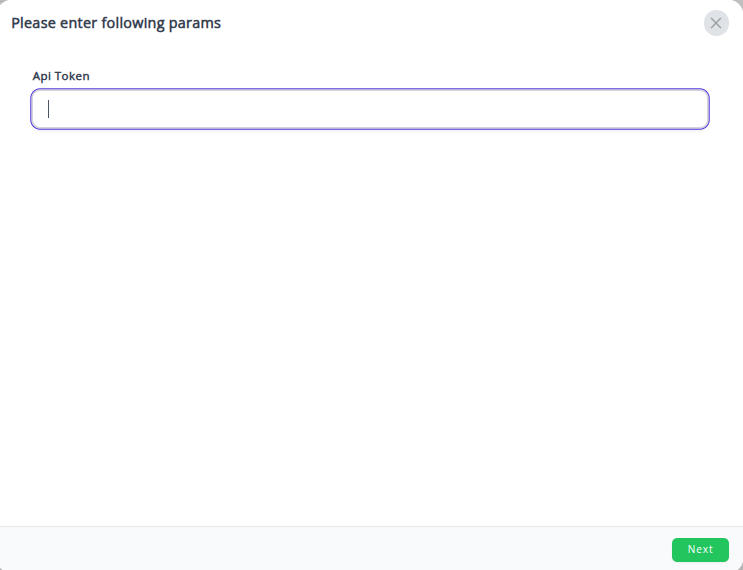
Click Next.
- Completion:
Once authenticated, your Keyword.com Integration will appear in the Connected Integrations list.
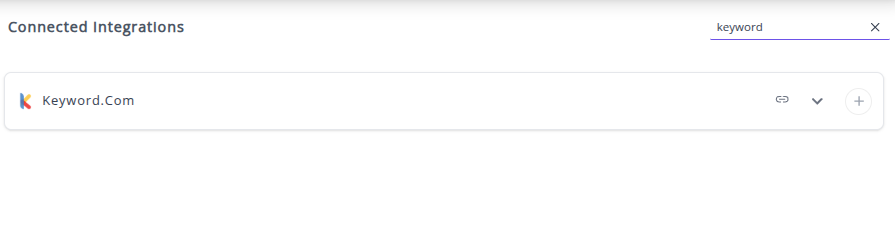
You can now create or customize dashboards using your Keyword.com Metrics and Dimensions.
👉 How to visualize this data in your dashboard, visit the Dashboard Documentation Guide
🔗 Keyword.com Metrics
The table below lists the Keyword.com Metrics available through the Whatsdash Keyword.com Integration.
| Name | Category | Description | Why it’s Useful |
|---|---|---|---|
| Rank | Keyword Analytics | The ranking of the related page with a given keyword. | Helps track your page’s current position in search results. |
| Start Rank | Keyword Analytics | The ranking recorded for the related page when the given keyword was first added in. | Useful to measure ranking progress over time. |
| Clicks | Keyword Analytics | Average number of clicks (Google Search Console). | Indicates keyword effectiveness in driving traffic. |
| Impressions | Keyword Analytics | Impressions (Google Search Console). | Shows how often your site appears in search results. |
| CTR | Keyword Analytics | Click Through Rate (Google Ads). | Reveals how well your search listings convert impressions into clicks. |
| Monthly Search | Keyword Analytics | Monthly search volume. | Helps gauge keyword popularity and potential traffic. |
| Competition | Keyword Analytics | Competition metric (Google Ads). | Assesses keyword competitiveness for paid campaigns. |
| CPC | Keyword Analytics | Average cost per click in US Dollars (Google Ads). | Useful for budgeting paid ad campaigns efficiently. |
| Best Rank | Keyword Analytics | Best ranking position since start. | Shows the highest position achieved for a keyword, helping evaluate SEO success. |
🔗 Keyword.com Dimensions
The table below lists the Keyword.com Dimensions available through the Whatsdash Keyword.com Integration.
| Name | Category | Description | Why it’s Useful |
|---|---|---|---|
| Keyword | Keyword Analytics | The words tracked in your keywords list. | Helps identify and analyze targeted search terms driving traffic. |
| URL | Keyword Analytics | The complete URL associated with a given keyword. | Enables mapping keywords to landing pages to measure SEO effectiveness. |
🔗 Explore More Integrations
Whatsdash supports a wide range of marketing, analytics, and eCommerce integrations to give you a holistic view of your business performance.
👉 Visit the Integrations Page to explore all available connections
Google Sheets
Google Sheets is a versatile, cloud-based spreadsheet application that allows users to create, edit, organize, and analyze data online for data management, calculation, analysis, and real-time collaboration.
Why Connect Google Sheets to Whatsdash?
Integrating your Google Sheets data with Whatsdash transforms raw spreadsheet data into clear, actionable business insights for all users.This is essential for centralizing data that might live outside of dedicated marketing or sales platforms, such as manual sales logs, custom budget trackers, or compiled data sets.
-
Centralize your Custom Data: Easily bring in essential business data that isn't captured by automated connectors.
-
Dynamic Reporting & Dashboards: Automatically update your dashboards with the latest figures from your sheets, ensuring your reports are always current without manual copy-pasting.
-
Data Blending & Custom Metrics: Blend your spreadsheet data with data from your other connected sources to create comprehensive, cross-channel reports and unique custom metrics.
📋 Steps to Integrate your Google Sheets account to Whatsdash
✔️ Navigate to the 'Integrations' page using the Navigation bar .
✔️ Select Google Sheets from the Available Integrations.
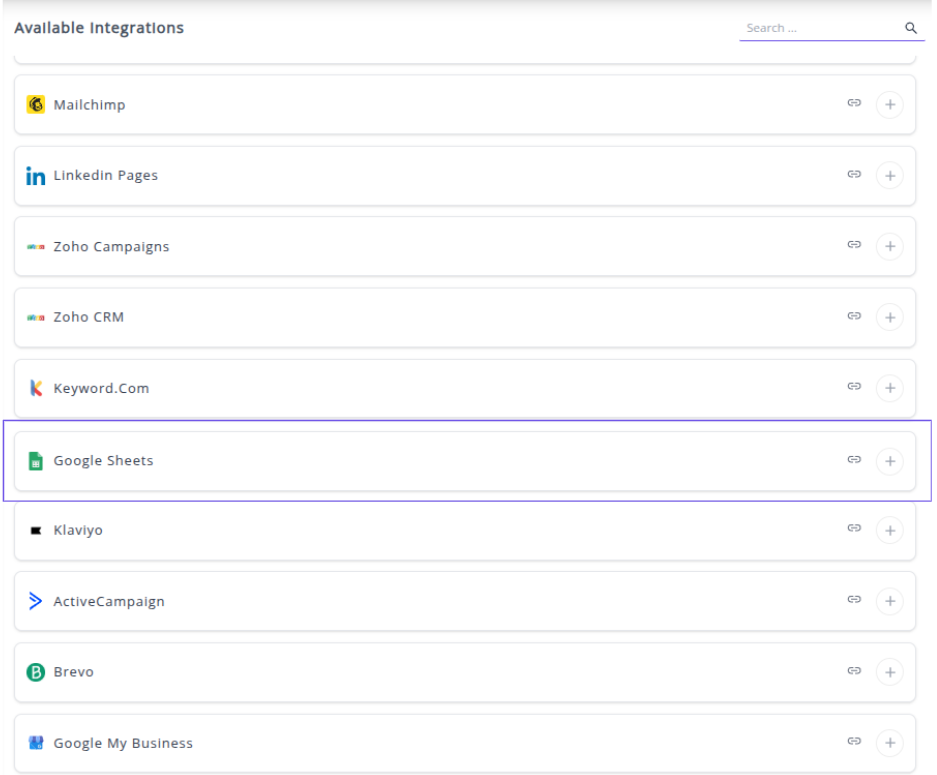
✔️ Click the + button to open the Google authorization window.
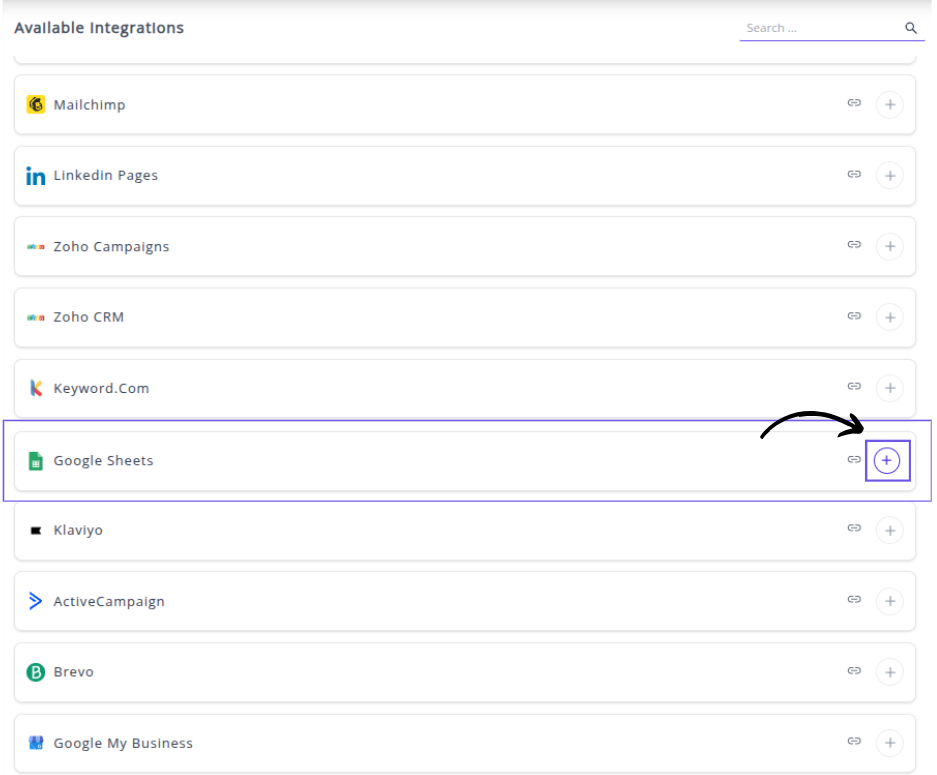
✔️ You will be redirected to a Google sign-in page. Select the Google account that has access to the spreadsheets you wish to use.
✔️ Grant Whatsdash the necessary permissions to Read your Google Drive spreadsheets.
✔️ Once authenticated, you will be directed back to Whatsdash. Your Google Sheets Integration will appear in the Connected Integrations list.
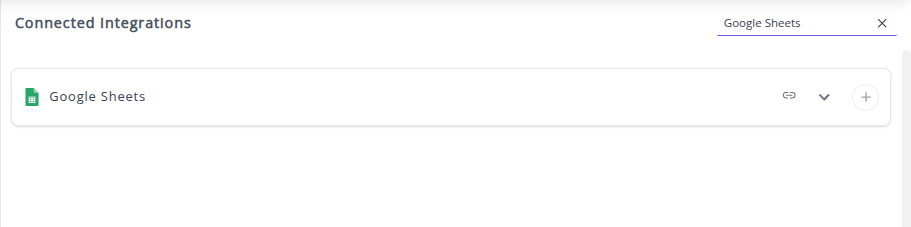
✔️ You can now select specific spreadsheets and sheets within them to use as data sources for creating or customizing your dashboards.
🔗 Explore More Integrations
Whatsdash supports a wide range of marketing, analytics, and eCommerce integrations to give you a holistic view of your business performance.
👉 Visit the Integrations Page to explore all available connections.
Klaviyo
Klaviyo is a powerful marketing automation and email platform focused on driving revenue through personalized customer experiences via email and SMS.
Why Connect Klaviyo to Whatsdash?
Connecting Klaviyo to Whatsdash allows you to pull detailed campaign, flow, and subscriber data directly into your central dashboard for advanced reporting and analysis alongside your e-commerce and ad spend metrics.
-
Unified E-commerce View: See how your Klaviyo flows and campaigns are directly driving sales, blending this data with your platform (like Shopify or WooCommerce) and ad spend data for a true view of marketing profitability.
-
Engagement & Health Monitoring: Instantly track the health of your subscriber lists, monitor key Metrics like Open Rate and Click-Through Rate, and evaluate the performance of your automated flows .
-
Custom Segmentation Reports: Create custom dashboards that visualize Klaviyo performance segmented by region, product category, or campaign type, offering granular insights not easily available within the Klaviyo interface alone.
📋 Steps to Integrate your Klaviyo account to Whatsdash
✔️ Navigate to the 'Integrations' page using the Navigation bar.
✔️ Select Klaviyo from the Available Integrations.
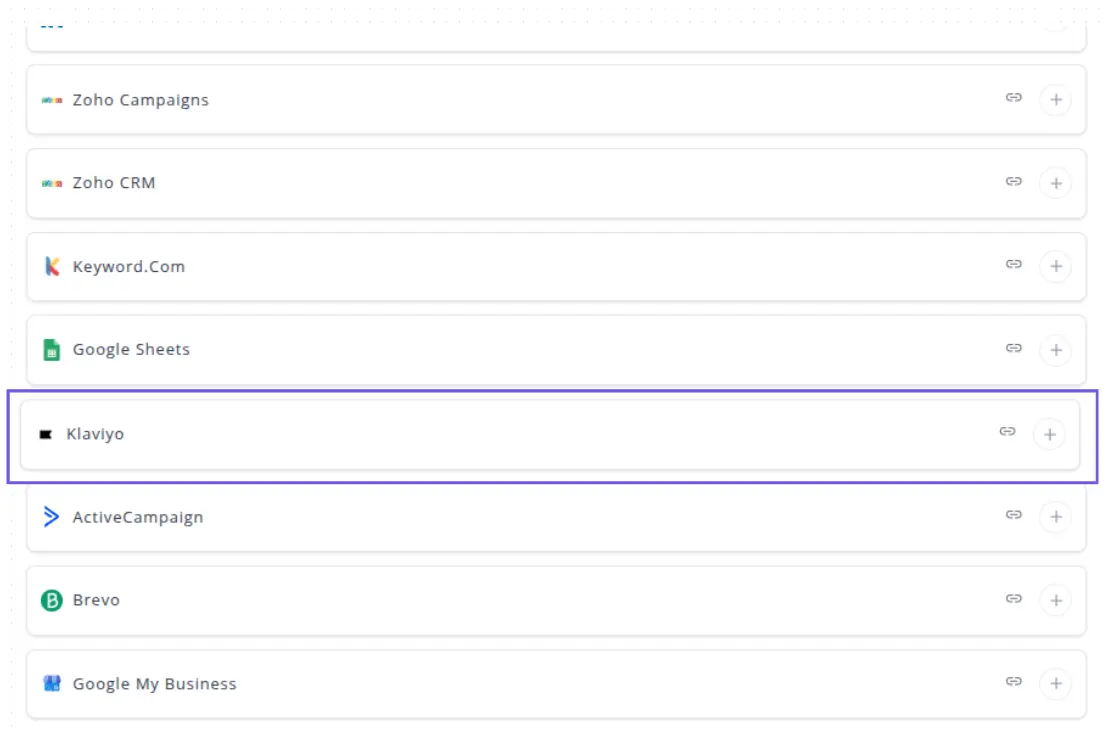
✔️ Click the + button to open the Klaviyo sign-in Page window.

✔️ You will be prompted to Klaviyo Sign-in Page.

⚠️ Note: Your Private API Key should be a full-access or designated "Read-Only" key to ensure Whatsdash can pull all necessary data. You can generate these keys in your Klaviyo account settings under API Keys.
✔️ Once authenticated, you will be directed back to Whatsdash. Your Klaviyo Integration will appear in the Connected Integrations list.
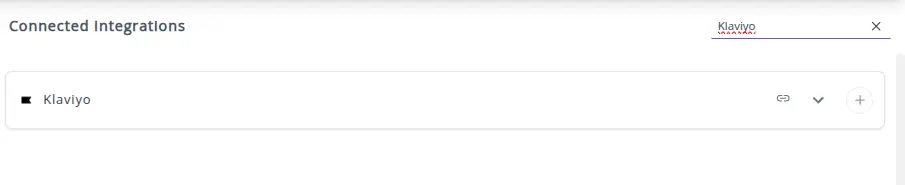
✔️ You can now create or customize dashboards using your Klaviyo marketing Metrics and Dimensions.
👉 How to visualize this data in your dashboard, visit the Dashboard Documentation Guide
🔗 Klaviyo Metrics
The table below lists the Klaviyo Metrics available through the Whatsdash Klaviyo Integration.
| Name | Category | Why It’s Useful |
|---|---|---|
| Bounced Email | Identifies failed deliveries to help maintain a clean and verified email list. | |
| Bounce Rate | Indicates overall deliverability performance and sender reputation. | |
| Clicked Email | Measures engagement and helps assess which campaigns drive interaction. | |
| Dropped Email | Detects invalid or risky addresses to improve list hygiene and compliance. | |
| Spam Email | Highlights content or frequency issues causing negative engagement. | |
| Open Rate | Shows how many recipients are opening your emails, signaling subject line effectiveness. | |
| Opened Email | Tracks total email engagement activity for content optimization. | |
| Opened Email (unique) | Measures unique opens to evaluate reach across different subscribers. | |
| Received Email | Confirms successful delivery to inboxes for monitoring send success. | |
| Unsubscribed Email | Tracks loss of subscribers and signals potential fatigue or misalignment. | |
| Cancelled Order Value | Revenue | Reveals potential revenue loss from canceled orders. |
| Cancelled Order | Revenue | Tracks frequency of cancellations to identify checkout or fulfillment issues. |
| Started Checkout | Revenue | Measures intent and helps identify drop-offs in the purchase funnel. |
| Started Checkout Value | Revenue | Quantifies value of checkout initiations to assess potential revenue. |
| Fulfilled Order | Revenue | Tracks successful order completions and fulfillment efficiency. |
| Fulfilled Order Value | Revenue | Indicates actual realized revenue from shipped orders. |
| Ordered Product | Revenue | Measures the total volume of products sold for inventory insights. |
| Ordered Products Value | Revenue | Tracks total product revenue excluding discounts or shipping. |
| Placed Order | Revenue | Shows confirmed transactions, reflecting customer purchase activity. |
| Placed Order Value | Revenue | Helps monitor total order value trends for revenue growth analysis. |
| Refunded Order | Revenue | Tracks the number of refunds to identify product or service issues. |
| Refunded Order Value | Revenue | Indicates monetary loss from returned or refunded purchases. |
| Added to Cart | Revenue | Measures product interest and intent-to-purchase trends. |
| Clicked SMS | SMS | Tracks engagement with SMS links to evaluate message effectiveness. |
| Sent SMS | SMS | Shows SMS campaign volume for delivery performance monitoring. |
| Unsubscribed SMS | SMS | Tracks opt-outs to identify audience fatigue or poor targeting. |
| Failed to Deliver SMS | SMS | Detects SMS delivery issues to optimize contact accuracy. |
| Received SMS | SMS | Confirms successful SMS deliveries to monitor reach and reliability. |
🔗 Klaviyo Dimensions
The table below lists the Klaviyo Dimensions available through the Whatsdash Klaviyo Integration.
| Name | Category | Why It’s Useful |
|---|---|---|
| Campaign Name | Campaign | Helps identify which campaign a message belongs to for performance tracking. |
| Email Domain | Useful for understanding sending sources and managing domain reputation. | |
| Email Subject | Critical for analyzing open rates and identifying effective subject lines. | |
| Flow | Flow | Enables automation tracking to measure engagement and conversion performance of flows. |
| Client Name | Client | Helps link performance and data back to a specific client in multi-account setups. |
| Client Type | Client | Classifies customer acquisition channels for segmentation and targeting. |
| From Number | SMS | Identifies the sender number to ensure message deliverability and compliance. |
| From Phone Region | SMS | Indicates the sender’s region, useful for localization and regional compliance. |
| Message Name | Message | Distinguishes messages within campaigns for granular performance insights. |
| Message Type | Message | Categorizes messages (e.g., promotional, transactional) for reporting clarity. |
| To Number | Message | Identifies the recipient’s phone number for troubleshooting or delivery tracking. |
| To Phone Region | Message | Helps track geographic trends and optimize SMS campaigns by region. |
| URL | URL | Tracks which links were clicked to analyze traffic sources and conversion impact. |
🔗 Explore More Integrations
Whatsdash supports a wide range of marketing, analytics, and eCommerce integrations to give you a holistic view of your business performance.
👉 Visit the Integrations Page to explore all available connections
ActiveCampaign
ActiveCampaign is a customer experience automation platform that provides email marketing, marketing automation, and CRM tools to help businesses connect and engage with their customers.
Why Connect ActiveCampaign to Whatsdash?
Connecting ActiveCampaign to Whatsdash allows you to pull detailed campaign performance, automation flow results, and lead data directly into your central dashboard for holistic reporting and analysis alongside your website analytics and sales metrics.
-
Marketing ROI at a Glance: Centralize your email/automation Metrics with your ad spend and revenue data to accurately measure the return on investment of your email marketing efforts.
-
Monitor Automation Health: Track the success of your most critical automations using visual dashboards, ensuring your customer journeys are converting efficiently.
-
Lead Funnel Visualization: Combine ActiveCampaign's lead status and scoring data with other sources to visualize the entire lead-to-customer journey in one place.
.
📋 Steps to Integrate your ActiveCampaign account to Whatsdash
✔️ Navigate to the 'Integrations' page using the Navigation bar.
✔️ Select ActiveCampaign from Available Integrations.
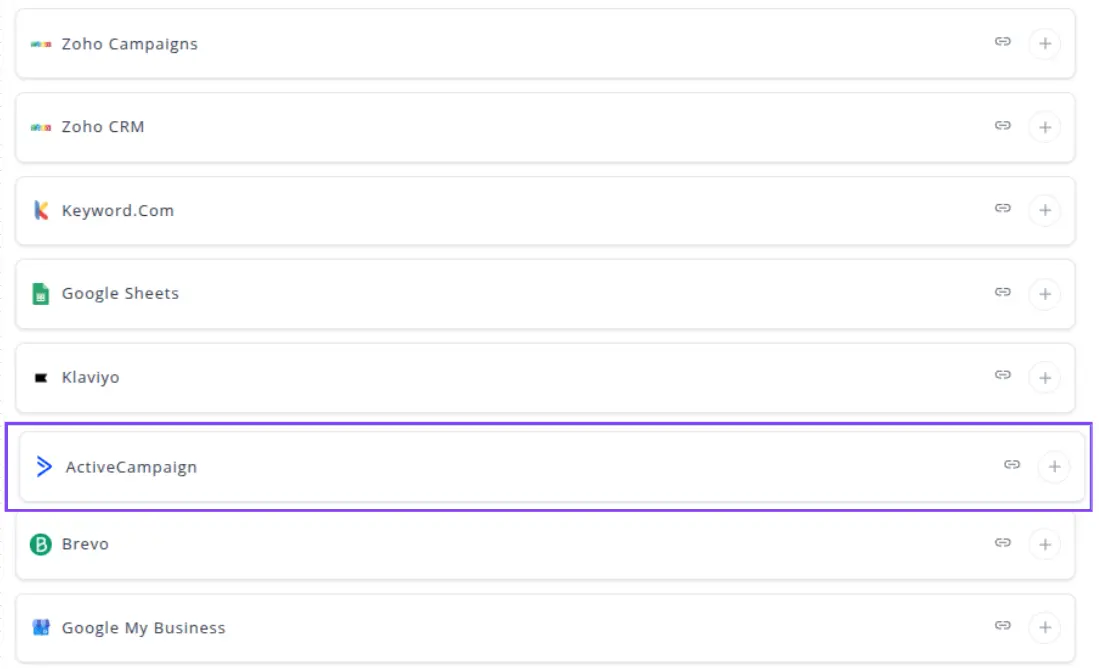
✔️ Click the + button to open the ActiveCampaign connection setup window.
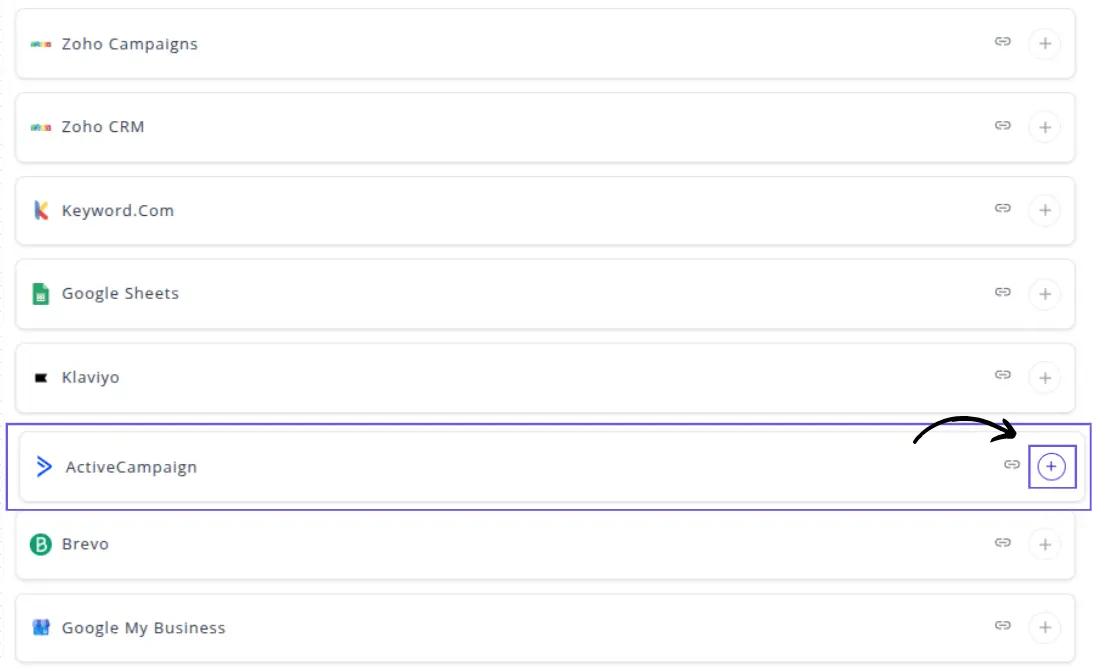
✔️ You will be prompted to enter your API URL and API Key from your ActiveCampaign account.
✔️ Enter the required API URL and API Key and click Next button.

⚠️ Note: You can find both your API URL and API Key in your ActiveCampaign account under Settings → Developer. Ensure the key is accurate to grant Whatsdash the necessary read-access.
✔️ Once authenticated, you will be directed back to Whatsdash. Your ActiveCampaign Integration will appear in the Connected Integrations list.
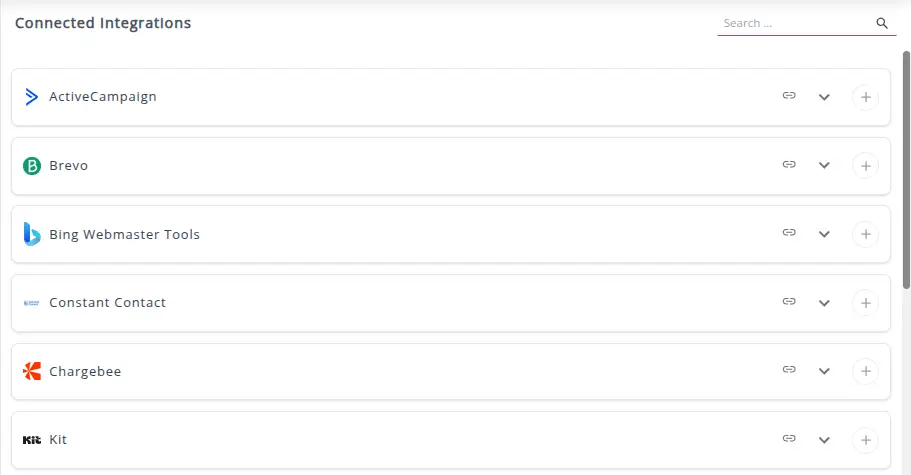 ✔️ You can now create or customize dashboards using your ActiveCampaign campaign, automation, and contact list metrics.
👉 How to visualize this data in your dashboard, visit the Dashboard Documentation Guide
🔗 ActiveCampaign Metrics
The table below lists the ActiveCampaign Metrics available through the Whatsdash ActiveCampaign Integration.
| Name | Category | Why It’s Useful |
|---|---|---|
| Bounces | Campaign | Tracks undelivered emails to identify delivery issues and maintain list hygiene. |
| Receipents | Campaign | Shows the total recipients reached, helping evaluate campaign reach. |
| Clicks | Campaign | Measures engagement by counting link clicks within emails. |
| Opens | Campaign | Indicates the total email opens to gauge interest in content. |
| Unique Opens | Campaign | Tracks unique recipients who opened the email, avoiding duplicate counting. |
| Verified Unique Opens | Campaign | Provides confirmed open counts for better engagement accuracy. |
| Shares | Campaign | Measures social amplification of emails for extended reach. |
| Subscribers | List | Shows total subscribers, helping assess list size and growth. |
| Unique Clicks | Campaign | Measures unique recipient clicks for accurate engagement insights. |
| Click Rate | Campaign | Shows percentage of recipients who clicked links, helping evaluate content effectiveness. |
| Forwards | Campaign | Tracks how often emails are forwarded, showing content shareability. |
| Open Rate | Campaign | Indicates email effectiveness by percentage of recipients opening emails. |
| List | Identifies if Facebook integration is enabled for sharing. | |
| Count | Campaign | General total count, useful for summarizing activity. |
| Email Sent | Campaign | Tracks total emails sent, providing context for other metrics. |
| Bounce Rate | Campaign | Monitors email deliverability percentage to maintain list quality. |
| Subscriber Clicks | Campaign | Measures total clicks including multiple clicks by same recipient, helpful for engagement intensity. |
| Unique Forwards | Campaign | Tracks forwards by unique recipients, indicating viral content spread. |
| Verified Opens | Campaign | Confirms email opens for accurate engagement tracking. |
| Replies | Campaign | Counts recipient replies, helping evaluate two-way engagement. |
| Unique Replies | Campaign | Measures distinct recipient replies for better insights. |
| Unsubscribes | Campaign | Tracks unsubscribed recipients to monitor content relevance. |
| Unsubscribe Rate | Campaign | Shows the percentage of unsubscribes to identify potential content issues. |
| Trackign | List | Indicates if tracking is enabled, important for accurate performance measurement. |
| List | Shows whether Twitter sharing is enabled for extended campaign reach. |
🔗 ActiveCampaign Dimensions
The table below lists the ActiveCampaign Dimensions available through the Whatsdash ActiveCampaign Integration.
| Name | Category | Why It’s Useful |
|---|---|---|
| List name | List | Identifies the email list, helping organize subscribers and track engagement by list. |
| Bounce Type | Campaign | Indicates type of email bounces (hard/soft), useful for improving deliverability. |
| Activity | Campaign | Shows campaign activity, helping assess performance trends and engagement. |
| Campaign Name | Campaign | Unique identifier for campaigns, allowing tracking and reporting of results. |
| Responses | Campaign | Measures recipient responses, indicating engagement and interest. |
| Emails | Campaign | Tracks customer emails included in campaigns, useful for segmentation analysis. |
| Action | Campaign | Summarizes campaign actions, helping understand overall recipient interactions. |
🔗 Explore More Integrations
Whatsdash supports a wide range of marketing, analytics, and eCommerce integrations to give you a holistic view of your business performance.
👉 Visit the Integrations Page to explore all available connections
Brevo
Brevo is a comprehensive digital marketing platform that offers marketing automation, email campaigns, transactional email, SMS, and chat services to manage customer relationships and drive sales.
Why Connect Brevo to Whatsdash?
Integrate your Brevo data with Whatsdash to centralize your email campaign performance, automation statistics, and subscriber data directly into your dashboard, giving you a clear view of how your email and SMS efforts impact your overall business goals.
-
Cross-Channel Performance Review: Combine Brevo metrics with GA4 user behavior and sales data to understand the true effectiveness and ROI of your marketing messages.
-
Automation & Transactional Health: Monitor the deliverability and engagement of both your scheduled marketing campaigns and your critical transactional emails in a single dashboard view.
-
Subscriber Growth & List Health: Easily track changes in your contact list size, segmentation performance, and engagement over time to maintain list hygiene and measure audience growth.
📋 Steps to Integrate your Brevo account to Whatsdash
✔️ Navigate to the 'Integrations' page using the navigation bar .
✔️ Select Brevo from Available Integrations.
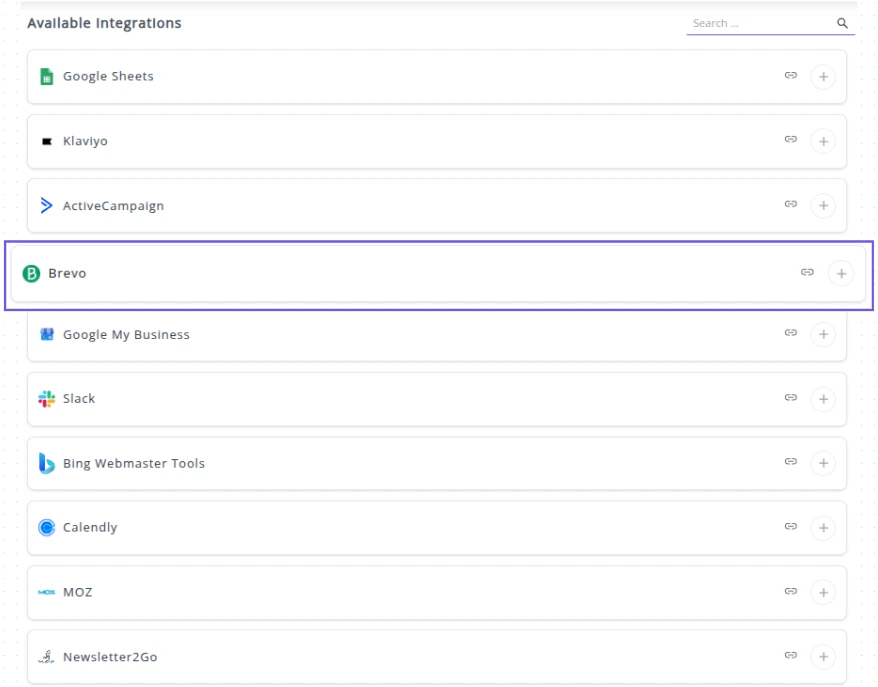 ✔️ Click the **+** button to open the Brevo connection setup window.
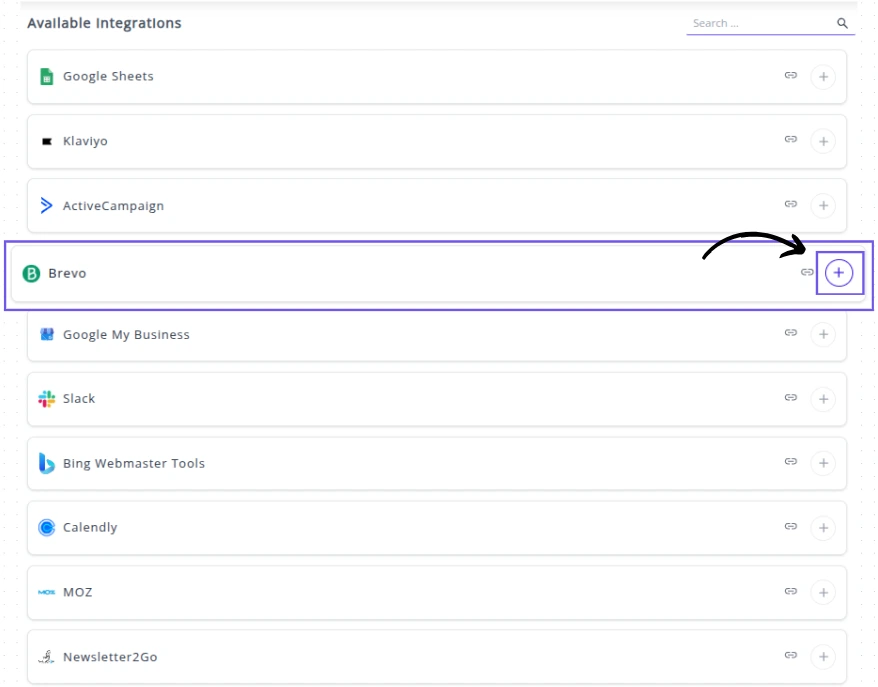
✔️ You will be prompted to enter your Brevo API Key.
✔️ Enter the required API Key and click Next button.
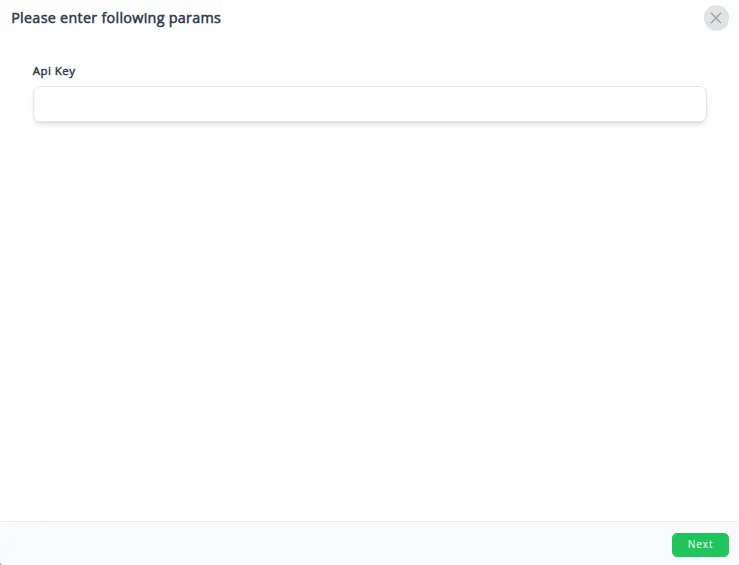
⚠️ Note: Your API Key grants Whatsdash access to read your campaign and contact data. You can find this key in your Brevo account under SMTP & API (usually located in your profile/settings dropdown). You will need to use a v3 API Key.
✔️ Once authenticated, you will be directed back to Whatsdash. Your Brevo Integration will appear in the Connected Integrations list.
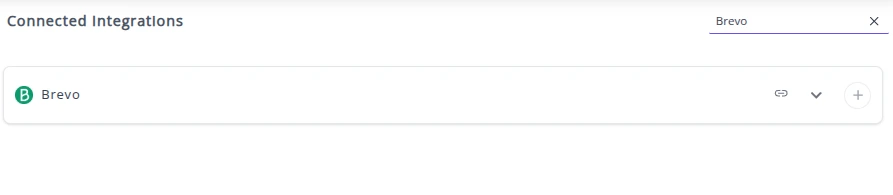 ✔️ You can now create or customize dashboards using your Brevo campaign, transactional, and contact metrics.
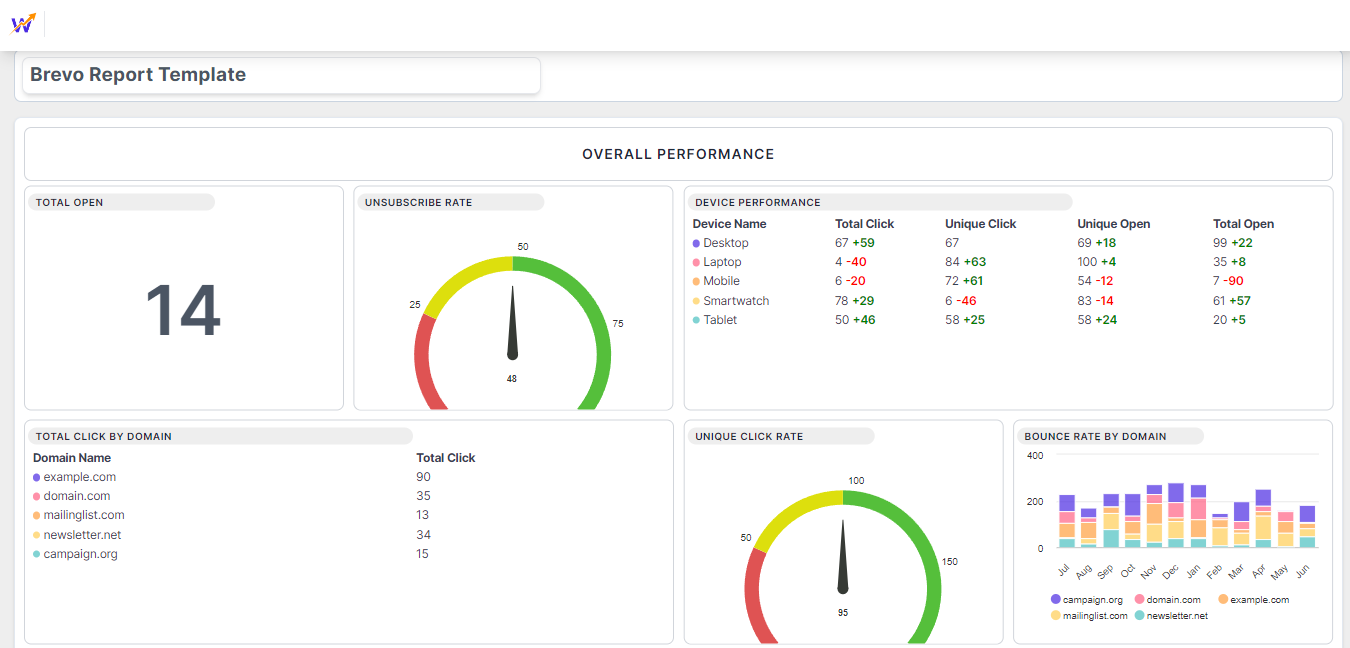
👉 How to visualize this data in your dashboard, visit the Dashboard Documentation Guide
🔗 Brevo Metrics
The table below lists the Brevo Metrics available through the Whatsdash Brevo Integration.
| Name | Category | Why It’s Useful |
|---|---|---|
| Unique Click Rate | Shows engagement by tracking the percentage of recipients who clicked links, helping evaluate content effectiveness. | |
| Unsubscribe Rate | Indicates list health and recipient satisfaction; high rates signal content or targeting issues. | |
| Sent | Tracks total contacts sent to, providing context for open/click rates and campaign reach. | |
| Unsubscribe | The raw number of unsubscribes, useful for monitoring audience retention. | |
| Bounce Rate | Measures deliverability issues; high bounce rate can affect sender reputation. | |
| Soft Bounced Email | Indicates temporary delivery issues, helping you diagnose server or mailbox problems. | |
| Unique Click | Tracks total recipients who clicked links, useful for measuring content interest. | |
| Total Open | Measures total opens, helping evaluate overall engagement with email content. | |
| Total Click | Counts all clicks, showing overall interaction with email links. | |
| Complaints | Tracks spam reports; essential for maintaining sender reputation and compliance. | |
| Unique Open | Measures how many recipients opened the email at least once, showing engagement breadth. | |
| Estimate Open | Provides an estimated total opens, useful for gauging approximate audience interaction. | |
| Hard Bounced Email | Identifies permanent delivery failures, helping maintain a clean and healthy email list. | |
| Delivered | Shows the number of contacts who actually received emails, critical for accurate performance analysis. | |
| Open Rate | Indicates the percentage of recipients who opened emails, a key metric for engagement. |
🔗 Brevo Dimensions
The table below lists the Brevo Dimensions available through the Whatsdash Brevo Integration.
| Name | Category | Why It’s Useful |
|---|---|---|
| Domain Name | Domain | Identifies the sending domain, useful for tracking deliverability and sender reputation. |
| Device Name | Device | Tracks the device used to open the email, helping optimize emails for mobile vs desktop. |
| Browser Name | Browser | Shows which browsers recipients use, allowing better testing and rendering optimization. |
| Campaign Name | Campaign | Indicates the campaign associated with the email, useful for performance tracking and comparison. |
🔗 Explore More Integrations
Whatsdash supports a wide range of marketing, analytics, and eCommerce integrations to give you a holistic view of your business performance.
👉 Visit the Integrations Page to explore all available connections
Google My Business
Google My Business is a free tool provided by Google that allows businesses to manage and optimize their online presence across Google Search and Google Maps.
Why Connect Google My Business to Whatsdash?
Integrate your Google My Business data with Whatsdash to centralize your local search performance, ensuring your local presence efforts are effectively driving traffic and customer interactions.
-
Monitor Local SEO Performance: See how often your business profile appears in Google Search and Maps and track the growth of your customer interactions.
-
Reputation Management: Track average review ratings, review volume, and new reviews directly in your dashboard, allowing for quick monitoring of your local reputation health.
-
Holistic Business Overview: Blend your Google My Business data with your website's GA4 Metrics and CRM sales data to understand the full customer journey, from local search discovery to final conversion.
📋 Steps to Integrate your Google My Business account to Whatsdash
✔️ Navigate to the 'Integrations' page using the Navigation bar.
✔️ Select Google My Business from the Available Integrations.
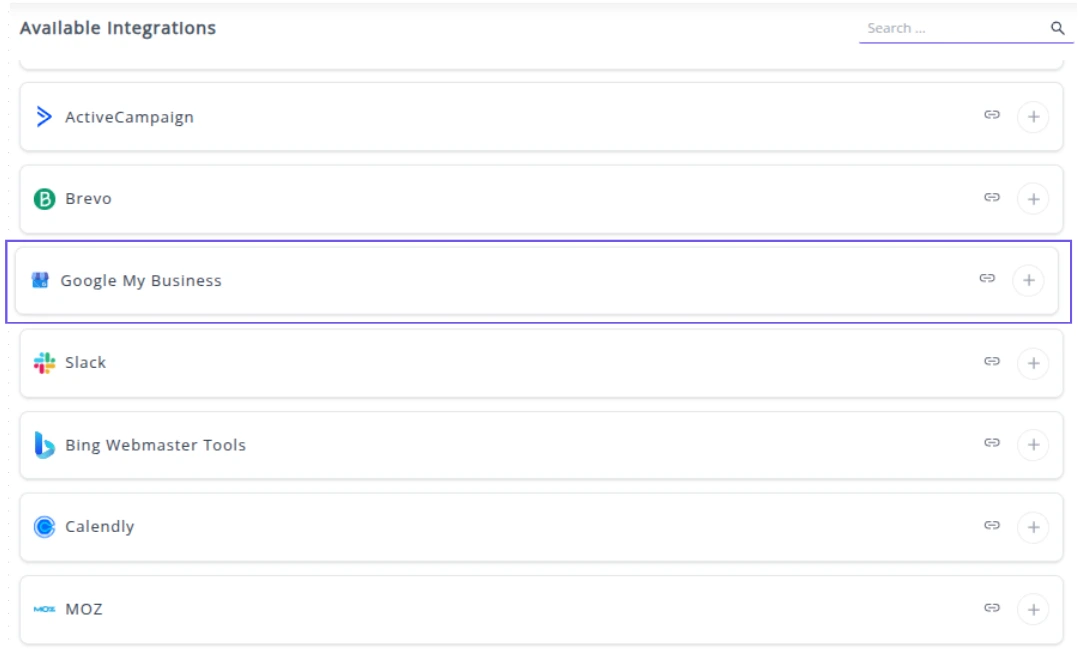
✔️ Click the + button to open the Google authorization window.

✔️ You will be redirected to a Google sign-in page. Select the Google account that is the Owner or Manager of your Google My Business profile(s).
✔️ Grant Whatsdash the necessary permissions to Read your Google My Business data.
✔️ Once authenticated, you will be directed back to Whatsdash. Your Google My Business Integration will appear in the Connected Integrations list.
✔️ You can now create or customize dashboards using your Google My Business Metrics and Dimensions.
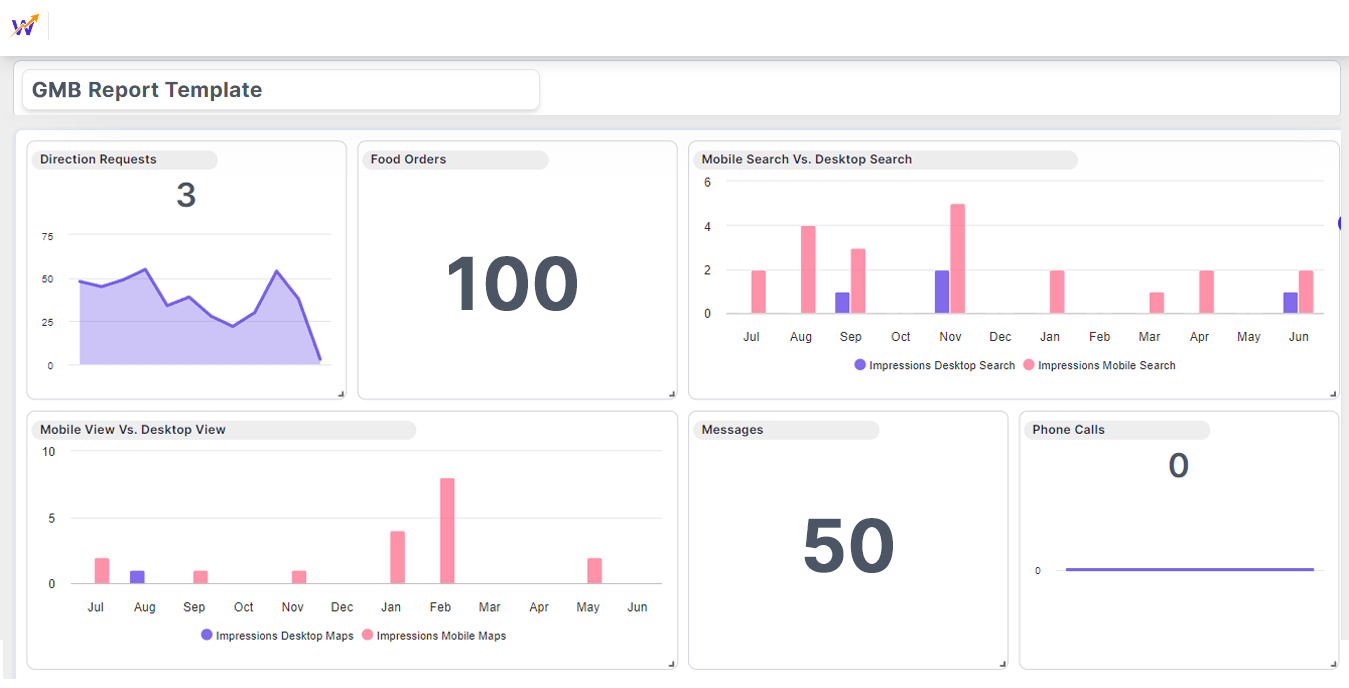
👉 How to visualize this data in your dashboard, visit the Dashboard Documentation Guide
🔗 Google My Business Metrics
The table below lists the Google My Business Metrics available through the Whatsdash Google My Business Integration.
| Name | Category | Why It’s Useful |
|---|---|---|
| Reviews Count | Reviews | Shows overall customer feedback volume, useful for reputation management. |
| Food Menu Clicks | Performance | Indicates interest in menu items, useful for tracking food-related engagement. |
| Call Clicks | Performance | Measures customer intent to call, helping gauge lead interest. |
| Food Orders | Performance | Tracks completed food orders from the profile, useful for revenue insights. |
| Impressions Mobile Search | Performance | Shows visibility on mobile search, helpful for mobile optimization. |
| Impressions Desktop Maps | Performance | Shows desktop map visibility, useful for assessing map reach. |
| Impressions Mobile Maps | Performance | Tracks mobile map visibility, useful for local mobile engagement. |
| Impressions Desktop Search | Performance | Shows desktop search visibility, helpful for overall profile performance. |
| Rating | Reviews | Reflects average customer satisfaction, useful for trust-building and monitoring. |
| Business Booking | Performance | Measures bookings made via Google, useful for conversion tracking. |
| Website Clicks | Performance | Indicates traffic driven to the website, useful for marketing ROI. |
| Business Direction Requests | Performance | Shows interest in visiting the location, useful for offline conversions. |
| Business Conversations | Performance | Tracks messaging interactions, useful for customer support and engagement. |
🔗 Google My Business Dimensions
The table below lists the Google My Business Dimensions available through the Whatsdash Google My Business Integration.
| Name | Why It’s Useful |
|---|---|
| Location Store Code | Helps uniquely identify and manage multiple business locations. |
| Labels | Useful for categorizing and filtering locations for analysis. |
| Location Address | Provides complete location information, essential for accurate mapping and local SEO. |
| Location Name | Helps identify and differentiate between multiple business locations. |
| Review | Tracks customer feedback for the location, useful for reputation management and service improvement. |
🔗 Explore More Integrations
Whatsdash supports a wide range of marketing, analytics, and eCommerce integrations to give you a holistic view of your business performance.
👉 Visit the Integrations Page to explore all available connections
Slack
Slack is a channel-based messaging platform that centralizes internal communication, workflows, and tools into a single environment, allowing teams to collaborate more effectively.
Connecting Slack to Whatsdash allows you to track team activity, measure channel engagement, and monitor the volume and type of conversations occurring, providing a unique view of operational effectiveness and internal marketing/support performance.
Why Connect Slack to Whatsdash?
Integrate your Slack data with Whatsdash to gain visibility into how your teams are collaborating and how external communication impacts your business.
-
Measure Internal Engagement: Track which channels are most active, which messages are getting the most responses, and understand the general flow of team communication.
-
Monitor Support/Lead Channels: If you use Slack for customer support or lead notifications, you can track the volume of incoming issues or leads over time, linking this internal activity to external metrics like ticket resolution time or lead conversion rate.
-
Identify Knowledge Gaps: Analyze the frequency of specific keywords or recurring questions to identify areas where new documentation or training is needed.
📋 Steps to Integrate your Slack account to Whatsdash
✔️ Navigate to the 'Integrations' page using the Navigation bar.
✔️ Select Slack from the Available Integrations.
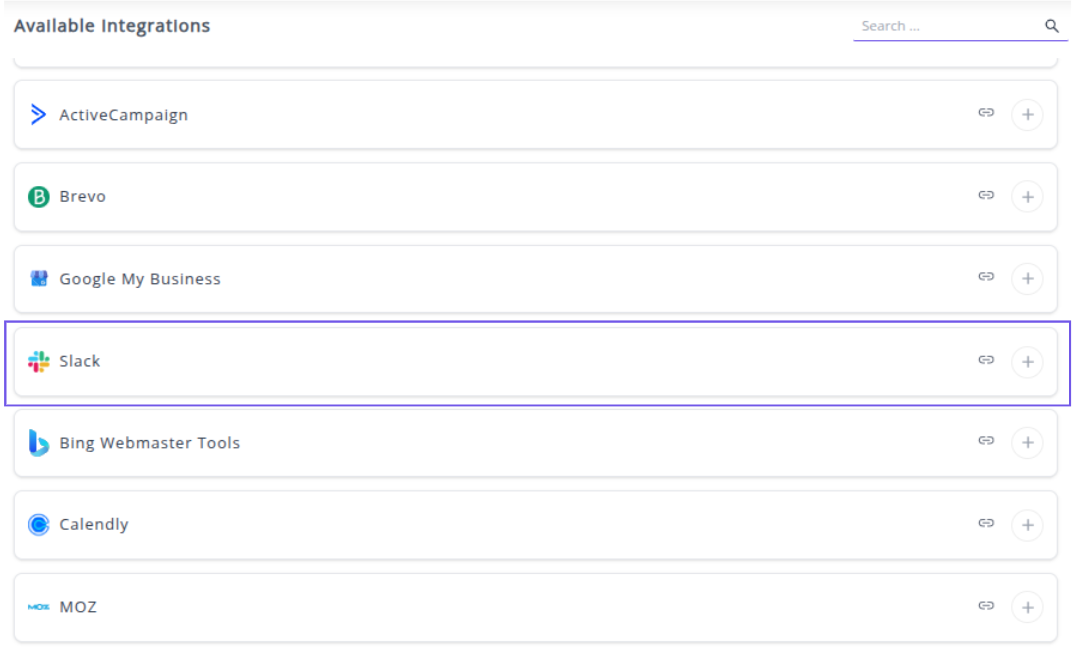
✔️ Click the + button to open the Slack authorization window.
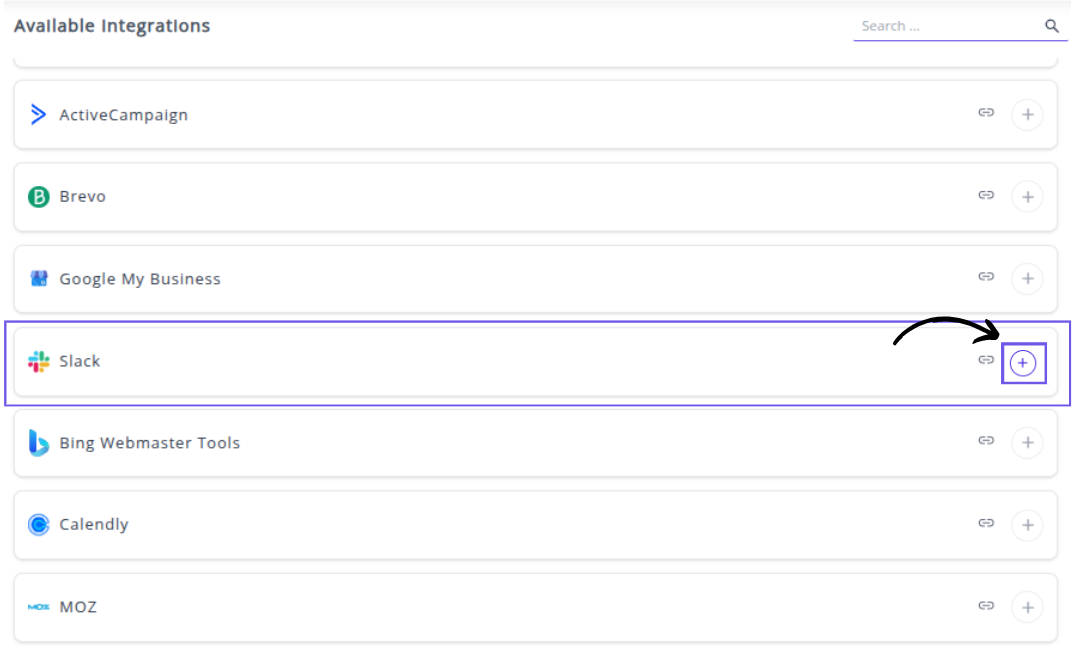
✔️ You will be redirected to the Slack authentication page. Select the Slack workspace you wish to connect to Whatsdash.
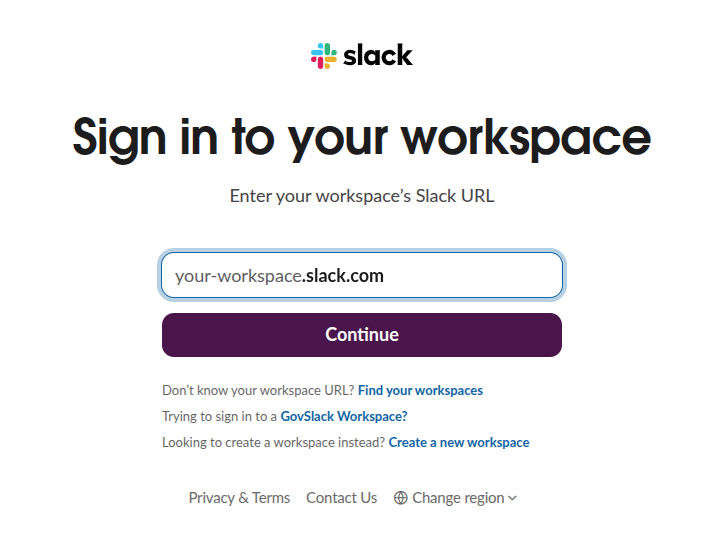
✔️ Once authenticated, you will be directed back to Whatsdash. Your Slack Integration will appear in the Connected Integrations list.
✔️ You can now create or customize dashboards using your Slack Metrics and Dimensions.
👉 How to visualize this data in your dashboard, visit the Dashboard Documentation Guide
🔗 Slack Metrics
The table below lists the Slack Metrics available through the Whatsdash Slack Integration.
| Name | Category | Why It’s Useful |
|---|---|---|
| User Count | Users | Shows total users in Slack, helping monitor workspace size and growth. |
| Channel Member Count | Channel | Indicates number of members in a channel, useful for engagement and access management. |
| Channel Count | Channel | Tracks total number of channels, useful for organizing workspace structure and managing active communication channels. |
🔗 Slack Dimensions
The table below lists the Slack Dimensions available through the Whatsdash Slack Integration.
| Name | Category | Why It’s Useful |
|---|---|---|
| User Name | Users | Identifies the user in Slack for communication tracking. |
| User Real Name | Users | Shows the actual name of the user for accurate identification. |
| User First Name | Users | Useful for personalization in messages or reports. |
| User Last Name | Users | Helps in sorting and referencing users accurately. |
| User ID | Users | Unique identifier for users, essential for API operations. |
| User Status | Users | Tracks availability or activity state of a user. |
| User Title | Users | Useful to understand user roles and responsibilities. |
| User Email | Users | Needed for notifications, integrations, and user contact. |
| Is Admin | Users | Identifies users with administrative privileges. |
| Is Owner | Users | Determines which users can manage the workspace. |
| Is Primary Owner | Users | Identifies the main owner responsible for the workspace. |
| Is Restricted | Users | Useful to manage limited-access users. |
| Is Ultra Restricted | Users | Indicates users with minimal permissions. |
| Is a Bot | Users | Helps differentiate between humans and bots in analytics. |
| Is Deleted | Users | Tracks inactive or removed users. |
| Timezone | Users | Useful for scheduling messages or meetings across regions. |
| Phone | Users | Optional contact for external communication. |
| Is Email Confirmed | Users | Verifies email authenticity for notifications. |
| 24px Image URL | Users | Small avatar for UI displays or lightweight lists. |
| 192px Image URL | Users | Medium avatar for detailed user interfaces. |
| 512px Image URL | Users | High-quality avatar for profiles or reports. |
| Channel Name | Channel | Identifies the Slack channel for messages or analytics. |
| Channel Topic | Channel | Helps understand the channel’s purpose or subject. |
| Channel Purpose | Channel | Provides context for communication or reporting. |
| Channel Created Date | Channel | Tracks channel age and activity history. |
| Channel Archived | Channel | Indicates inactive channels to manage workspace cleanliness. |
| Channel External Shared | Channel | Shows whether a channel is shared with external users. |
| Channel ID | Channel | Unique identifier for API operations and integrations. |
| Channel Previous Names | Channel | Tracks renames for historical reference and auditing. |
🔗 Explore More Integrations
Whatsdash supports a wide range of marketing, analytics, and eCommerce integrations to give you a holistic view of your business performance.
👉 Visit the Integrations Page to explore all available connections
Bing Webmaster Tools
Bing Webmaster Tools is a free service from Microsoft that helps website owners monitor, maintain, and troubleshoot their site's presence in the Bing search index.
Connecting Bing Webmaster Tools to Whatsdash allows you to pull key data on search performance, including search impressions, clicks, keywords, and crawling/indexing health. This is vital for ensuring your website is optimized for all major search engines and for cross-referencing performance against Google Search Console and GA4 data.
Why Connect Bing Webmaster Tools to Whatsdash?
Integrate your Bing Webmaster Tools data with Whatsdash enables you to verify your website is optimized for all major search engines.
-
Complete Search Visibility: Gain a holistic view of your organic traffic, ensuring you don't overlook potential audience segments from the Bing search engine, which powers platforms like Yahoo! and DuckDuckGo.
-
Keyword Performance Comparison: Compare ranking and click data for specific keywords on Bing versus Google (via Search Console data) to identify distinct opportunities and challenges on each platform.
📋 Steps to Integrate your Bing Webmaster Tools account to Whatsdash
✔️ Navigate to the 'Integrations' page using the Navigation bar.
✔️ Select Bing Webmaster Tools from the Available Integrations.

✔️ Click the + button to open the Microsoft authorization window.
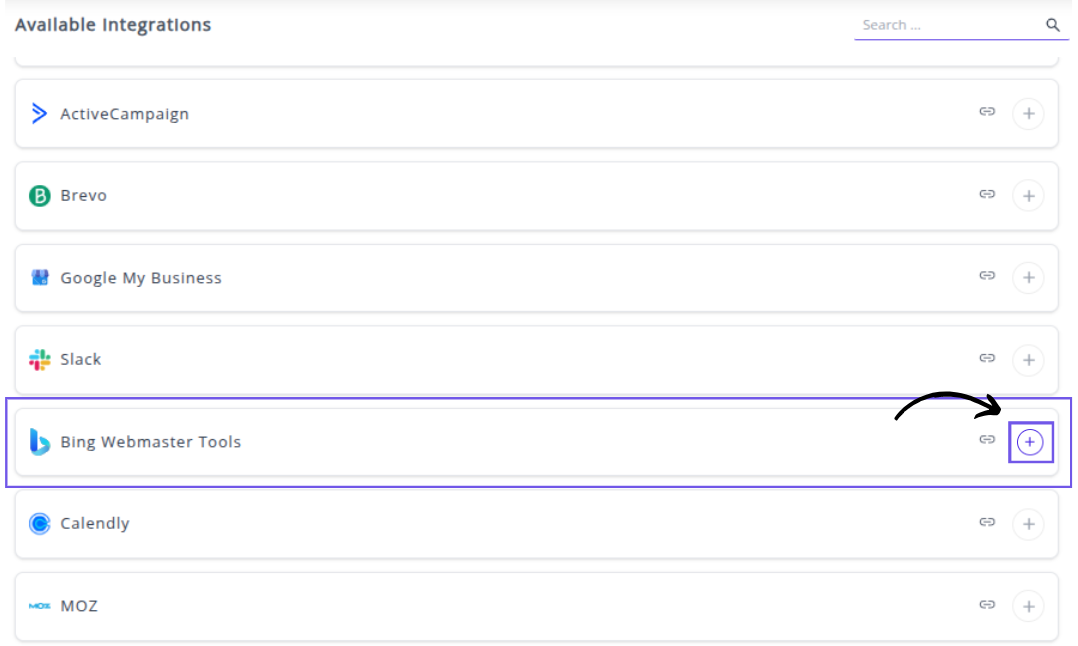
✔️ You will be redirected to a Microsoft sign-in page. Select or enter the account that has administrative access to your website's property within Bing Webmaster Tools.

✔️ Grant Whatsdash the necessary permissions to Read your Bing Webmaster Tools data.
✔️ Once authenticated, you will be directed back to Whatsdash. Your Bing Webmaster Tools Integration will appear in the Connected Integrations list.
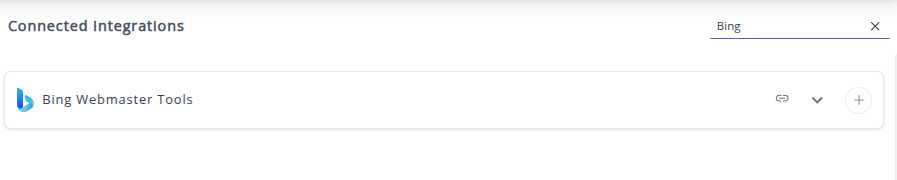
✔️ You can now create or customize dashboards using your Bing Webmaster Tools search performance and site health Metrics and Dimensions.
👉 How to visualize this data in your dashboard, visit the Dashboard Documentation Guide
🔗 Bing Webmaster Tools Metrics
The table below lists the Bing Webmaster Tools Metrics available through the Whatsdash Bing Webmaster Tools Integration.
| Name | Category | Why It’s Useful |
|---|---|---|
| Average Click Position | Rank And Traffic | Helps identify the average rank position where users click your site, showing how engaging your search results are. |
| Impressions | Rank And Traffic | Measures how often your site appears in search results, indicating visibility and reach. |
| Total URLs Discovered | Sitemaps | Tracks the total number of URLs Bing recognizes, useful for monitoring crawl coverage. |
| All Other Codes | CrawlStats | Highlights uncommon server response codes, helping identify unusual crawl behavior. |
| Blocked By Robots Txt | CrawlStats | Shows pages blocked from crawling, assisting in managing site accessibility. |
| Code2xx | CrawlStats | Indicates successful server responses — essential for verifying healthy pages. |
| Code301 | CrawlStats | Tracks permanent redirects, helping optimize link structure and SEO. |
| Code302 | CrawlStats | Tracks temporary redirects, helping ensure correct URL redirection practices. |
| Code4xx | CrawlStats | Captures client errors like 404s, helping fix broken or missing pages. |
| Crawl Errors | CrawlStats | Aggregates all crawl-related issues, crucial for maintaining crawl health. |
| Crawled Pages | CrawlStats | Shows how many pages Bingbot successfully crawled — vital for indexation monitoring. |
| DNS Failures | CrawlStats | Tracks DNS issues that prevent Bingbot from finding your site. |
| InIndex | CrawlStats | Displays how many pages are indexed, showing how much of your site is searchable. |
| InLinks | CrawlStats | Counts inbound links, important for understanding backlink strength. |
| Average Click Position for AllQuery | QueryStat | Indicates average ranking position for clicks from search queries, useful for SEO performance tracking. |
| Average Impression Position for AllQuery | QueryStat | Reveals how high your site appears for queries before clicks happen. |
| Clicks for AllQuery | QueryStat | Measures total clicks from Bing for specific search queries. |
| Impressions for AllQuery | QueryStat | Counts total times queries led to your site appearing in Bing results. |
| Average Click Position for AllPage | PageStat | Shows average user click position for your site pages in Bing. |
| Average Impression Position for AllPage | PageStat | Reveals the average visibility position for each page. |
| Clicks for AllPage | PageStat | Displays the total number of clicks per page, useful for tracking engagement. |
| Impressions for AllPage | PageStat | Tracks how many times each page appeared in search results. |
🔗 Bing Webmaster Tools Dimensions
The table below lists the Bing Webmaster Tools Dimensions available through the Whatsdash Bing Webmaster Tools Integration.
| Name | Why It’s Useful |
|---|---|
| Pages | Helps identify which pages attract the most visitors, supporting better content and SEO strategy. |
| Keywords | Reveals the top-performing search terms that drive traffic, allowing better keyword targeting and content planning. |
🔗 Explore More Integrations
Whatsdash supports a wide range of marketing, analytics, and eCommerce integrations to give you a holistic view of your business performance.
👉 Visit the Integrations Page to explore all available connections
Calendly
Calendly is an industry-leading scheduling automation platform that eliminates the administrative hassle of booking meetings, allowing sales, marketing, and customer success teams to connect with clients, prospects, and candidates effortlessly.
Why Connect Calendly to Whatsdash?
Integrating your Calendly data with Whatsdash transform your comprehensive data on your team's scheduling performance, making it easy to see how your scheduling strategy impacts the business., helping you optimize team efficiency and demonstrate the ROI of meeting volume.
-
Centralized Meeting Performance: Track all your team's scheduled, completed, and canceled meetings in a single, intuitive dashboard alongside CRM and sales metrics for complete funnel visibility.
-
Efficiency & Optimization Insights: Identify popular meeting times, high-performing event types, and top-booking team members to establish best practices and optimize team capacity.
-
Reduce No-Shows: Monitor meeting attendance rates and proactively adjust your scheduling strategy to ensure a higher percentage of booked meetings are completed.
📋 Steps to Integrate your Calendly Account to Whatsdash
✔️ Navigate to the 'Integrations' page using the Navigation bar.
✔️ Select Calendly from the Available Integrations.

✔️ Click + button to open the Calendly authorization window.

✔️ You will be redirected to a Calendly login page. Log in to the Calendly account that has admin or owner access to your organization's events.

✔️ Grant Whatsdash the necessary permissions to read and pull your scheduling data.
✔️ Once authenticated, you will be directed back to Whatsdash. Your Calendly Integration will appear in the Connected Integrations list.
✔️ You can now create or customize dashboards using your Calendly Metrics and Dimensions.
👉 How to visualize this data in your dashboard, visit the Dashboard Documentation Guide.
🔗 Calendly Metrics
The table below lists the Calendly Metrics available through the Whatsdash Calendly Integration.
| Name | Category | Why It’s Useful |
|---|---|---|
| Active | Scheduled Event | Shows how many invitees are still confirmed for an event — helps track engagement and attendance health. |
| Limit | Scheduled Event | Indicates the maximum number of bookings allowed — essential for managing event capacity. |
| Total | Scheduled Event | Displays the total number of invitees (including cancellations) — useful for measuring interest levels. |
| Duration | Event Types | Reflects the average session length — helps optimize event structure and scheduling efficiency. |
🔗 Calendly Dimensions
The table below lists the Calendly Dimensions available through the Whatsdash Calendly Integration.
| Name | Category | Why It’s Useful |
|---|---|---|
| Booking Method | Event Types | Identifies how an event is booked (poll or instant), useful for understanding user scheduling behavior. |
| Event Types Name | Event Types | Provides a human-readable name for event types, making it easier to analyze and categorize event performance. |
| Schduled Event Name | Scheduled Events | Displays the specific event name, helpful for tracking which events are most popular or frequently booked. |
| Kind | Event Types | Indicates whether the event is individual or group-based, essential for understanding event structure and capacity needs. |
| Scheduling Url | Event Types | Shows the booking page URL, allowing quick access and integration into promotional or analytics workflows. |
| Status | Scheduled Events | Reflects whether an event is active or canceled, key for maintaining up-to-date event tracking and performance metrics. |
🔗 Explore More Integrations
Whatsdash supports a wide range of marketing, analytics, and eCommerce integrations to give you a holistic view of your business performance.
👉 Visit the Integrations Page to explore all available connections
Moz
Moz is a comprehensive SEO platform providing a suite of tools for keyword research, site audits, competitive analysis, and link building to significantly boost your website's visibility and search rankings.
Why Connect Moz to Whatsdash?
Integrating your Moz account with Whatsdash streamlines your entire SEO reporting workflow, offering real-time insights into your search performance and competitive landscape.
-
Simplified SEO Reporting: Pull core SEO health Metrics like Domain Authority (DA) and Page Authority (PA) directly into customizable, easy-to-read dashboards.
-
Cross-Channel SEO Analysis: Blend Moz's proprietary SEO metrics with data from Google Analytics, Google Search Console, and your PPC campaigns for a single view of your organic and paid search performance.
-
Real-Time Performance Tracking: Monitor your keyword rankings, link metrics, and site audit progress in real time alongside your business goals.
📋 Steps to Integrate your Moz account to Whatsdash
✔️ Navigate to the 'Integrations' page using the Navigation bar.
✔️ Select Moz from the Available Integrations.
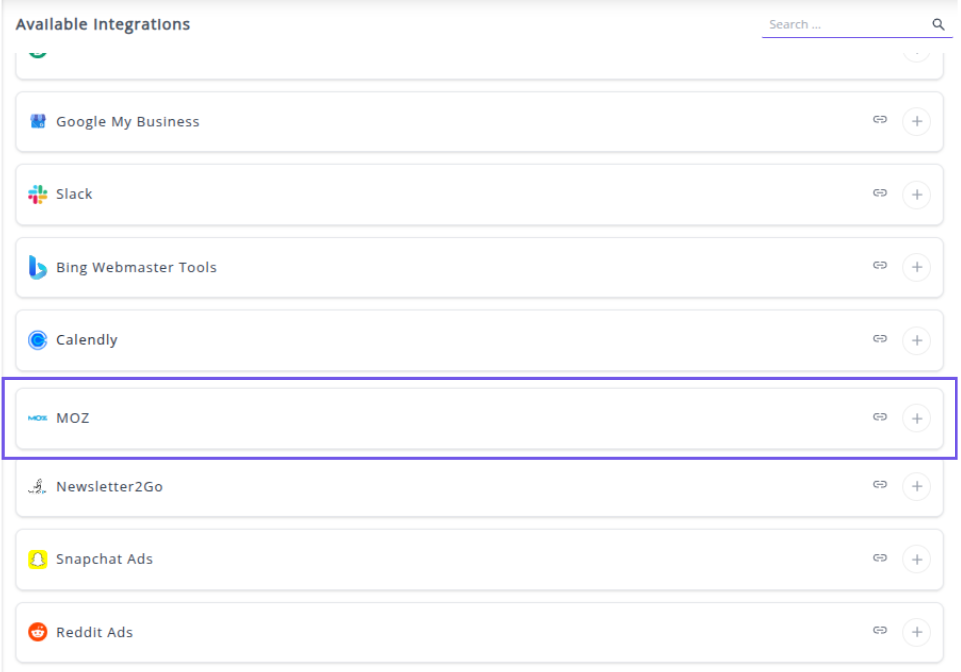
(Note: Image is a placeholder as the exact Whatsdash UI for Moz is not available. Please use an appropriate image for Moz integration.)
✔️ Click the + button to initiate the connection process.

A pop-up window titled "Please enter following params" will appear.

✔️ Fill in the following required fields to complete the integration setup:
Query type: Select the specific Moz data endpoint you want to use (e.g., URL Metrics, Top Pages).
NAME: Enter a unique name for this integration instance (e.g., My Website Moz SEO).
MOZ TOKEN: Enter your Moz API Token (or Secret Key, depending on your Moz API version). You can find your credentials in your Moz account's API management dashboard.
URL: Enter the specific URL (your website's domain or a specific page) you wish to pull metrics for.
LIMIT: Specify the maximum number of rows or results you want the API to return.
✔️ Click Next button to authenticate and save the integration.
✔️ Once authenticated, you will be directed back to Whatsdash. Your Moz Integration will appear in the Connected Integrations list.

✔️ You can now create or customize dashboards using your Moz Metrics and Dimensions.
👉 How to visualize this data in your dashboard, visit the Dashboard Documentation Guide
🔗 Moz Metrics
The table below lists the Moz Metrics available through the Whatsdash Moz Integration.
| Name | Category | Why It’s Useful |
|---|---|---|
| Http Code | moz | Helps identify if a page is accessible or has errors (e.g., 404 or 301). |
| Pages to Page | moz | Measures total internal links pointing to a specific page. |
| noFollow Pages to Page | moz | Identifies pages linking with “nofollow” tags, useful for link analysis. |
| Redirect Pages to Page | moz | Shows how many redirected pages lead to a given page, indicating migration impact. |
| External Pages to Page | moz | Tracks backlinks from external pages to your content, key for SEO ranking. |
| External noFollow Pages_to_page | moz | Counts external links marked as “nofollow,” useful for link quality checks. |
| External Redirect pages_to_page | moz | Tracks redirected backlinks from other domains, useful for understanding traffic flow. |
| Deleted pages_to_page | moz | Indicates broken or deleted pages previously linking to the page. |
| Root domains to Page | moz | Measures how many unique domains link to your page—important for authority. |
| Indirect Root Domains to Page | moz | Tracks indirect backlinks, showing extended influence across the web. |
| Deleted Root Domains to Page | moz | Helps monitor loss of referring domains and backlink decay. |
| Pages to Subdomain | moz | Counts internal links targeting subdomains, useful for subdomain analysis. |
| noFollow Pages to Subdomain | moz | Identifies subdomain links that don’t pass SEO value. |
| Root Domains to Subdomain | moz | Tracks unique domains linking to a subdomain, important for domain strength. |
| Pages to Root Domain | moz | Shows overall internal link connections within the root domain. |
| Page Authority | moz | Indicates the ranking strength of a page, crucial for SEO performance tracking. |
| Domain Authority | moz | Measures the overall authority of the domain, useful for SEO benchmarking. |
| Link Propensity | moz | Evaluates the likelihood of a page earning links, helping prioritize content strategy. |
| Spam Score | moz | Detects potential spam risks in backlinks, aiding SEO health maintenance. |
| Root Domains from Page | moz | Shows how many domains a page links out to, useful for outbound link evaluation. |
| Pages Crawled From Root Domain | moz | Tracks how many pages were successfully crawled under the main domain. |
| Root Domains to Root Domain | moz | Measures total domains linking to the entire root domain, key for overall authority. |
🔗 Moz Dimensions
The table below lists the Moz Dimensions available through the Whatsdash Moz Integration.
| Name | Why It’s Useful |
|---|---|
| Page | Identifies the specific page being analyzed, useful for tracking SEO performance at the page level. |
| Title | Displays the title of the page, helping evaluate title optimization and relevance for search ranking. |
🔗 Explore More Integrations
Whatsdash supports a wide range of marketing, analytics, and eCommerce integrations to give you a holistic view of your business performance.
👉 Visit the Integrations Page to explore all available connections
Newsletter2Go
Newsletter2Go is a powerful email marketing platform that simplifies the creation, automation, and performance tracking of email campaigns, helping businesses connect with their audience effectively.
Why Connect Newsletter2Go to Whatsdash
Integrating your Newsletter2Go data into Whatsdash provides a centralized view of your campaign performance and consolidate email campaign Metrics with other marketing data for complete cross-channel performance analysis and reporting.,turning delivery statistics into actionable business insights.
-
Simplified Reporting & Dashboards: Get instant, visual reports on your email marketing performance using pre-built or custom templates without needing to log into the Newsletter2Go platform.
-
Cross-Channel Analysis: Blend granular email Metrics with sales, CRM, and ad spend data from other sources to understand the true ROI of your email efforts.
-
Audience & Campaign Insights: Track audience behavior, campaign effectiveness, and deliverability metrics side-by-side to quickly identify high-performing segments and content.
📋 Steps to Integrate your Newsletter2Go account to Whatsdash
✔️ Navigate to the 'Integrations' page using the Navigation bar.
✔️ Select Newsletter2Go from the Available Integrations.

✔️ Click the + button to initiate the connection process.
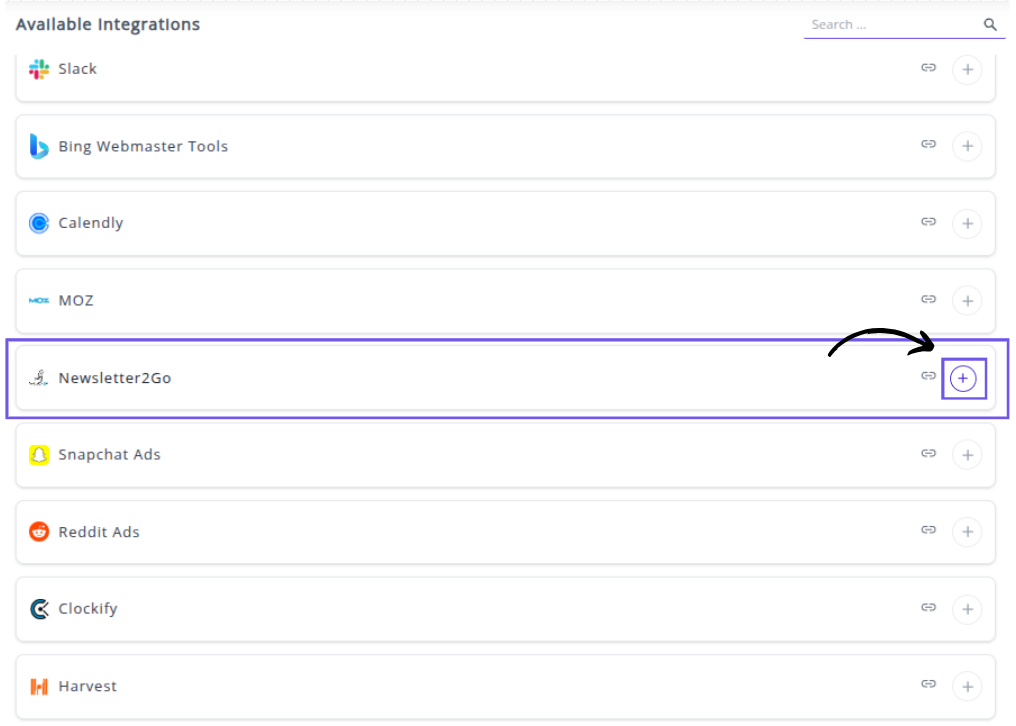
A pop-up window titled "Please enter following params" will appear.
 ✔️ Fill in the following required fields exactly as shown in your image to complete the integration setup:
Username: Enter the email address associated with your Newsletter2Go account. This is usually your login email.
Password: Enter the password for your Newsletter2Go account.
Auth Key: Enter the API Key (Auth Key) retrieved from the API management section within your Newsletter2Go account settings.
✔️ Click Next to authenticate and save the integration.
✔️ Once authenticated, you will be directed back to Whatsdash. Your Newsletter2Go Integration will appear in the Connected Integrations list.
✔️ You can now create or customize dashboards using your Newsletter2Go Metrics and Dimensions.
👉 How to visualize this data in your dashboard, visit the Dashboard Documentation Guide
🔗 Newsletter2Go Metrics
The table below lists the Newsletter2Go Metrics available through the Whatsdash Newsletter2Go Integration.
| Name | Category | Why It’s Useful |
|---|---|---|
| Unsubscribes | Helps track users opting out, indicating email fatigue or poor targeting. | |
| Complaints | Measures the number of spam reports to maintain sender reputation. | |
| Bounces | Identifies failed deliveries, useful for cleaning invalid email addresses. | |
| Unique Open Rate | Shows how many unique users opened the email — gauges subject line effectiveness. | |
| Open Rate | Measures total email opens to assess engagement levels. | |
| Unique Opens | Tracks distinct recipients who viewed your email, avoiding duplicates. | |
| Opens | Reflects total opens, helping analyze repeated engagement. | |
| Opens Per Opener | Indicates how many times each user revisits your email. | |
| Unique Click Rate | Measures unique recipients who clicked — signals real engagement. | |
| Click Rate | Tracks all clicks, giving insight into link performance. | |
| CTR | Click-through rate helps measure overall engagement from opens to clicks. | |
| Unique Clicks | Shows how many unique users interacted with your email links. | |
| Click | Total link clicks across all recipients. | |
| Clicks Per Clicker | Indicates how many times a single user clicks, showing deep engagement. | |
| Unique Conversion Rate | Percentage of unique recipients completing desired actions. | |
| Conversion Rate | Overall effectiveness of your campaign in driving conversions. | |
| Unique Conversions | Number of distinct users who converted — useful for attribution analysis. | |
| Conversions | Total conversions achieved through the campaign. | |
| Conversions Per Recipient | Evaluates conversion efficiency relative to audience size. | |
| Amount | Total revenue generated from the campaign — measures ROI. | |
| Amount Per Conversion | Average value of each conversion, useful for pricing strategy. | |
| Receivers | Total number of contacts who received the email — helps gauge deliverability. |
🔗 Newsletter2Go Dimensions
The table below lists the Newsletter2Go Dimensions available through the Whatsdash Newsletter2Go Integration.
| Name | Category | Why It’s Useful |
|---|---|---|
| Campaign Name | Helps identify and organize performance data across multiple campaigns. | |
| Campaign Subject | Useful for analyzing how subject lines impact open and engagement rates. | |
| List Name | Enables segmentation and tracking of performance by audience lists. |
🔗 Explore More Integrations
Whatsdash supports a wide range of marketing, analytics, and eCommerce integrations to give you a holistic view of your business performance.
👉 Visit the Integrations Page to explore all available connections
Snapchat Ads
Snapchat Ads is a powerful advertising platform that helps brands connect with a young, engaged audience through immersive, full-screen video, image, and AR experiences.
Why Connect Snapchat Ads to Whatsdash?
Connecting your Snapchat Ads account to Whatsdash allows you to consolidate all your paid social media performance data into a single, unified marketing dashboard for efficient analysis and optimization.
-
Unified Cross-Channel Reporting: Blend your Snapchat ad spend, impressions, and conversions with data from platforms like Google Ads, Facebook Ads, and Google Analytics to get a true, single view of your overall marketing ROI.
-
Deep Engagement Insights: Pull detailed metrics like Swipe Ups, Impressions, and Video Views by percentage to fully understand ad creative performance and user engagement depth.
-
Streamlined Optimization: Use Whatsdash's visual dashboards to quickly identify high-performing campaigns, ad sets, and creatives, allowing you to optimize your Snapchat budget and targeting without complex data exports.
📋 Steps to Integrate your Snapchat Ads Account to Whatsdash
✔️ Navigate to the 'Integrations' page using the Navigation bar.
✔️ Select Snapchat Ads from the Available Integrations.
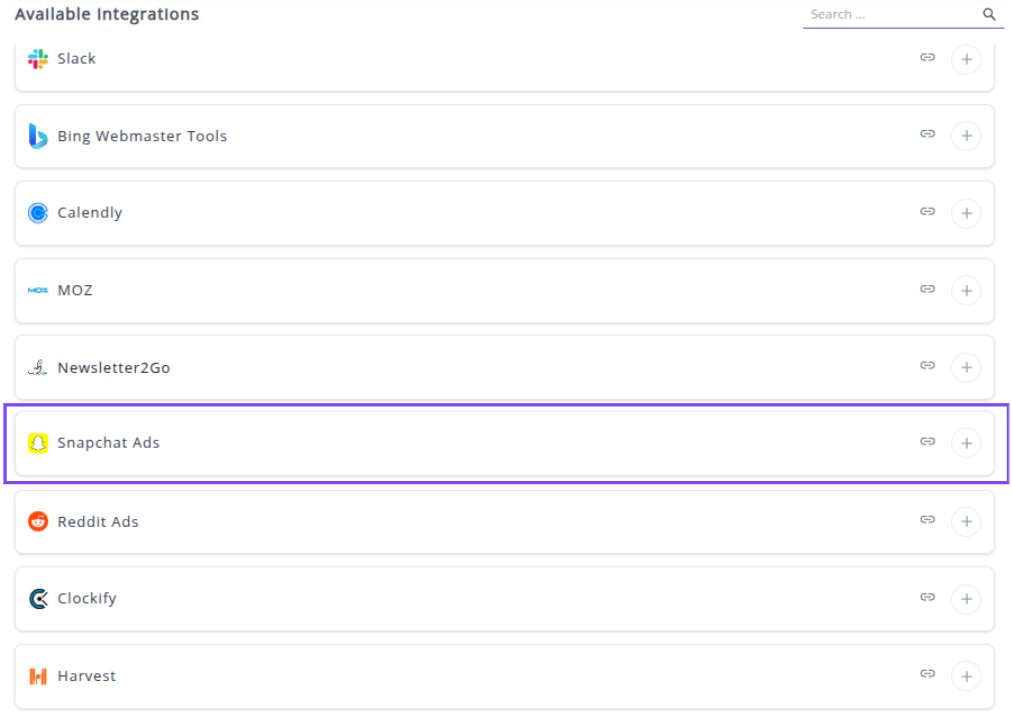
✔️ Click the + button to open the Snapchat authorization window.

✔️ You will be redirected to the Snapchat Sign-in page. Enter your Snapchat Business Manager credentials.
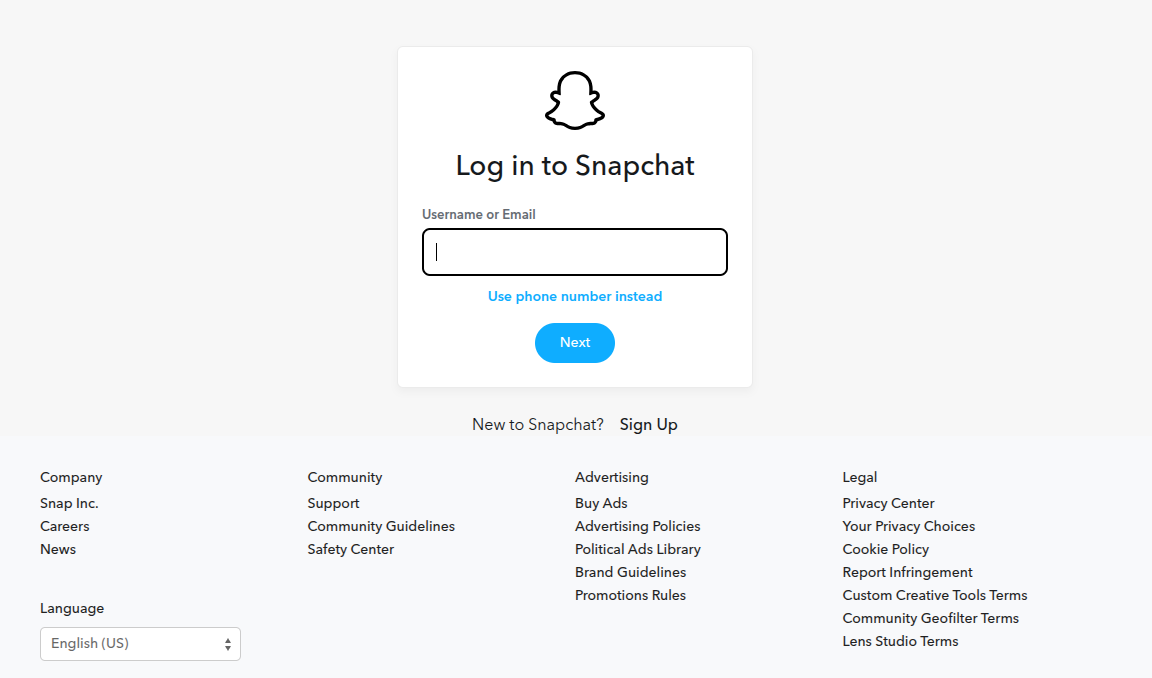
✔️ Review and Accept the permissions requested by Whatsdash to Read your Snapchat Ads data. This allows Whatsdash to access your campaign, ad set, and ad-level performance metrics.
✔️ Once authenticated, you will be directed back to Whatsdash. Your Snapchat Ads Integration will appear in the Connected Integrations list.
✔️ You can now create or customize dashboards using your Snapchat Ads Metrics and Dimensions.
👉 How to visualize this data in your dashboard, visit the Dashboard Documentation Guide.
🔗 Snapchat Ads Metrics
The table below lists the Snapchat Ads Metrics available through the Whatsdash Snapchat Ads Integration.
| Name | Category | Why It’s Useful |
|---|---|---|
| Spend | campaigns | Shows the total money spent on campaigns for budgeting and ROI analysis. |
| Paid Reach | campaigns | Indicates the number of unique users who saw your ad through paid promotion. |
| Impressions | campaigns | Total number of times ads were displayed; helps measure ad exposure. |
| Frequency | campaigns | Average impressions per user; useful to avoid overexposure. |
| eCPM | campaigns | Effective cost per 1,000 impressions; helps evaluate ad efficiency. |
| Swipe Ups | campaigns | Measures engagement by counting how many users swiped on the ad. |
| Swipe Up Rate | campaigns | Shows average swipes per impression; evaluates engagement effectiveness. |
| eCPSU | campaigns | Cost per swipe up; helps determine ROI for engagement actions. |
| Video Views | campaigns | Total views of your video ad; measures content reach. |
| View Completion | campaigns | Shows how many users watched the entire video; measures engagement quality. |
| Attachment Frequency | campaigns | Average times an attachment is associated with user interactions; measures content interaction. |
| Attachment Reach | campaigns | Number of unique users interacting with attachments; measures reach of secondary content. |
| Conversion Purchases Value | campaigns | Total revenue from purchases driven by the ad; evaluates financial performance. |
| Conversion Purchases | campaigns | Number of purchase events attributed to the ad; measures conversions. |
| ROAS | campaigns | Return on ad spend; evaluates overall campaign profitability. |
| Total Screen Time | campaigns | Cumulative time users spent watching ads; measures attention. |
| Avg Screen Time | campaigns | Average seconds watched per impression; indicates ad effectiveness. |
| eCPV | campaigns | Cost per video view; measures efficiency of video ads. |
| Conversion Rate | campaigns | Percentage of users completing a desired action; measures campaign effectiveness. |
| Quartile 1 Views | campaigns | % of users who watched at least 25% of video; tracks engagement progression. |
| Quartile 2 Views | campaigns | % of users who watched at least 50% of video; monitors mid-point engagement. |
| Quartile 3 Views | campaigns | % of users who watched at least 75% of video; measures high engagement. |
| Attachment Quartile 1 | campaigns | % of users interacting with attachment and viewing 25%; measures partial attachment engagement. |
| Attachment Quartile 2 | campaigns | % of users interacting with attachment and viewing 50%; tracks moderate engagement. |
| Attachment Quartile 3 | campaigns | % of users interacting with attachment and viewing 75%; tracks high engagement. |
| Attachment View Completion | campaigns | % of users who watched the entire attachment; measures full engagement. |
| Attachment Total View Time | campaigns | Total time users spent on attachments; evaluates user attention to additional content. |
🔗 Snapchat Ads Dimensions
The table below lists the Snapchat Ads Dimensions available through the Whatsdash Snapchat Ads Integration.
| Name | Category | Why It’s Useful |
|---|---|---|
| Ad ID | ads | Helps track individual ad performance for reporting and optimization. |
| Ad Set ID | adsquad | Useful to monitor performance and allocation at the ad set level. |
| Campaign ID | campaigns | Enables evaluation and comparison of different campaigns’ effectiveness. |
🔗 Explore More Integrations
Whatsdash supports a wide range of marketing, analytics, and eCommerce integrations to give you a holistic view of your business performance.
👉 Visit the Integrations Page to explore all available connections
Reddit Ads
Reddit Ads is an advertising platform that allows businesses to reach a highly engaged audience within Reddit's vast network of communities (subreddits).
Why Connect Reddit Ads to Whatsdash?
Integrating your Reddit Ads data with Whatsdash transforms campaign statistics into clear, easy-to-digest reports, helping you understand what drives results with Reddit's unique audience.
-
Centralized Ad Reporting: Track key performance indicators (KPIs) like impressions, clicks, spend, and Return on Ad Spend (ROAS) in one dashboard, without needing to log into the Reddit Ads Manager.
-
Community & Targeting Analysis: Easily break down performance by Subreddit, Interest, and Geography to see which communities are most valuable and optimize your targeting strategy to prevent ad fatigue.
-
Cross-Channel Blending: Combine your Reddit Ads cost and conversion data with metrics from Google Analytics 4, Facebook Ads, and other platforms to get a holistic view of the customer journey and measure true cross-platform ROI.
📋 Steps to Integrate your Reddit Ads Account to Whatsdash
✔️ Navigate to the 'Integrations' page using the Navigation bar.
✔️ Select Reddit Ads from the Available Integrations.
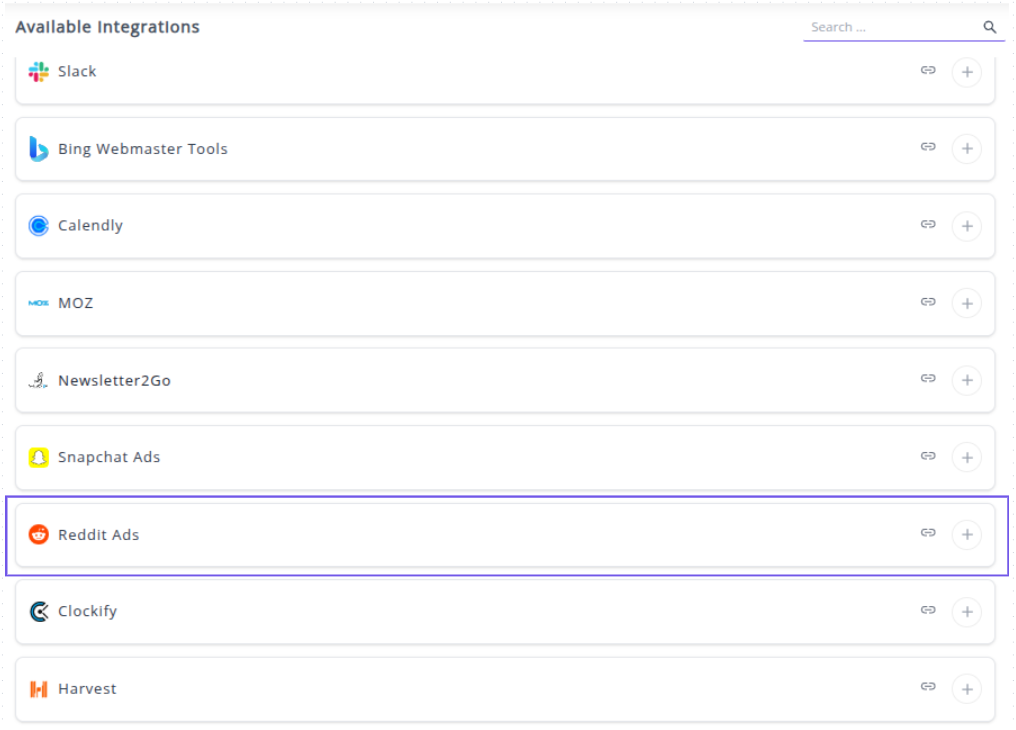
✔️ Click the + button to initiate the Reddit Ads authorization process.
 ✔️ You will be redirected to the Reddit sign-in and authorization page. Enter your Reddit Ads credentials and grant Whatsdash the necessary permissions to Read your ads data.

✔️ Once authenticated, you will be directed back to Whatsdash. Your Reddit Ads Integration will appear in the Connected Integrations list.
✔️ You can now create or customize dashboards using your Reddit Ads Metrics and Dimensions.
👉 To learn how to visualize this data in your dashboard, visit the Dashboard Documentation Guide
🔗 Reddit Ads Metrics
The table below lists the Reddit Ads Metrics available through the Whatsdash Reddit Ads Integration.
| Name | Category | Why It's Useful |
|---|---|---|
| Clicks | Ads | Measures total user engagement with your ads. |
| Cost Per Click (CPC) | Ads | Helps evaluate the cost-efficiency of each ad click. |
| Cost Per View (CPV) | Ads | Useful for analyzing video campaign cost efficiency. |
| Click-Through Rate (CTR) | Ads | Indicates how compelling your ad creatives are. |
| Effective Cost Per Mille (eCPM) | Ads | Shows how much you earn or spend per 1,000 impressions. |
| Frequency | Ads | Tracks how often users see your ads, avoiding overexposure. |
| Impressions | Ads | Measures how many times ads are shown. |
| Reach | Ads | Tracks the number of unique users reached. |
| Reddit Leads | Ads | Indicates lead generation effectiveness from Reddit ads. |
| Spend | Ads | Tracks total ad expenditure for budgeting analysis. |
| Key Conversion Clicks | Ads | Measures conversions directly linked to ad clicks. |
| Key Conversion eCPA | Ads | Tracks cost per acquisition for key conversions. |
| Key Conversion Rate | Ads | Shows conversion efficiency from clicks. |
| Key Conversion Total Count | Ads | Total key conversions achieved. |
| Key Conversion Views | Ads | Tracks views that resulted in conversions. |
| Conversion Add to Cart Average Value | Ads | Helps measure cart value performance. |
| Conversion Add to Cart Clicks | Ads | Tracks ad clicks that led to cart additions. |
| Conversion Add to Cart eCPA | Ads | Determines cost per cart addition conversion. |
| Conversion Add to Cart Total Items | Ads | Measures how many items users added to carts. |
| Conversion Add to Cart Total Value | Ads | Shows total cart value influenced by ads. |
| Conversion Add to Cart Views | Ads | Measures views that led to cart actions. |
| Conversion Add to Wishlist Average Value | Ads | Tracks wishlist item values to assess interest. |
| Conversion Add to Wishlist Clicks | Ads | Measures ad-driven wishlist clicks. |
| Conversion Add to Wishlist eCPA | Ads | Tracks cost per wishlist conversion. |
| Conversion Add to Wishlist Total Items | Ads | Tracks wishlist items generated from ads. |
| Conversion Add to Wishlist Total Value | Ads | Helps assess total value of wishlist items. |
| Conversion Add to Wishlist Views | Ads | Tracks ad impressions resulting in wishlists. |
| Conversion Custom Average Value | Ads | Evaluates the monetary value of custom conversions. |
| Conversion Custom Clicks | Ads | Tracks clicks leading to custom conversions. |
| Conversion Custom eCPA | Ads | Monitors cost efficiency of custom conversions. |
| Conversion Custom Event 10 Average Value | Ads | Measures event-specific conversion value. |
| Conversion Custom Event 10 Clicks | Ads | Tracks clicks for event 10 conversions. |
| Conversion Custom Event 10 eCPA | Ads | Determines acquisition cost for event 10. |
| Conversion Custom Event 10 ROAS | Ads | Shows return on ad spend for event 10. |
| Conversion Custom Event 10 Total Items | Ads | Counts total items from event 10 conversions. |
| Conversion Custom Event 10 Total Value | Ads | Tracks total value generated from event 10. |
| Conversion Custom Event 10 Views | Ads | Measures views resulting in event 10 conversions. |
| Conversion Custom Event 3 eCPA | Ads | Measures the cost-effectiveness of acquiring conversions for custom event 3. |
| Conversion Custom Event 3 ROAS | Ads | Tracks how much revenue you earn for every dollar spent on event 3 ads. |
| Conversion Custom Event 3 Total Items | Ads | Shows how many items were converted under event 3, indicating engagement level. |
| Conversion Custom Event 3 Total Value | Ads | Measures total monetary value generated from event 3 conversions. |
| Conversion Custom Event 3 Views | Ads | Tracks total ad views that led to event 3 conversions. |
| Conversion Custom Total Items | Ads | Indicates the total number of items from all custom conversions, showing engagement breadth. |
| Conversion Custom Total Value | Ads | Measures the combined value from all custom conversion events. |
| Conversion Custom Views | Ads | Tracks how many views across campaigns resulted in any custom conversions. |
| Conversion Lead Average Value | Ads | Shows the average revenue or value per lead generated. |
| Conversion Lead Clicks | Ads | Tracks clicks that resulted in lead generation, measuring ad effectiveness. |
| Conversion Lead eCPA | Ads | Determines the cost efficiency for each lead conversion. |
| Conversion Lead Total Value | Ads | Measures total revenue or value from all lead conversions. |
| Conversion Lead Views | Ads | Tracks how many ad views contributed to lead conversions. |
| Conversion Page Visit Clicks | Ads | Measures clicks that resulted in page visits, indicating interest. |
| Conversion Page Visit eCPA | Ads | Tracks cost per page visit conversion to assess efficiency. |
| Conversion Page Visit Views | Ads | Measures views that led to page visits, showing content effectiveness. |
| Conversion Purchase Average Value | Ads | Indicates the average transaction value from purchases driven by ads. |
| Conversion Purchase Clicks | Ads | Tracks clicks that resulted in completed purchases. |
| Conversion Purchase eCPA | Ads | Measures how much each purchase conversion costs on average. |
| Conversion Purchase Total Items | Ads | Shows total number of items purchased via ads, useful for sales analysis. |
| Conversion Purchase Total Value | Ads | Measures total revenue from purchases driven by Reddit ads. |
| Conversion Purchase Views | Ads | Tracks how many ad views resulted in purchases, highlighting ad performance. |
| Conversion ROAS | Ads | Measures the revenue generated for every dollar spent, helping assess ad profitability. |
| Conversion Search Clicks | Ads | Tracks how many clicks led to search-based conversions for performance optimization. |
| Conversion Search eCPA | Ads | Helps identify cost efficiency per search acquisition. |
| Conversion Search Views | Ads | Shows how many views converted from search impressions. |
| Conversion Sign Up Clicks | Ads | Monitors clicks that resulted in sign-ups to track engagement effectiveness. |
| Conversion Sign Up eCPA | Ads | Evaluates the average cost per sign-up to improve campaign efficiency. |
| Conversion Sign Up Views | Ads | Measures the visibility of sign-up-related content leading to conversions. |
| Conversion Sign Up Average Value | Ads | Reveals average value of sign-up conversions to gauge ROI. |
| Conversion Sign Up Total Value | Ads | Shows total value generated from all sign-up conversions. |
| Conversion View Content Clicks | Ads | Tracks clicks that led to view content conversions. |
| Conversion View Content eCPA | Ads | Calculates acquisition cost efficiency for content views. |
| Conversion View Content Views | Ads | Measures engagement level through view-based conversions. |
| Product Add to Cart | Ads | Tracks how many users added items to cart, indicating buying intent. |
| Product Click Purchase | Ads | Measures clicks that resulted in actual purchases. |
| Product Clicks | Ads | Indicates overall engagement and product interest. |
| Product Impressions | Ads | Shows total ad visibility for products. |
| Product Total Sales | Ads | Tracks overall sales revenue generated through ads. |
| Product Total Sales Clicks | Ads | Measures clicks contributing to total product sales. |
| Product Total Sales Views | Ads | Shows views resulting in product sales conversions. |
| Product View Purchase | Ads | Tracks how many product views turned into purchases. |
| Video Completion Rate | Ads | Indicates how engaging your videos are based on completion percentage. |
| Video Fully Viewable Impressions | Ads | Measures fully visible video ad impressions for quality reach. |
| Video Plays Expanded | Ads | Tracks plays in expanded mode to gauge deeper engagement. |
| Video Plays with Sound | Ads | Indicates how many users engaged with sound-on experiences. |
| Video Started | Ads | Measures how many times a video was initiated. |
| Video View Rate | Ads | Shows what percentage of impressions led to video views. |
| Video Viewable Impressions | Ads | Indicates ad visibility and exposure quality. |
| Video Watched 100 Percent | Ads | Tracks how many users watched videos till the end. |
| Video Watched 10 Seconds | Ads | Measures short engagement—early drop-off insight. |
| Video Watched 25 Percent | Ads | Gauges initial viewer engagement. |
| Video Watched 3 Seconds | Ads | Measures early retention of video ads. |
| Video Watched 50 Percent | Ads | Indicates mid-point engagement and viewer interest. |
| Video Watched 5 Seconds | Ads | Captures very short-term engagement. |
| Video Watched 75 Percent | Ads | Shows strong viewer retention nearing completion. |
| Video Watched 95 Percent | Ads | Measures near-complete video watches, signaling strong engagement. |
| View Attribution Window | Ads | Defines how long after viewing an ad a conversion is attributed. |
| App Install Install Count | Ads | Measures total number of app installs generated by ads. |
| App Install Install CVR | Ads | Tracks install conversion rate to assess effectiveness. |
| App Install Install ECPA | Ads | Calculates cost per app install for budgeting insights. |
| App Install Add Payment Info Count | Ads | Tracks post-install actions where users add payment info. |
| App Install Add Payment Info CVR | Ads | Measures how efficiently users add payment info post-install. |
| App Install Add Payment Info ECPA | Ads | Shows average cost for acquiring users who add payment info. |
| App Install Add to Cart Count | Ads | Tracks number of users adding to cart after app install. |
| App Install Add to Cart CVR | Ads | Evaluates conversion rate of post-install cart additions. |
| App Install Add to Cart ECPA | Ads | Measures cost-effectiveness of encouraging users to add items to cart after installing the app. | | App Install App Launch Count | Ads | Tracks how often users open the app post-install, indicating engagement levels. | | App Install App Launch CVR | Ads | Shows what percentage of installs result in an app launch, helping gauge initial user activation. | | App Install App Launch ECPA | Ads | Evaluates cost per user who opens the app after installation. | | App Install Completed Tutorial Count | Ads | Measures number of users completing tutorials, showing onboarding success. | | App Install Completed Tutorial CVR | Ads | Indicates what percentage of new users complete the tutorial. | | App Install Completed Tutorial ECPA | Ads | Shows cost per tutorial completion, valuable for retention optimization. | | App Install Level Achieved Count | Ads | Tracks number of users reaching a level, reflecting in-app engagement. | | App Install Level Achieved CVR | Ads | Indicates success rate of users reaching milestones post-install. | | App Install Level Achieved ECPA | Ads | Measures cost per level achieved — key for gaming apps. | | App Install MMP Ad Click Count | Ads | Tracks ad clicks recorded by MMP, helping validate performance attribution. | | App Install MMP Ad Click CVR | Ads | Shows click-to-install conversion efficiency. | | App Install MMP Ad Click ECPA | Ads | Reveals cost per meaningful ad click tracked by MMP. | | App Install MMP Ad View Count | Ads | Measures ad views via MMP for campaign visibility. | | App Install MMP Ad View CVR | Ads | Shows view-to-action conversion rate. | | App Install MMP Ad View ECPA | Ads | Tracks cost efficiency of ad impressions converting to installs. | | App Install MMP Add Payment Info Count | Ads | Measures how many users added payment info post-install — signals monetization readiness. | | App Install MMP Add Payment Info CVR | Ads | Indicates success rate of users entering payment details. | | App Install MMP Add Payment Info ECPA | Ads | Evaluates cost per user adding payment info, useful for revenue optimization. | | App Install MMP Add to Cart Count | Ads | Counts cart additions tracked post-install — valuable for e-commerce. | | App Install MMP Add to Cart CVR | Ads | Shows conversion efficiency for cart additions. | | App Install MMP Add to Cart ECPA | Ads | Measures cost per “add to cart” — vital for cost analysis. | | App Install MMP Add to Wishlist Count | Ads | Tracks wishlist additions to gauge interest before purchase. | | App Install MMP Add to Wishlist CVR | Ads | Measures how effectively users add items to wishlists. | | App Install MMP Add to Wishlist ECPA | Ads | Evaluates cost per wishlist engagement. | | App Install MMP App Launch Count | Ads | Tracks total app launches post-install for engagement assessment. | | App Install MMP App Launch CVR | Ads | Shows conversion from install to active usage. | | App Install MMP App Launch ECPA | Ads | Determines cost per app launch tracked via MMP. | | App Install MMP Checkout Count | Ads | Tracks successful checkouts, key for e-commerce success. | | App Install MMP Checkout CVR | Ads | Shows conversion rate from install to checkout. | | App Install MMP Checkout ECPA | Ads | Measures cost per checkout action. | | App Install MMP Completed Tutorial Count | Ads | Counts completed tutorials to assess onboarding success. | | App Install MMP Completed Tutorial CVR | Ads | Measures tutorial completion rate post-install. | | App Install MMP Completed Tutorial ECPA | Ads | Evaluates cost per tutorial completion tracked by MMP. | | App Install MMP First Time Purchase Count | Ads | Tracks first purchases — crucial for measuring initial monetization. | | App Install MMP First Time Purchase CVR | Ads | Shows how many new users convert to first-time buyers. | | App Install MMP First Time Purchase ECPA | Ads | Measures cost per first-time purchase — key ROI metric. | | App Install MMP Install Count | Ads | Counts installs attributed by MMP for tracking campaign scale. | | App Install MMP Install CVR | Ads | Tracks effectiveness of converting ad views to installs. | | App Install MMP Install ECPA | Ads | Measures cost per install — key for acquisition budgeting. | | App Install MMP Level Achieved Count | Ads | Tracks how many users reach a level — reflects engagement. | | App Install MMP Level Achieved CVR | Ads | Shows rate of users achieving milestones. | | App Install MMP Level Achieved ECPA | Ads | Evaluates cost per user reaching a defined level. | | App Install MMP Login Count | Ads | Tracks user logins to assess active user retention. | | App Install MMP Login CVR | Ads | Shows how many installs lead to repeat engagement. | | App Install MMP Login ECPA | Ads | Measures cost per logged-in user. | | App Install MMP Onboard Completed Count | Ads | Tracks users completing onboarding flow. | | App Install MMP Onboard Completed CVR | Ads | Measures onboarding success rate. | | App Install MMP Onboard Completed ECPA | Ads | Evaluates cost per completed onboarding. | | App Install MMP Onboard Started Count | Ads | Counts users starting onboarding — useful for funnel analysis. | | App Install MMP Onboard Started CVR | Ads | Shows how many users begin onboarding. | | App Install MMP Onboard Started ECPA | Ads | Measures cost per onboarding start. | | App Install MMP Purchase Count | Ads | Tracks total purchases post-install for revenue insights. | | App Install MMP Purchase CVR | Ads | Shows conversion from install to purchase. | | App Install MMP Purchase ECPA | Ads | Measures cost per purchase — a primary performance metric. | | App Install MMP Rate Count | Ads | Tracks how many users leave ratings, showing satisfaction. | | App Install MMP Rate CVR | Ads | Measures engagement in rating activity. | | App Install MMP Rate ECPA | Ads | Evaluates cost per rating action. | | App Install MMP Reinstall Count | Ads | Tracks reinstalled apps, showing re-engagement potential. | | App Install MMP Reinstall CVR | Ads | Indicates conversion of reinstallation behavior. |
| App Install MMP ROAS | ads | Measures return on ad spend to evaluate profitability of app install campaigns. | | App Install MMP Search Count | ads | Shows total searches after app installs, useful for tracking user engagement. | | App Install MMP Search CVR | ads | Indicates the search conversion rate to assess effectiveness of search-based actions. | | App Install MMP Search ECPA | ads | Measures cost per search action to evaluate campaign efficiency. | | App Install MMP Sign Up Count | ads | Tracks number of sign-ups post-install, showing user onboarding success. | | App Install MMP Sign Up CVR | ads | Calculates sign-up conversion rate to measure funnel performance. | | App Install MMP Sign Up ECPA | ads | Shows cost per sign-up to analyze acquisition efficiency. | | App Install MMP Spend Credits Count | ads | Tracks in-app spending actions to gauge post-install engagement. | | App Install MMP Spend Credits CVR | ads | Measures conversion rate for spending credits, indicating monetization behavior. | | App Install MMP Spend Credits ECPA | ads | Evaluates cost per spend action to measure ROI from engaged users. | | App Install MMP Start Trial Count | ads | Tracks trial starts to assess interest in premium features. | | App Install MMP Start Trial CVR | ads | Calculates trial start conversion rate for campaign optimization. | | App Install MMP Start Trial ECPA | ads | Indicates cost per trial start, useful for assessing acquisition cost. | | App Install MMP Subscribe Count | ads | Counts subscriptions after app installs to track monetization success. | | App Install MMP Subscribe CVR | ads | Measures subscription conversion rate for evaluating ad effectiveness. | | App Install MMP Subscribe ECPA | ads | Calculates cost per subscription to analyze ad spend efficiency. | | App Install MMP Total Conversions | ads | Shows total conversions to evaluate overall campaign impact. | | App Install MMP Total Install Count | ads | Tracks total installs to gauge campaign reach and performance. | | App Install MMP Total Install CVR | ads | Measures install conversion rate for assessing campaign effectiveness. | | App Install MMP Total Install ECPA | ads | Indicates cost per install, key for ROI and budget efficiency. | | App Install MMP Unlock Achievement Count | ads | Tracks user achievements to measure engagement and retention. | | App Install MMP Unlock Achievement CVR | ads | Shows conversion rate for unlocking achievements, reflecting user involvement. | | App Install MMP Unlock Achievement ECPA | ads | Evaluates cost per achievement unlock for performance optimization. | | App Install MMP View Content Count | ads | Counts content views post-install to assess user interest. | | App Install MMP View Content CVR | ads | Calculates content view conversion rate for engagement insights. | | App Install MMP View Content ECPA | ads | Measures cost per content view to determine efficiency of engagement. | | App Install Purchase Count | ads | Tracks total purchases post-install, showing revenue-driving actions. | | App Install Purchase CVR | ads | Indicates purchase conversion rate for assessing sales effectiveness. | | App Install Purchase ECPA | ads | Measures cost per purchase to evaluate campaign ROI. | | App Install Revenue | ads | Represents total revenue from app installs, essential for ROI analysis. | | App Install ROAS Double | ads | Shows return on ad spend as a ratio, critical for profitability tracking. | | App Install Search Count | ads | Counts searches after installs to track in-app user activity. | | App Install Search CVR | ads | Measures conversion rate of searches for performance analysis. | | App Install Search ECPA | ads | Calculates cost per search to determine campaign efficiency. | | App Install Sign Up Count | ads | Tracks sign-ups after installs to monitor acquisition flow. | | App Install Sign Up CVR | ads | Calculates sign-up conversion rate to assess effectiveness. | | App Install Sign Up ECPA | ads | Measures cost per sign-up for cost-efficiency tracking. | | App Install SKAN Ad Click Count | ads | Tracks ad clicks under SKAN framework for iOS attribution. | | App Install SKAN Ad Click CVR | ads | Measures ad click conversion rate for SKAN campaigns. | | App Install SKAN Ad Click ECPA | ads | Evaluates cost per ad click for SKAN-based optimization. | | App Install SKAN Ad View Count | ads | Counts ad views to assess exposure under SKAN tracking. | | App Install SKAN Ad View CVR | ads | Measures ad view conversion rate for engagement evaluation. | | App Install SKAN Ad View ECPA | ads | Calculates cost per ad view for campaign optimization. | | App Install SKAN Add Payment Info Count | ads | Tracks “add payment info” actions to gauge purchase intent. | | App Install SKAN Add Payment Info CVR | ads | Measures conversion rate for adding payment info under SKAN. | | App Install SKAN Add Payment Info ECPA | ads | Calculates cost per add-payment-info action for cost tracking. | | App Install SKAN Add to Cart Count | ads | Tracks add-to-cart events for eCommerce-related installs. | | App Install SKAN Add to Cart CVR | ads | Shows add-to-cart conversion rate under SKAN tracking. | | App Install SKAN Add to Cart ECPA | ads | Measures cost per add-to-cart action for optimization. | | App Install SKAN Add to Wishlist Count | ads | Tracks wishlist actions to gauge product interest. | | App Install SKAN Add to Wishlist CVR | ads | Measures wishlist conversion rate for engagement insights. | | App Install SKAN Add to Wishlist ECPA | ads | Calculates cost per wishlist action for ROI assessment. | | App Install SKAN App Launch Count | ads | Tracks app launches post-install to measure retention. | | App Install SKAN App Launch CVR | ads | Shows app launch conversion rate under SKAN framework. | | App Install SKAN App Launch ECPA | ads | Evaluates cost per app launch to assess campaign efficiency. | | App Install SKAN Checkout Count | ads | Counts checkout actions to track user purchase behavior. | | App Install SKAN Checkout CVR | ads | Measures checkout conversion rate for purchase funnel insights. | | App Install SKAN Checkout ECPA | ads | Indicates cost per checkout for profitability tracking. | | App Install SKAN Completed Tutorial Count | ads | Tracks completed tutorials for onboarding success metrics. | | App Install SKAN Completed Tutorial CVR | ads | Shows tutorial completion rate to assess early user engagement. | | App Install SKAN Completed Tutorial ECPA | ads | Calculates cost per tutorial completion for ROI analysis. | | App Install SKAN First Time Purchase Count | ads | Tracks first-time purchases for new user monetization. | | App Install SKAN First Time Purchase CVR | ads | Measures conversion rate of first-time purchases for performance analysis. |
| App Install SKAN First Time Purchase ECPA | Ads | Measures cost efficiency for first-time purchases driven by SKAN campaigns. | | App Install SKAN Install Count | Ads | Tracks the total number of installs attributed to SKAN campaigns. | | App Install SKAN Install CVR | Ads | Helps understand conversion rate of installs from impressions. | | App Install SKAN Install ECPA | Ads | Evaluates cost-effectiveness per SKAN-tracked install. | | App Install SKAN Level Achieved Count | Ads | Shows how many users reached certain levels post-install. | | App Install SKAN Level Achieved CVR | Ads | Measures engagement by tracking progression rates after install. | | App Install SKAN Level Achieved ECPA | Ads | Analyzes the cost to drive meaningful in-app engagement (level achievements). | | App Install SKAN Login Count | Ads | Tracks how many users logged in after installation. | | App Install SKAN Login CVR | Ads | Indicates onboarding success and early user retention. | | App Install SKAN Login ECPA | Ads | Shows cost to achieve user logins post-install. | | App Install SKAN Onboard Completed Count | Ads | Measures users completing onboarding steps. | | App Install SKAN Onboard Completed CVR | Ads | Evaluates onboarding flow efficiency. | | App Install SKAN Onboard Completed ECPA | Ads | Determines cost of acquiring a fully onboarded user. | | App Install SKAN Onboard Started Count | Ads | Tracks users who begin onboarding after installation. | | App Install SKAN Onboard Started CVR | Ads | Gauges initial engagement right after app install. | | App Install SKAN Onboard Started ECPA | Ads | Calculates cost per user starting onboarding. | | App Install SKAN Purchase Count | Ads | Counts SKAN-tracked purchases post-install. | | App Install SKAN Purchase CVR | Ads | Measures how many users make purchases after installing. | | App Install SKAN Purchase ECPA | Ads | Evaluates cost to drive in-app purchase actions. | | App Install SKAN Rate Count | Ads | Counts users rating the app post-install. | | App Install SKAN Rate CVR | Ads | Measures satisfaction and engagement via app ratings. | | App Install SKAN Rate ECPA | Ads | Shows cost per user rating the app. | | App Install SKAN Reinstall Count | Ads | Tracks reinstalls — important for retention and re-engagement metrics. | | App Install SKAN Reinstall CVR | Ads | Evaluates reinstall conversion rate. | | App Install SKAN Reinstall ECPA | Ads | Measures cost per reinstall for retargeting effectiveness. | | App Install SKAN Revenue | Ads | Shows total revenue generated via SKAN-tracked conversions. | | App Install SKAN ROAS | Ads | Measures return on ad spend for SKAN campaigns. | | App Install SKAN Search Count | Ads | Counts users performing in-app searches post-install. | | App Install SKAN Search CVR | Ads | Indicates engagement depth through search interactions. | | App Install SKAN Search ECPA | Ads | Cost per user performing searches in the app. | | App Install SKAN Sign Up Count | Ads | Counts sign-ups after installation. | | App Install SKAN Sign Up CVR | Ads | Conversion rate from install to registration. | | App Install SKAN Sign Up ECPA | Ads | Cost per registered user. | | App Install SKAN Spend Credits Count | Ads | Tracks spend-credits events post-install. | | App Install SKAN Spend Credits CVR | Ads | Conversion rate for users spending in-app credits. | | App Install SKAN Spend Credits ECPA | Ads | Cost per spend-credits action. | | App Install SKAN Start Trial Count | Ads | Tracks users who start trials. | | App Install SKAN Start Trial CVR | Ads | Conversion rate for trial signups. | | App Install SKAN Start Trial ECPA | Ads | Cost per trial user acquired. | | App Install SKAN Subscribe Count | Ads | Tracks subscription activations. | | App Install SKAN Subscribe CVR | Ads | Measures how well SKAN campaigns convert to subscriptions. | | App Install SKAN Subscribe ECPA | Ads | Cost per paid subscriber. | | App Install SKAN Total Conversions | Ads | Total SKAN conversions — key performance indicator. | | App Install SKAN Total Install Count | Ads | Measures all SKAN installs across campaigns. | | App Install SKAN Total Install CVR | Ads | Conversion rate across all installs. | | App Install SKAN Total Install ECPA | Ads | Overall cost efficiency of installs. | | App Install SKAN Unknown Count | Ads | Tracks unclassified SKAN actions for debugging. | | App Install SKAN Unlock Achievement Count | Ads | Measures engagement by users unlocking achievements. | | App Install SKAN Unlock Achievement CVR | Ads | Tracks rate of achievement unlocks after installs. | | App Install SKAN Unlock Achievement ECPA | Ads | Cost per achievement unlock. | | App Install SKAN View Content Count | Ads | Tracks content viewed post-install. | | App Install SKAN View Content CVR | Ads | Measures engagement depth via content views. | | App Install SKAN View Content ECPA | Ads | Cost per user viewing content. |
🔗 Reddit Ads Dimensions
The table below lists the Reddit Ads Dimensions available through the Whatsdash Reddit Ads Integration.
| Name | Category | Why It’s Useful |
|---|---|---|
| Ad Account ID | ads | Identifies the ad account; useful for tracking account-level performance. |
| Ad Group ID | ads | Identifies the ad group within a campaign; helps in organizing ad sets. |
| Ad ID | ads | Unique identifier for the ad; essential for granular analysis. |
| Campaign ID | ads | Identifies the campaign; enables campaign-level tracking and reporting. |
| Country | ads | Indicates the audience country; useful for geo-targeting and segmentation. |
| Date | ads | Tracks performance on a specific date; helps analyze trends over time. |
| Hour | ads | Tracks performance by hour; useful for time-of-day optimization. |
| DMA | ads | Designated Market Area; helps in regional targeting and insights. |
| Metro | ads | Metropolitan area; allows detailed urban targeting and performance analysis. |
| Carousel Card | ads | Identifies carousel cards; useful for tracking multi-image ad engagement. |
| Gallery Item ID | ads | Identifies gallery items; helps in performance tracking of multi-content ads. |
| Gender | ads | Audience gender; enables demographic analysis. |
| Interest | ads | Audience interest; helps optimize targeting based on user preferences. |
| Keyword | ads | Keyword targeting; tracks performance of ads for specific search terms. |
| Placement | ads | Indicates ad placement; helps in assessing which placements perform best. |
| Region | ads | Audience region; useful for regional performance evaluation. |
| Community | ads | Community or subreddit; allows granular tracking by Reddit communities. |
🔗 Explore More Integrations
Whatsdash supports a wide range of marketing, analytics, and eCommerce integrations to give you a holistic view of your business performance.
👉 Visit the Integrations Page to explore all available connections
Clockify
Clockify is a leading time tracking and timesheet application that helps individuals and teams monitor and manage their work hours across different projects and tasks. It offers detailed reporting to provide clear visibility into where time is spent, enhancing productivity and billing accuracy.
Why Connect Clockify to Whatsdash?
Integrating your Clockify data with Whatsdash transforms raw time tracking information into visually clear, actionable business insights, making it easy for you to manage team efficiency, project profitability, and client billing.
-
Simplified Reporting & Dashboards : Get instant, visual reports using pre-built templates to monitor billable hours, project progress, and user productivity without navigating Clockify's built-in reports.
-
Custom Metrics & Granular Control : Go beyond standard time reports by creating custom visualizations and metrics to analyze time duration, cost rates, and billability based on projects, clients, and tasks.
-
Data Blending & Cross-Channel Analysis : Combine granular Clockify time entry data with financial, CRM, and other operational data from other sources to understand the true cost and profitability of your projects.
📋 Steps to Integrate your Clockify account to Whatsdash
✔️ Navigate to the 'Integrations' page using the Navigation bar.
✔️ Select Clockify from the Available Integrations.
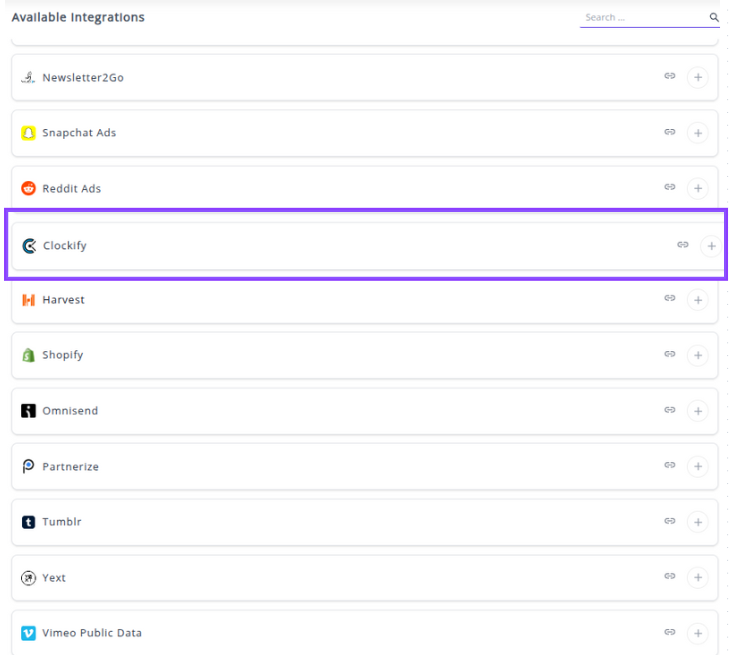
✔️ Click the "+" button to open the Klaviyo sign-in Page window.

✔️ You now need to retrieve your Clockify API Key:
1. Log in to your Clockify account. 2. Go to your Profile Settings. 3. Locate the Manage API Keys section and click "GENERATE NEW" button 4. Copy the generated API Key.
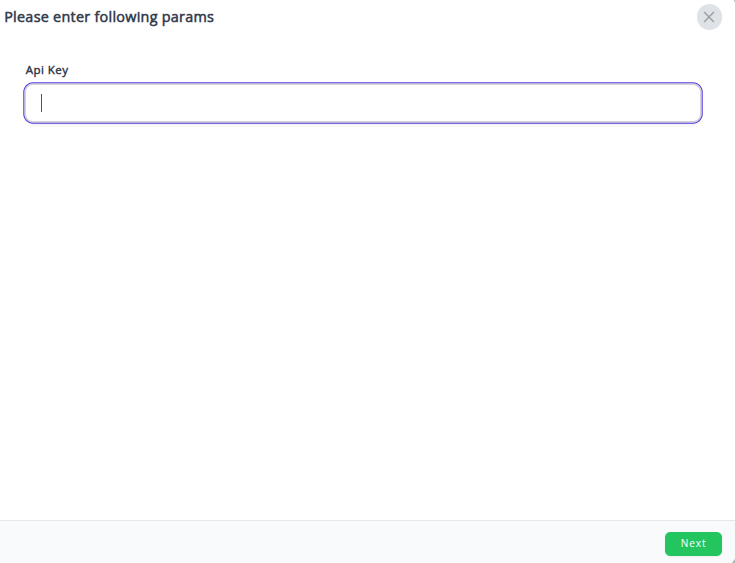
✔️ Paste the copied API Key into the input field in the Whatsdash popup window and click Next button.
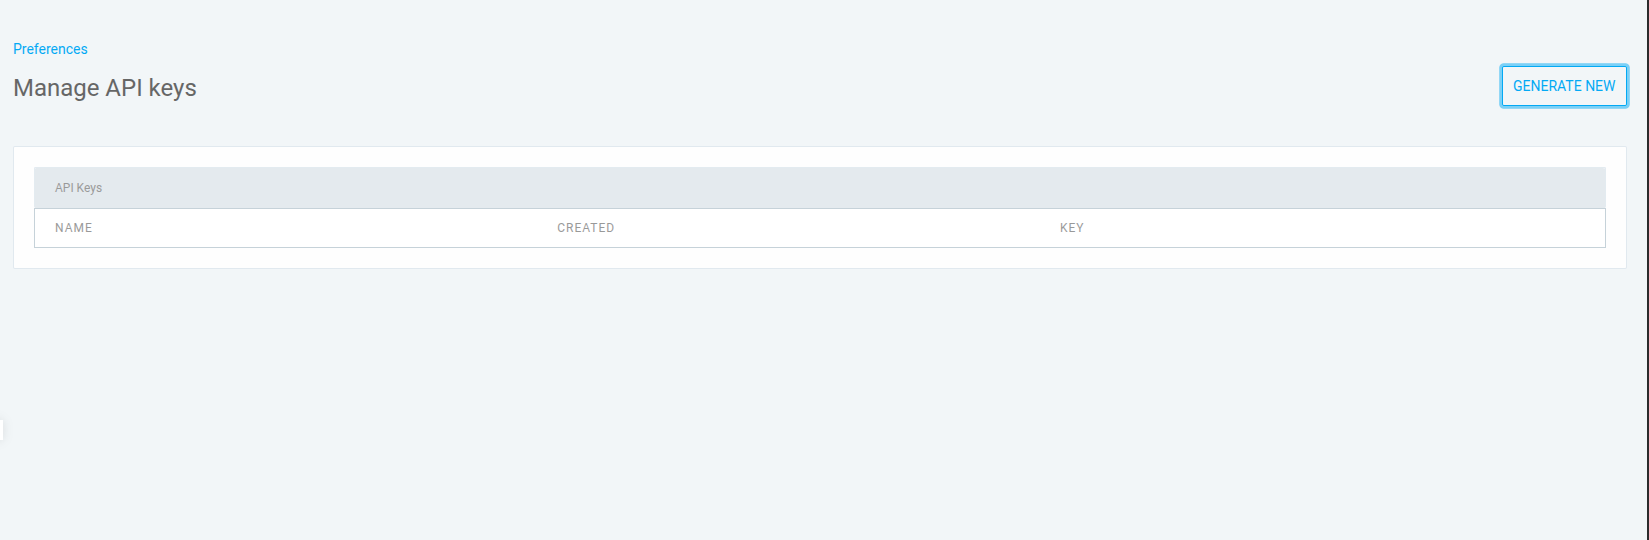
✔️ Once authenticated, you will be directed back to Whatsdash. Your Clockify Integration will appear in the Connected Integrations list.
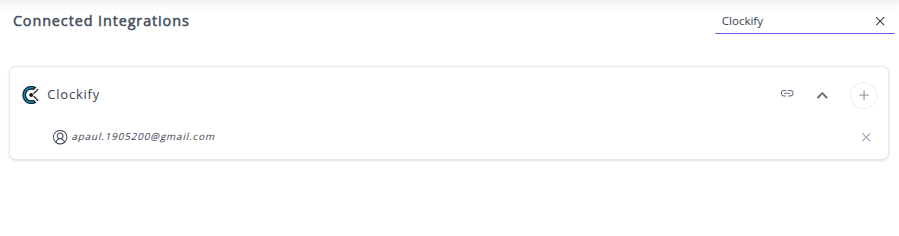
✔️ You can now create or customize dashboards using your Clockify Metrics and Dimensions.
👉 How to visualize this data in your dashboard, visit the Dashboard Documentation Guide
🔗 Clockify Metrics
The table below lists the Clockify Metrics available through the Whatsdash Clockify Integration.
| Name | Category | Why It's Useful |
|---|---|---|
| Time Entity Duration | Time Entries | Measures the duration of each time entry, critical for accurate billing and reporting. |
| Time Entries Hourly Rate | Time Entries | Captures the hourly rate for work performed, used to calculate costs and invoices. |
| Time Entries Cost Rate | Time Entries | Tracks internal cost per hour for employees or contractors for budgeting and profitability analysis. |
| Project Duration | Project | Tracks the total duration of a project, useful for project management and performance analysis. |
| Budget Estimate | Project | Represents the estimated budget for a project, helping in planning and resource allocation. |
| Project Hourly Rate | Project | Records the hourly rate for a project, essential for client billing and revenue tracking. |
| Project Cost Rate | Project | Captures the internal cost rate for a project, useful for profitability and cost management. |
🔗 Clockify Dimensions
The table below lists the Clockify Dimensions available through the Whatsdash Clockify Integration.
| Name | Category | Why It's Useful |
|---|---|---|
| Description | Time Entries | Provides context about what a specific time entry represents. |
| Type | Time Entries | Identifies whether a time entry is regular work, a break, holiday, or time off — essential for accurate reporting. |
| Name | Project | Displays the name of the project associated with a time entry, useful for project-based tracking. |
| Color | Project | Helps visually distinguish projects by assigning color codes. |
| Client Name | Project | Associates projects with specific clients, enabling client-based reporting and billing. |
| Note | Project | Captures additional details or comments about a project for better context. |
🔗 Explore More Integrations
Whatsdash supports a wide range of marketing, analytics, and eCommerce integrations to give you a holistic view of your business performance.
👉 Visit the Integrations Page to explore all available connections
Harvest
Harvest is a leading time tracking and invoicing software that helps businesses accurately track time, manage project budgets, and streamline the client billing process. It provides comprehensive reporting to give you a clear view of your team's utilization and project profitability.
Why Connect Harvest to Whatsdash?
Integrating your Harvest data with Whatsdash transforms raw time logs into visually clear, actionable business insights, making it simple to manage project profitability, team efficiency, and client invoicing.
-
Simplified Reporting & Dashboards : Get instant, visual reports using pre-built templates to monitor billable hours, project budget utilization, and uninvoiced revenue without manually running reports in Harvest.
-
Custom Metrics & Granular Control : Go beyond standard reports by creating custom visualizations and custom metrics to analyze time duration, cost rates, and profitability based on team members, clients, and tasks.
-
Data Blending & Cross-Channel Analysis : Combine granular Harvest time entry and expense data with financial, CRM, and other operational data from other sources to understand the true cost and ROI of your projects.
📋 Steps to Integrate your Harvest account to Whatsdash
✔️ Navigate to the 'Integrations' page using the Navigation bar.
✔️ Select Harvest from the Available Integrations.
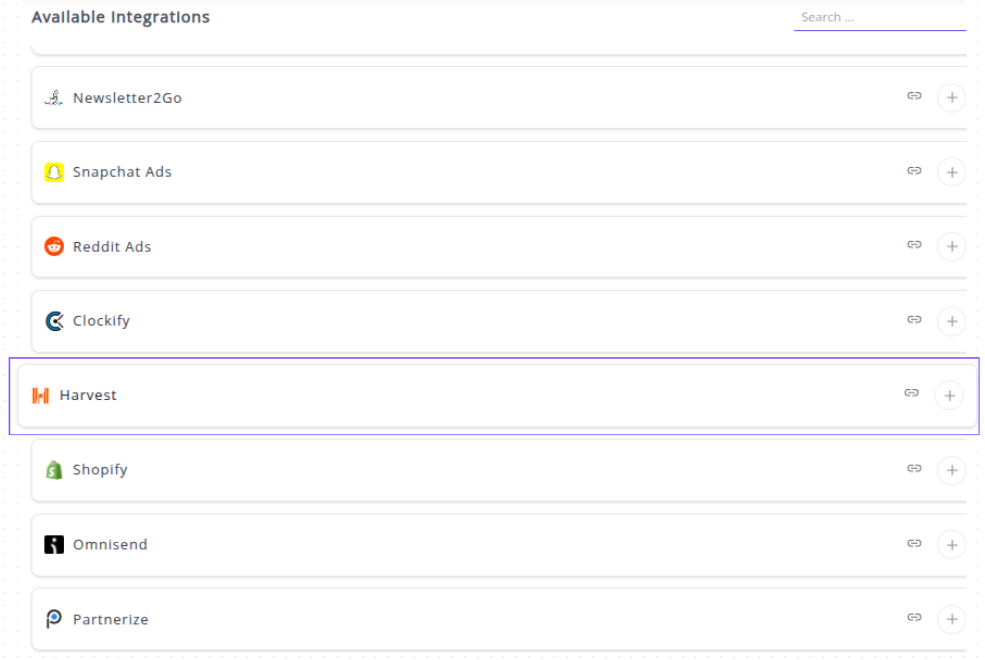
✔️ Click the "+" button to open the authorization window.

Note: Harvest uses a secure OAuth 2.0 connection, which will redirect you to the Harvest login page.
✔️ You will be redirected to the Harvest login page.
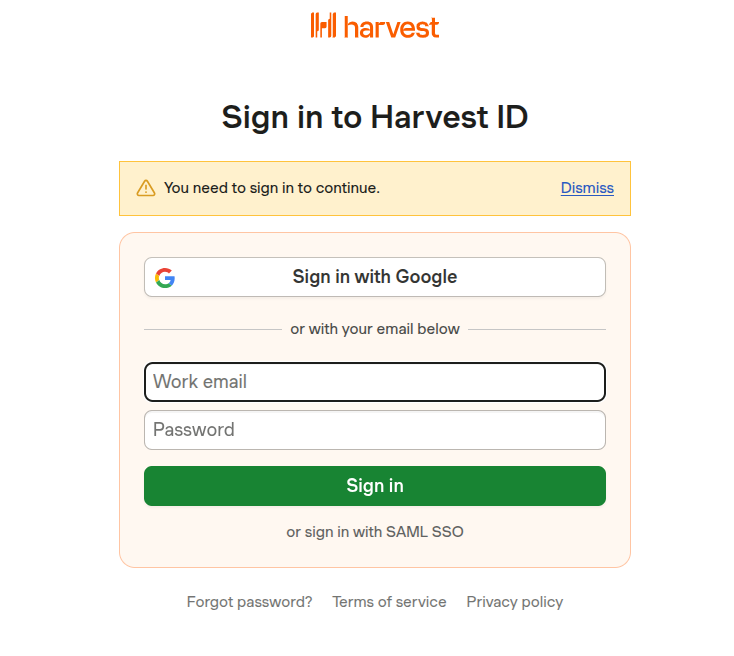
- Enter your Email Address and Password for your Harvest account.
- Click Log In.
✔️ Once authenticated, you will be directed back to Whatsdash. Your Harvest Integration will appear in the Connected Integrations list.
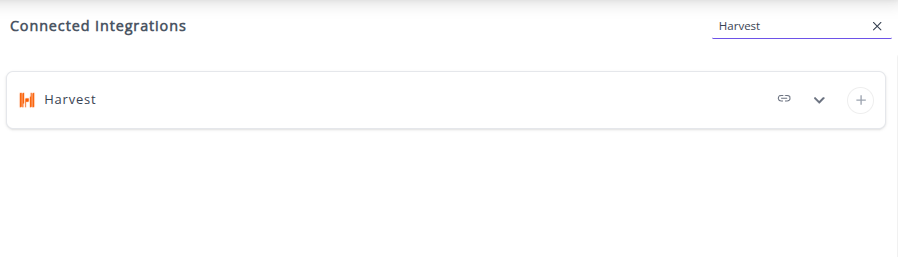
✔️ You can now create or customize dashboards using your Harvest Metrics and Dimensions.
👉 How to visualize this data in your dashboard, visit the Dashboard Documentation Guide.
🔗 Harvest Metrics
The table below lists the Harvest Metrics available through the Whatsdash Harvest Integration.
| Name | Category | Why It's Useful |
|---|---|---|
| Project Budget | Profile | Shows the total budget for a project, critical for financial planning and tracking project costs. |
| Profile Cost Budget | Profile | Total cost budget for a profile, important for managing expenses and profitability. |
| Hours | Time Entries | Total hours recorded, essential for tracking time spent on tasks and projects. |
| Fee | Profile | Total fee for a profile, used for billing and revenue tracking. |
| Billable | Time Entries | Indicates if time entries are billable, necessary for invoicing clients. |
| Hours Without Timer | Time Entries | Total hours logged without a timer, helps identify manual entries or untracked work. |
| Rounded Hours | Time Entries | Hours rounded to the nearest whole number, useful for simplified reporting and billing. |
| Hourly Rate | Profile | Hourly rate associated with a profile, needed for calculating fees and revenue. |
| Hourly Rate | Time Entries | Hourly rate applied to specific time entries, used for accurate billing and cost calculation. |
🔗 Harvest Dimensions
The table below lists the Harvest Metrics available through the Whatsdash Harvest Integration.
| Name | Category | Why It's Useful |
|---|---|---|
| Is Fixed Fee | Profile | Shows whether the project/profile has a fixed fee, important for billing and contract management. |
| Budget Is Monthly | Profile | Indicates if the budget is allocated monthly, helping track recurring budgets and financial planning. |
| Billable | Time Entries | Marks whether time entries are billable, essential for client invoicing. |
| Task Name | Time Entries | The name of the task for each entry, useful for task-level tracking and reporting. |
| Hourly Rate | Time Entries | Hourly rate for user assignments, needed for calculating costs and invoices. |
| Client Name | Profile | The name of the client, used for reporting and project-client association. |
| Is Billed | Time Entries | Shows if the time entry has been billed, helps in tracking invoicing status. |
| Project Name | Time Entries | Name of the associated project, useful for project-level reporting. |
| Started Time | Time Entries | Start timestamp of the entry, necessary for time tracking and duration calculations. |
| Updated At | Time Entries | Timestamp of the last update, useful for auditing changes. |
| User Name | Time Entries | Name of the user who logged the entry, important for accountability and reporting. |
| Bill By | Profile | Method by which the project/profile is billed, needed for proper invoicing strategy. |
| Budget By | Profile | How budget is allocated (criteria/method), essential for resource and financial planning. |
| Cost Budget Includes Expenses | Profile | Indicates whether expenses are included in cost budget, important for accurate financial tracking. |
| Created At | Profile | Timestamp when profile/project was created, useful for audit and project lifecycle tracking. |
| Is Billable | Profile | Whether the profile/project is billable, crucial for revenue recognition. |
| Name | Profile | Name of the profile/project, used for identification and reporting. |
| Starts On | Profile | Project/profile start date, essential for scheduling and planning. |
| Client ID | Time Entries | Unique client identifier, used for linking entries to clients. |
| Client Name | Time Entries | Name of client for time entries, helps in client-level reporting. |
| Cost Rate | Time Entries | Cost rate associated with time entries, needed for expense and profitability analysis. |
| Created At | Time Entries | Timestamp when the entry was created, useful for auditing. |
| Is Project Manager | Time Entries | Indicates if the user is project manager, used for role-based reporting. |
| Project ID | Time Entries | Unique identifier for the project, important for linking time entries. |
| Client ID | Profile | Unique client identifier for profile, useful for project-client mapping. |
| Currency | Profile | Currency of the client/profile, necessary for billing and finance. |
| Ends On | Profile | Project/profile end date, needed for scheduling and reporting. |
| ID | Profile | Unique identifier for profile/project, used internally for reference. |
| Notes | Profile | Additional notes for profile/project, useful for context or instructions. |
| Updated At | Profile | Timestamp when profile/project was last updated, useful for auditing. |
| Ended Time | Time Entries | End timestamp for the time entry, necessary for duration calculations. |
| Notes | Time Entries | Notes for the entry, useful for context or task-specific details. |
| Spent Date | Time Entries | Date when the time was spent, essential for daily tracking and reporting. |
| Task Assignment Hourly Rate | Time Entries | Hourly rate for task assignment, used for calculating costs. |
| Task Assignment ID | Time Entries | Unique identifier for task assignment, useful for linking and reporting. |
| ID | Time Entries | Unique identifier for the time entry, critical for database operations. |
| User ID | Time Entries | Unique identifier for the user, necessary for user-level reporting and tracking. |
🔗 Explore More Integrations
Whatsdash supports a wide range of marketing, analytics, and eCommerce integrations to give you a holistic view of your business performance.
👉 Visit the Integrations Page to explore all available connections
Shopify
Shopify is the leading global commerce platform that allows businesses to create online stores and manage all aspects of their retail operations, including sales, marketing, payments, and shipping. It provides an essential foundation for selling products and services both online and in person.
Why Connect Shopify to Whatsdash?
Integrating your Shopify store's data with Whatsdash transforms raw sales, customer, and product information into clear, financial, and operational insights, helping you optimize your eCommerce performance and profitability.
-
Simplified Reporting & Dashboards : Get instant, visual reports using pre-built templates to monitor sales over time, top-selling products, and customer retention without navigating Shopify's detailed backend reports.
-
Custom Metrics & Granular Control : Go beyond standard metrics by creating custom visualizations to analyze Average Order Value (AOV), Gross Merchandise Value (GMV), Refund Rates, and profit margins based on specific products, variants, or customer segments.
-
Data Blending & Cross-Channel Analysis : Blend granular Shopify transaction data with website traffic from GA4 and ad spend data from Google Ads or Facebook Ads to calculate the true Return on Ad Spend (ROAS) and Customer Acquisition Cost (CAC).
-
Advanced eCommerce Reporting & Analysis : Access dedicated, deep-dive reports that go beyond surface-level metrics. To access these dedicated insights and pre-built templates,
Visit the Shopify Advanced Reports Section.
📋 Steps to Integrate your Shopify account to Whatsdash
✔️ Navigate to the 'Integrations' page using the Navigation bar.
✔️ Select Shopify from the Available Integrations.
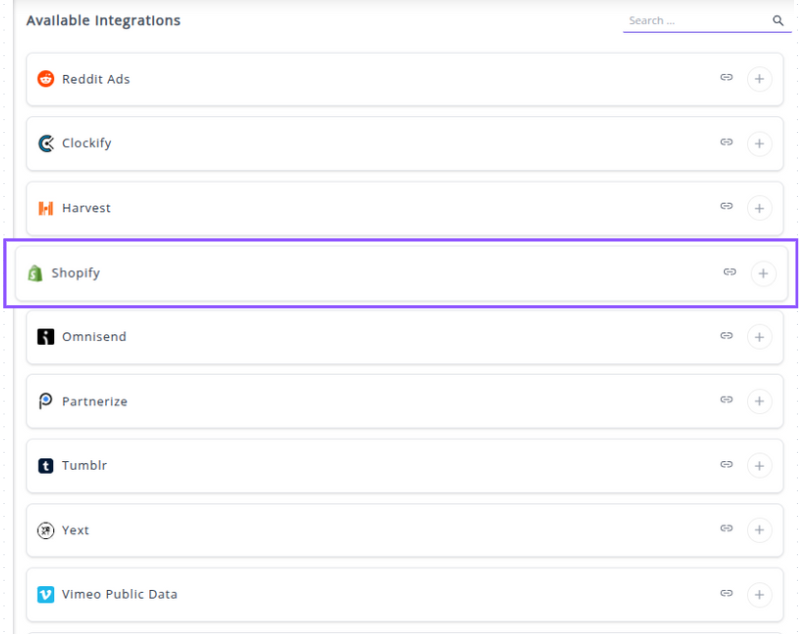
✔️ Click the + button to open the popup window.
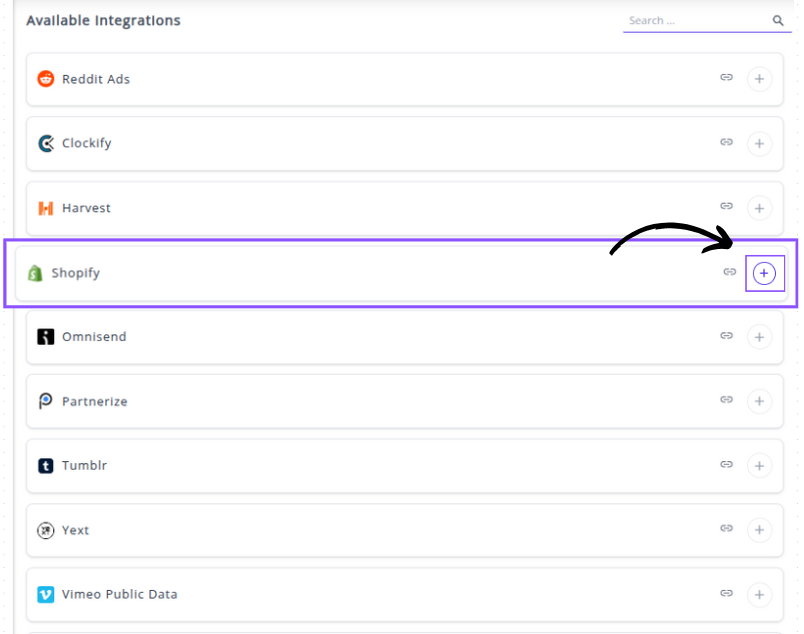
✔️ Enter your Shopify Subdomain and click Next:
- In the popup window, enter your store's full MyShopify URL (e.g., your-store-name.myshopify.com).
- Click Next.
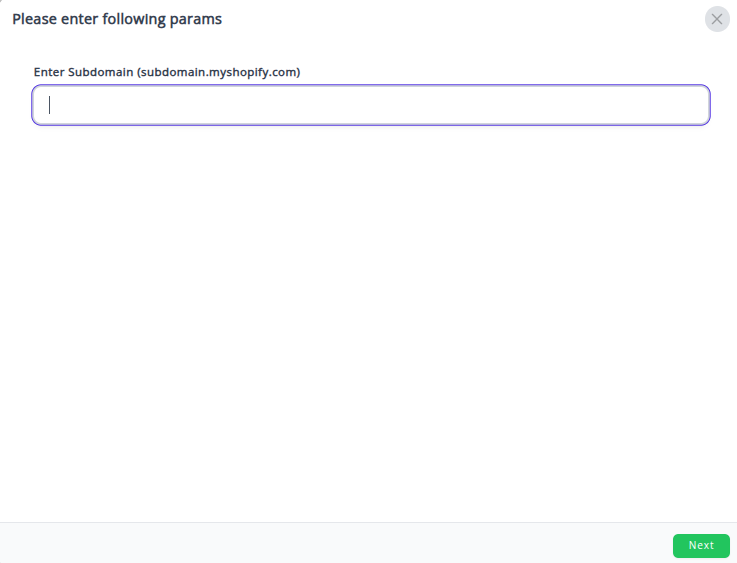
✔️ Authorize the Connection:
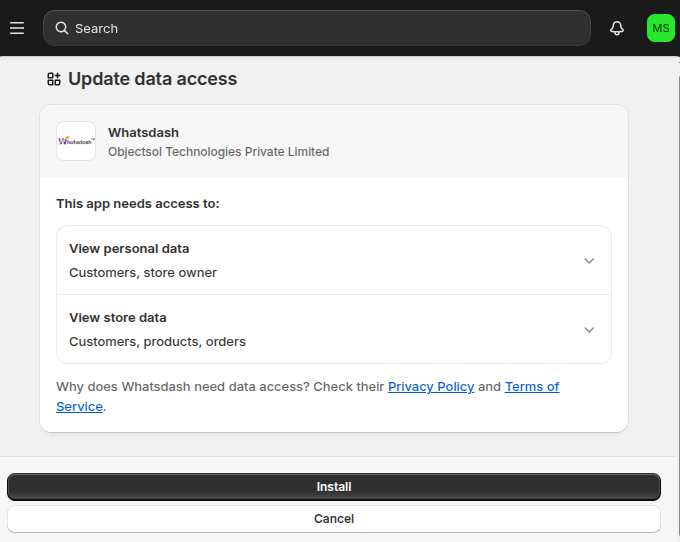
- You will be re-directed to the official Shopify login page.
- Log in with your Store Owner credentials.
- Shopify will prompt you to review and Install the Whatsdash app, granting it the necessary permissions to read your sales, customer, and product data.
✔️ Once authenticated and installed, you will be directed back to Whatsdash. Your Shopify Integration will appear in the Connected Integrations list.
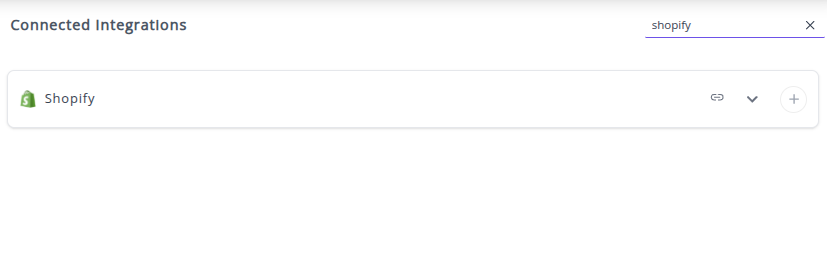
✔️ You can now create or customize dashboards using your Shopify Metrics and Dimensions.
👉 How to visualize this data in your dashboard, visit the Dashboard Documentation Guide
🔗 Dedicated Advanced Shopify Reports
This feature goes beyond standard metrics and dimensions by offering in-depth reporting tools designed specifically for complex eCommerce analysis.
Whatsdash's Advanced Shopify Reports provides deep-dive reports on crucial performance indicators that require sophisticated data modeling, including:
-
Customer Lifetime Value (CLV): Understand the long-term revenue potential of different customer segments.
-
Cohort Analysis: Track customer behavior and retention over time to measure the effectiveness of acquisition channels and marketing campaigns.
-
Product Profitability by Variant: Gain precise financial visibility into which specific product versions (size, color, etc.) are the most profitable after accounting for costs.
To access these powerful analytical tools, dedicated insights, and pre-built templates, visit the Shopify Advanced Reports Page.
🔗 Shopify Metrics
The table below lists the Shopify Metrics available through the Whatsdash Shopify Integration.
| Name | Category | Why It's Useful |
|---|---|---|
| Customer Lifetime Value (CLTV) | Customer Value | Helps identify the total revenue a customer is expected to generate, useful for retention and marketing strategies. |
| Average Purchase Value (APV) | Customer Value | Shows the average spend per purchase, useful for pricing and promotion strategies. |
| Average Purchase Frequency Rate (APFR) | Customer Value | Indicates how often customers make purchases, useful for loyalty programs and forecasting. |
| Customer Value (CV) | Customer Value | Overall value of a customer, combining frequency and average purchase value, important for segmenting customers. |
| Average Customer Lifespan (ACL) | Customer Value | Average duration a customer stays active, useful for long-term revenue projections. |
| Product Variant Count | Product | Number of variants of a product, useful for inventory management and assortment planning. |
| Product Variant Price | Product | Price of a product variant, used for revenue calculations and pricing strategies. |
| Product Variant Inventory Quantity | Product | Stock quantity across all locations, critical for inventory planning. |
| Product Variant Inventory Value | Product | Total inventory value (quantity × price), helps assess inventory cost and investment. |
| Order Line Items Count | Order | Number of items per order, useful for order complexity and fulfillment planning. |
| Order Count | Order | Total number of orders, key for sales tracking and demand analysis. |
| Order Total Value | Order | Total order value including discounts, shipping, and taxes, critical for revenue measurement. |
| Order Avg. Sales | Order | Average sales per order, useful for understanding order behavior. |
| Order Avg. Line Items | Order | Average number of items per order, useful for insights into customer buying patterns. |
| Inventory Item Count | Inventory Item | Total number of inventory items, important for stock management. |
| Inventory Item Cost Per Item | Inventory Item | Unit cost per item, used for profitability analysis. |
| Gross Sales | Sales | Total sales value, useful for revenue tracking before deductions. |
| Discounts | Sales | Total discounts given, necessary for net revenue calculation. |
| Net Sales | Sales | Total revenue after discounts and returns, key for financial reporting. |
| Returns | Sales | Value of returned orders, helps assess product issues and revenue impact. |
| Shipping | Sales | Total shipping charges, useful for logistics cost analysis. |
| Tax | Sales | Taxes collected, essential for accounting and compliance. |
| Total Sales | Sales | Net sales after adjustments, critical for overall revenue reporting. |
🔗 Shopify Dimensions
The table below lists the Shopify Dimensions available through the Whatsdash Shopify Integration.
| Name | Category | Why It's Useful |
|---|---|---|
| Product Tags | Product | Useful for filtering, search, and categorizing products for campaigns or analytics. |
| Product Title | Product | Name of the product, essential for display, reporting, and identification. |
| Product SKU | Product | Unique identifier for product variants, critical for inventory tracking and order fulfillment. |
| Product Variant Title | Product | Name of the variant, helps differentiate between multiple variants under the same product. |
| Product Description | Product | HTML-formatted description, useful for marketing, SEO, and customer information. |
| Product Vendor | Product | Vendor or supplier of the product, helps in vendor performance analysis. |
| Product Type | Product | Categorization for filtering and searching, useful for segmenting products. |
| Product ID | Product | Unique identifier across Shopify, essential for linking variants and analytics. |
| Product Variant ID | Product | Unique identifier for the variant, helps with inventory and order mapping. |
| Product Images Source | Product | URL of product images, used for frontend display and marketing. |
| Order Notes | Order | Optional notes added by shop owners, useful for internal processing or special instructions. |
| Order ID | Order | Unique identifier for the order, critical for tracking and reporting. |
| Order Name | Order | Display name of the order, used for customer communication and reporting. |
| Order Shipping Address1/2 | Order | Street address lines, essential for fulfillment and delivery. |
| Order Shipping City/Province/Country | Order | Shipping location details, critical for logistics, tax calculations, and regional analysis. |
| Order Shipping Post Code | Order | Postal code, used for delivery and regional reporting. |
| Order Shipping Phone | Order | Contact number for delivery purposes. |
| Order Billing Address1/2 | Order | Billing street addresses, essential for invoicing and financial reporting. |
| Order Billing City/Province/Country | Order | Billing location details, useful for financial reporting and compliance. |
| Order Billing Post Code | Order | Billing postal code, useful for tax and payment validation. |
| Order Billing Phone | Order | Customer contact for billing inquiries. |
| Order Email | Order | Customer email, used for communication and customer analytics. |
| Order Discount Code | Order | Applied discount codes, useful for promotion performance tracking. |
| Order Confirmed | Order | Boolean to indicate if inventory is reserved, helps with fulfillment status checks. |
| Order Channel | Order | Source of checkout, useful for attribution and marketing channel analysis. |
| Order Financial Status | Order | Payment status (paid, pending), essential for accounting and revenue recognition. |
| Order Fulfillment Status | Order | Indicates whether items are fulfilled, important for logistics and customer service. |
| Order Tags | Order | Comma-separated tags for filtering and analysis, useful for categorization. |
| Order Currency Code | Order | ISO currency code, essential for multi-currency reporting. |
| Line Item Is Gift Card | Line Items | Boolean indicating if a line item is a gift card, useful for product type reporting. |
| Month | Time | Month of the order or event, useful for trend analysis and reporting. |
| Day Of Week Name | Time | Day of the week (e.g., Tuesday), useful for weekly pattern analysis. |
| Day Of Week Name(ISO) | Time | Day of the week (ISO format), used for consistent international reporting. |
| Year | Time | Year, essential for yearly reports. |
| Year Month | Time | Year and month combined, useful for monthly trend analysis. |
| Year Week | Time | Year and week, useful for weekly reports and seasonal analysis. |
| Year Of Week | Time | Year associated with the week, used for weekly reporting. |
| Year Of Week(ISO) | Time | Year for ISO week, ensures consistent week-year mapping internationally. |
| Week(ISO) | Time | ISO week number, used for trend analysis across weeks. |
| Day Of Month | Time | Day of the month, helpful for daily reporting and trend detection. |
| Date | Time | Complete date (YYYYMMDD), essential for date-specific analysis. |
🔗 Explore More Integrations
Whatsdash supports a wide range of marketing, analytics, and eCommerce integrations to give you a holistic view of your business performance.
👉 Visit the Integrations Page to explore all available connections
Omnisend
Omnisend is a powerful email, SMS, and marketing automation platform built specifically for eCommerce, enabling businesses to manage and optimize customer engagement, conversion, and retention across multiple channels.
Why Connect Omnisend to Whatsdash?
Integrating your Omnisend data with Whatsdash transforms your campaign, automation, and segmentation data into clear, actionable reports, making it easier to measure marketing ROI and optimize customer journeys.
-
Simplified Reporting & Dashboards : Get instant, visual reports on Email Open Rates, Click-Through Rates (CTR), and Unsubscribes using pre-built templates without navigating Omnisend’s detailed campaign logs.
-
Custom Metrics & Granular Control : Go beyond standard engagement metrics by creating custom visualizations to analyze Revenue per Email Sent, Placed Order Rate from Automations, and Sales Attribution by campaign type.
-
Data Blending & Cross-Channel Analysis : Blend granular Omnisend campaign revenue with your Google Analytics (GA4) website traffic and Shopify sales data. Calculate the true performance of your email channels versus paid advertising.
📋 Steps to Integrate your Omnisend account to Whatsdash
✔️ Navigate to the 'Integrations' page using the Navigation bar.
✔️ Select Omnisend from the Available Integrations.
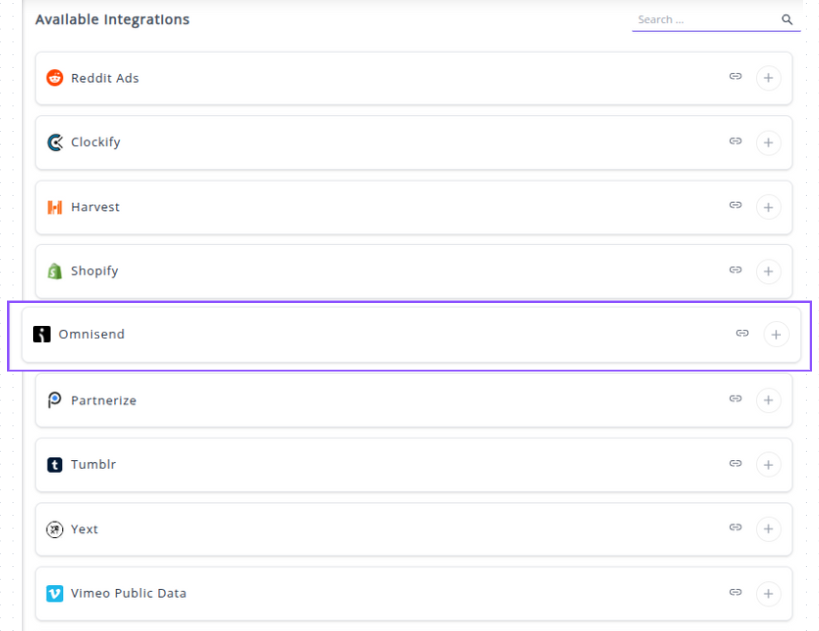
✔️ Click the + button to open the API key input window.
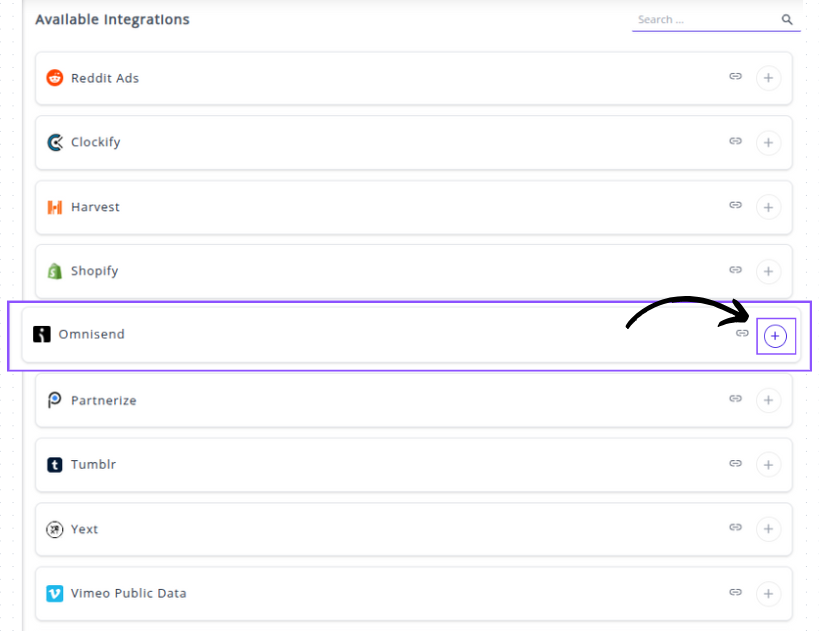
✔️ Generate your Omnisend API Key:

1. Log in to your Omnisend dashboard.
2. Navigate to Store Settings .
3. Find the API Keys section and click to Create API Key.
4. Give the key a clear name .
5. Ensure you select the necessary permissions.
6. Copy the newly generated key.
✔️ Complete the Integration in Whatsdash:

1. In the popup window, enter a descriptive Account Name for your Omnisend store.
2. Paste the copied API Key into the designated field.
3. Click Next button.
✔️ Once authenticated, you will be directed back to Whatsdash. Your Omnisend Integration will appear in the Connected Integrations list.
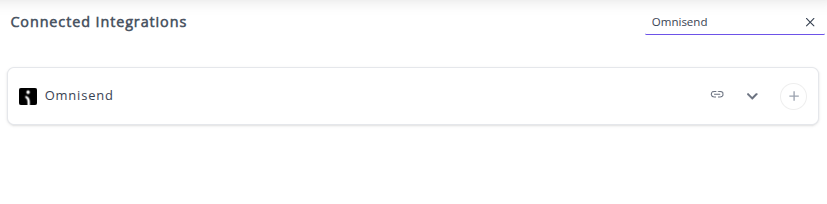
✔️ You can now create or customize dashboards using your Omnisend Metrics and Dimensions.
👉 How to visualize this data in your dashboard, visit the Dashboard Documentation Guide
🔗 Omnisend Metrics
The table below lists the Omnisend Metrics available through the Whatsdash Omnisend Integration.
| Name | Category | Why It's Useful |
|---|---|---|
| Email Sent | Campaign | Total emails successfully sent, key for tracking campaign reach and deliverability. |
| Email Bounced | Campaign | Number of emails that failed delivery, important to monitor list quality. |
| Email Opened | Campaign | Total emails opened, helps measure engagement and subject line effectiveness. |
| Email Clicked | Campaign | Total clicks on links, crucial for evaluating campaign interaction and content performance. |
| Email Unsubscribed | Campaign | Recipients who unsubscribed, helps identify potential audience dissatisfaction. |
| Email Complained | Campaign | Number of spam complaints, critical for maintaining sender reputation. |
| Email Open Rate | Campaign | Percentage of delivered emails opened, standard engagement metric to compare campaigns. |
| Email Click Rate | Campaign | Percentage of delivered emails clicked, shows link/content effectiveness. |
| Email Bounce Rate | Campaign | Percentage of undelivered emails, monitors list hygiene and deliverability. |
| Email Unsubscribe Rate | Campaign | Percentage of unsubscribes relative to sent emails, indicates campaign fatigue. |
| Email Complaint Rate | Campaign | Percentage of recipients who complained, helps track spam issues and compliance. |
🔗 Omnisend Dimensions
The table below lists the Omnisend Metrics available through the Whatsdash Omnisend Integration.
| Name | Category | Why It's Useful |
|---|---|---|
| Device | Campaign | Shows device type distribution for opened emails, useful for optimizing email design and targeting. |
| Campaign ID | Campaign | Unique identifier for the campaign, essential for tracking, reporting, and integration. |
| All Contacts | Campaign | Indicates if campaign was sent to all contacts or specific segments, useful for analyzing reach. |
| From Name | A/B Test / Campaign | Name displayed in the 'From' field, important for A/B testing and engagement analysis. |
| Email Subject | A/B Test / Campaign | Subject line of the email, critical for open rate performance and testing. |
| Campaign Name | Campaign | Name of the campaign, useful for reporting, tracking, and organizing campaigns. |
| Campaign Status | Campaign | Status of the campaign (sent, draft, etc.), helps monitor progress and workflow. |
| Campaign Type | Campaign | Type of email (standard, automated), useful for segmentation and performance analysis. |
| Segments | Campaign | Targeted segments for the campaign, helps measure audience-specific performance. |
| Excluded Segments | Campaign | Segments excluded from the campaign, useful for precision targeting and reporting. |
| Day Of Month | Time | Campaign send day (DD), useful for trend analysis by day. |
| Month | Time | Campaign send month (MM), helps identify monthly patterns. |
| Year | Time | Campaign send year (YYYY), important for yearly reporting. |
| Week | Time | Week number of the year (WW), useful for weekly trend analysis. |
| Week (ISO) | Time | ISO-standard week number, ensures consistent reporting internationally. |
| Day Of Week Name | Time | Full day name (Tuesday, etc.), helpful for weekly engagement analysis. |
| Day Of Week Name (ISO) | Time | ISO-standard day name, ensures consistency for multi-country reporting. |
| Year Of Week | Time | Year associated with the week, important for weekly-based reporting. |
| Year Of Week (ISO) | Time | ISO-standard year of the week, ensures consistency for ISO week analysis. |
| Year Month | Time | Year and month combined (YYYYMM), used for monthly trend analysis. |
| Year Week | Time | Year and week combined (YYYYWW), useful for weekly reporting. |
| Year Week (ISO) | Time | ISO-standard year and week (YYYYWW), ensures alignment with ISO week system. |
| Date | Time | Full campaign date (YYYYMMDD), essential for day-specific analytics. |
🔗 Explore More Integrations
Whatsdash supports a wide range of marketing, analytics, and eCommerce integrations to give you a holistic view of your business performance.
👉 Visit the Integrations Page to explore all available connections
Partnerize
Partnerize is a comprehensive partnership automation platform that enables leading brands to discover, manage, measure, and pay their entire ecosystem of partners, including affiliates, influencers, and strategic alliances.
Why Connect Partnerize to Whatsdash?
Integrating your Partnerize data with Whatsdash allows you to get a holistic view of your partnership marketing performance alongside data from your other channels (like Google Ads, GA4, and CRM), enabling smarter, data-driven decisions.
-
Centralized Performance View: Break down data silos by viewing clicks, conversions, order value, and commission alongside your other marketing, sales, and analytics data in a single dashboard.
-
Advanced Custom Reporting: Go beyond the standard platform reports. Use Partnerize Dimensions like Partner Name, Campaign ID, and Voucher Code to create highly customized dashboards and track specific programs or partner performance against overall business KPIs.
-
Accurate ROI Calculation: Blend Partnerize Metrics like Total Order Value and Total Commission with your ad spend to accurately calculate your Return On Ad Spend (ROAS) and marginal revenue across the entire customer journey.
📋 Steps to Integrate your Partnerize Account to Whatsdash
✔️ Navigate to the 'Integrations' page using the Navigation bar.
✔️ Select Partnerize from the Available Integrations.
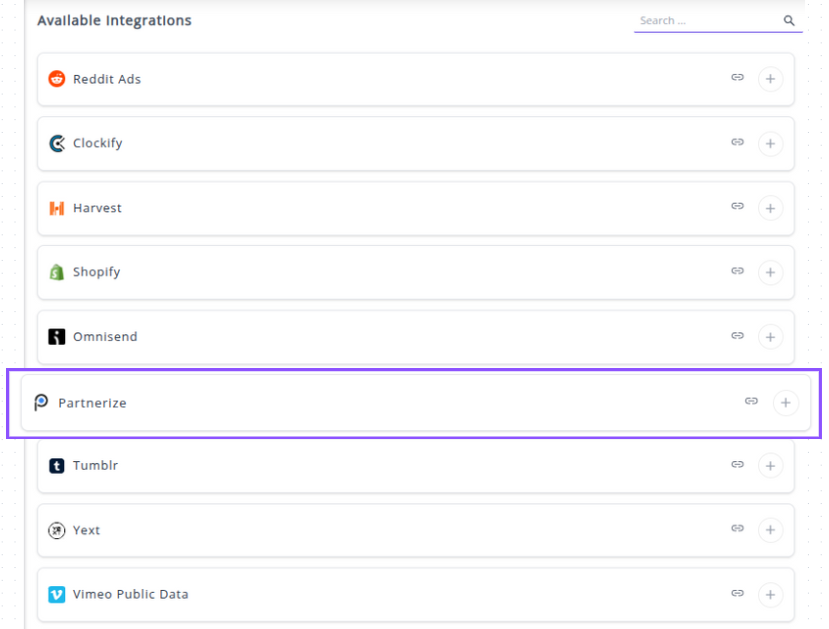
✔️ Click the + button. A popup window will appear asking for the Application Key, Api Key, and Publisher ID.

Whatsdash connects to Partnerize using a secure API that requires specific credentials generated within your Partnerize account.
✔️ Generate your Partnerize API Keys and ID complete the Integration in Whatsdash::

1. Paste the copied Application Key into the first input field.
2. Paste the copied Api Key into the second input field.
3. Paste the Publisher ID into the third input field.
4. Click Next button.
✔️ Once authenticated, you will be directed back to Whatsdash. Your Partnerize Integration will appear in the Connected Integrations list.
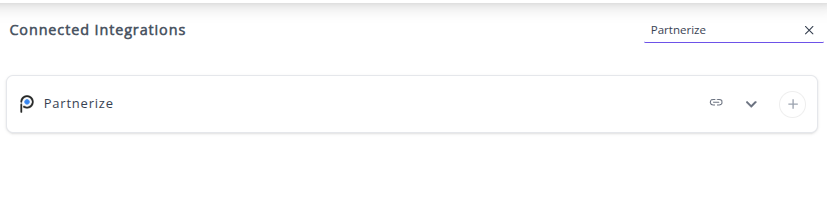
✔️ You can now create or customize dashboards using your Partnerize Metrics and Dimensions.
👉 How to visualize this data in your dashboard, visit the Dashboard Documentation Guide.
🔗 Partnerize Metrics
The table below lists the Partnerize Metrics available through the Whatsdash Partnerize Integration.
| Name | Category | Why It's Useful |
|---|---|---|
| Total Clicks | Clicks | Total number of clicks generated, useful for engagement measurement. |
| Total Unique Clicks | Clicks | Counts distinct users clicking, avoids double-counting and shows reach. |
| Total Clicks Converted | Clicks | Number of clicks that led to conversions, measures effectiveness. |
| Click Conversion Rate | Clicks | Percentage of clicks that converted, important for ROI and funnel analysis. |
| Total Conversions | Conversions | Total completed conversions, core KPI for campaigns. |
| Conversion Metric | Conversions | Custom metric to quantify conversions, helps track specific goals. |
| Conversion Type | Conversions | Type of conversion (purchase, signup, etc.), for goal segmentation. |
| Total Commission | Conversions | Total commission paid to partners, important for financial tracking. |
| Total Partner Commission | Conversions | Total earnings distributed to partners, key for partner management. |
| Percentage Partner Commission | Conversions | Percentage of conversion value given to partners, useful for payout analysis. |
| Average Partner Commission | Conversions | Average commission per partner, aids in performance comparison. |
| Percentage Average Partner Commission | Conversions | Average partner commission as a percentage, helps normalize data. |
| Total ROAS | Conversions | Total Return on Ad Spend, evaluates campaign profitability. |
| Average ROAS | Conversions | Average ROAS per conversion or campaign, useful for trend analysis. |
| e_cpa | Conversions | Effective cost per acquisition, measures cost efficiency. |
| Total Conversion Items | Conversions | Total number of items involved in conversions, useful for product-level analysis. |
| Average Order Size | Conversions | Average quantity/value per order, helps understand customer behavior. |
| Average Order Value | Conversions | Average revenue per order, key for financial insights. |
| Percentage Order Value | Conversions | Share of total order value, helps allocate performance. |
| Total Order Value | Conversions | Total revenue generated from orders, core revenue metric. |
| Total Impressions | Impressions | Number of times ads were viewed, measures campaign reach. |
| Currency | Conversions | The currency of conversion, important for financial reporting. |
🔗 Partnerize Dimensions
The table below lists the Partnerize Dimensions available through the Whatsdash Partnerize Integration.
| Name | Category | Why It's Useful |
|---|---|---|
| Browser Minor | All | Tracks minor browser version for analyzing compatibility and user experience. |
| Browser Major | All | Major browser version for identifying usage trends and targeting. |
| Browser Patch | All | Patch version for detailed browser analysis. |
| Browser Family | All | Browser type (Chrome, Firefox, etc.), useful for UI/UX and testing. |
| OS Major | All | Major OS version of users, helps in platform segmentation. |
| OS Minor | All | Minor OS version for detailed platform insights. |
| OS Patch | All | OS patch level, important for troubleshooting or targeting updates. |
| OS Family | All | Operating system type (Windows, macOS, Android), aids in segmentation. |
| Device | All | Device type (mobile, desktop, tablet), crucial for UX and targeting. |
| Country | Clicks | Geographic location of clicks, essential for regional analysis. |
| Traffic Source | All | Source of traffic (organic, paid, referral), measures campaign effectiveness. |
| Type | Clicks | Type of click event, helps in understanding user interaction. |
| Campaign | All | Identifies the campaign for performance tracking. |
| Creative | All | The specific creative/asset used, useful for A/B testing. |
| Partner | All | Partner or affiliate responsible for traffic or conversions, for ROI tracking. |
| User Context | All | Information about user session or environment, aids in behavioral analysis. |
| Advertiser Reference | All | Links clicks to the advertiser, important for multi-client reporting. |
| Partnership Model | All | Type of partner agreement, useful for financial modeling. |
| Date Time | All | Timestamp of event, fundamental for time-based analysis. |
| Category | Conversions | Product/service category associated with conversion, helps in segment analysis. |
| Customer Type | Conversions | Type of customer (new, returning), for retention and targeting. |
| SKU | Conversions | Product SKU involved in conversion, for inventory and sales tracking. |
| Conversion Type | Conversions | Type of conversion (purchase, signup), for goal measurement. |
| Conversion Metric | Conversions | Specific metric of conversion, enables KPI tracking. |
| Conversion Reference | Conversions | ID linking to specific conversion event, ensures traceability. |
| Conversion Status | Conversions | Status of conversion (completed, pending), for funnel monitoring. |
| Currency | Conversions | Currency of conversion, required for financial reporting. |
| Customer Reference | Conversions | ID of the customer converting, enables segmentation. |
| Voucher Code | Conversions | Code used for discounts, tracks promotional effectiveness. |
| Voucher Status | Conversions | Status of voucher (redeemed, expired), for promotion monitoring. |
🔗 Explore More Integrations
Whatsdash supports a wide range of marketing, analytics, and eCommerce integrations to give you a holistic view of your business performance.
👉 Visit the Integrations Page to explore all available connections
Tumblr
Tumblr is a microblogging and social networking platform that allows users to express themselves, discover content, and share posts consisting of text, images, videos, and more.
Why Connect Tumblr to Whatsdash?
Integrating your Tumblr account with Whatsdash allows you to bring your blog's performance data alongside your overall marketing and business metrics. This integration helps you streamline social media reporting and gain a deeper understanding of your content strategy's effectiveness.
-
Content Performance Analysis: Measure the engagement and reach of your multimedia content (photos, videos, text posts) to see what truly resonates with your audience.
-
Audience Insight: Track follower growth, engagement depth, and reblog patterns to better understand the behavior and preferences of your Tumblr community.
-
Unified Social Reporting: Centralize Tumblr Metrics like Post Engagement, Notes, and Followers with data from other social platforms and web analytics tools for a holistic marketing view.
📋 Steps to Integrate your Tumblr Account to Whatsdash
✔️ Navigate to the 'Integrations' page using the Navigation bar.
✔️ Select Tumblr from the Available Integrations.

✔️ Click the + button to open the credential input window. You will need to input your Consumer Key and Consumer Secret.

✔️ Authorize Whatsdash Access:

1. You will be redirected to the official Tumblr login page.
2. Log in to the Tumblr account that owns the blog you wish to analyze.
3. Tumblr will display an authorization screen, asking you to grant Whatsdash permission to Read your blog data.
4. Click Allow to allow the connection.
✔️ Once authenticated, you will be directed back to Whatsdash. Your Tumblr Integration will appear in the Connected Integrations list.
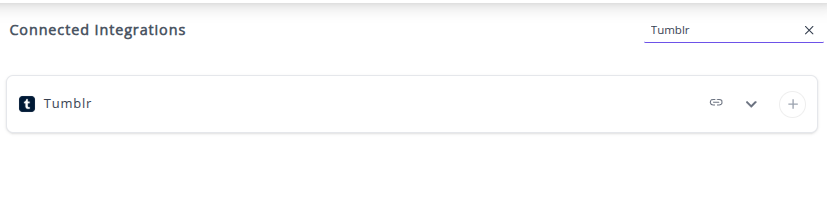
✔️ You can now create or customize dashboards using your Tumblr Metrics and Dimensions.
👉 How to visualize this data in your dashboard, visit the Dashboard Documentation Guide.
🔗 Tumblr Metrics
The table below lists the Tumblr Metrics available through the Whatsdash Tumblr Integration.
| Name | Category | Why It's Useful |
|---|---|---|
| Likes | blog | Total likes a blog has received; indicates popularity and engagement. |
| Total Posts | blog | Total posts on a blog; useful for measuring content volume and activity. |
| Note Count | post | Total notes (likes, reblogs, comments) on a post; shows engagement per post. |
| Posts | blog | Total posts on the blog (from API response); helps track overall content output. |
🔗 Tumblr Dimensions
The table below lists the Tumblr Dimensions available through the Whatsdash Tumblr Integration.
| Name | Category | Why It's Useful |
|---|---|---|
| Post ID | post | Unique identifier for each post, essential for tracking and referencing posts. |
| Can Like | post | Shows if a user can like the post, useful for engagement analysis. |
| Format | post | The post format (text, photo, quote, etc.), helps categorize content. |
| Is Blocks Post Format | post | Indicates if the post uses blocks format, relevant for content layout analysis. |
| Post URL | post | Direct URL to the post, needed for sharing or linking. |
| Short URL | post | Shortened URL, useful for social sharing. |
| Reblog Key | post | Key for reblogging, needed for content distribution tracking. |
| Can Reblog | post | Indicates if a post can be reblogged, measures user interaction potential. |
| Can Reply | post | Shows if users can reply, useful for monitoring engagement. |
| Can Send in Message | post | Indicates if a post can be shared via messages, useful for viral potential. |
| Blog Name | blog | The display name of the blog, identifies content source. |
| Blog URL | blog | Direct link to the blog, useful for attribution and navigation. |
| Blog Description | blog | Summary of blog content, helps understand context and theme. |
| Ask Enabled | blog | Shows if users can ask questions, useful for interaction tracking. |
| Anonymous Ask Enabled | blog | Indicates if anonymous questions are allowed, adds insight into user behavior. |
| Can Subscribe | blog | Shows if users can subscribe, important for audience growth metrics. |
| NSFW Status | blog | Indicates adult content, needed for content compliance. |
| Share Likes | blog | Shows if likes can be shared, useful for engagement measurement. |
| Ask Page Title | blog | Title of the ask page, used for customizing the user experience. |
| Post Title | post | The title of the post, helpful for content summary and search. |
| Summary | post | Brief excerpt of post content, useful for previews. |
| Recommended Source | post | Suggested source attribution, relevant for content management. |
| Recommended Color | post | Suggested color for post display, used for branding or themes. |
| Tags | post | List of post tags, important for categorization and discovery. |
| State | post | Current status (published/draft/deleted), needed for workflow management. |
| Timestamp | post | When the post was created or published, essential for temporal analysis. |
| Display Avatar | post | Indicates if blog avatar is shown, relevant for visual presentation. |
| Year | Time | Year of the post/blog, useful for time-based analysis. |
| Month | Time | Month of the post/blog, helps with monthly trends. |
| Day Of Month | Time | Day of the post/blog, supports daily analytics. |
| Week | Time | Week number, useful for weekly reporting. |
| Week(ISO) | Time | ISO-compliant week number, supports standard time calculations. |
| Day Of Week Name | Time | Name of the day (e.g., Tuesday), helpful for weekly pattern analysis. |
| Day Of Week Name(ISO) | Time | ISO day name, standardizes weekday reporting. |
| Year Week | Time | Year + Week combination, useful for weekly trend tracking. |
| Year Week(ISO) | Time | ISO year-week, aligns with international standards. |
| Year Of Week | Time | Year corresponding to week number, for time series. |
| Year Of Week(ISO) | Time | ISO-compliant year of week, standardizes reporting. |
| Year Month | Time | Year + Month, used for monthly aggregations. |
🔗 Explore More Integrations
Whatsdash supports a wide range of marketing, analytics, and eCommerce integrations to give you a holistic view of your business performance.
👉 Visit the Integrations Page to explore all available connections
Yext
Yext is a Digital Presence Platform that helps businesses manage their brand facts and data across a global network of search engines, maps, apps, social media, and third-party publisher sites. It ensures your business information is consistent and accurate everywhere consumers search.
Why Connect Yext to Whatsdash?
Integrating your Yext data with Whatsdash centralizes the performance of your entire digital presence, turning listings, reviews, and search-driven actions into clear, consolidated metrics.
-
Centralized Local Performance: Track how consumers are interacting with your business listings (views, clicks for calls/directions/website) across major publishers like Google, Apple, and Facebook, all from a single Whatsdash dashboard.
-
Review and Reputation Management: Monitor real-time review volume, average ratings, and key sentiment keywords for all your locations, allowing you to quickly identify areas for service improvement.
-
Unify Search-Driven Insights: Combine your Yext Listing Actions and Search Query data with your website traffic (GA4) and advertising spend to understand the true cross-channel customer journey and ROI.
-
Automated Multi-Location Reporting: Easily create high-level dashboards for corporate stakeholders or detailed, location-specific reports without complex manual exports.
📋 Steps to Integrate your Yext Account to Whatsdash
✔️ Navigate to the 'Integrations' page using the Navigation bar.
✔️ Select Yext from the Available Integrations.
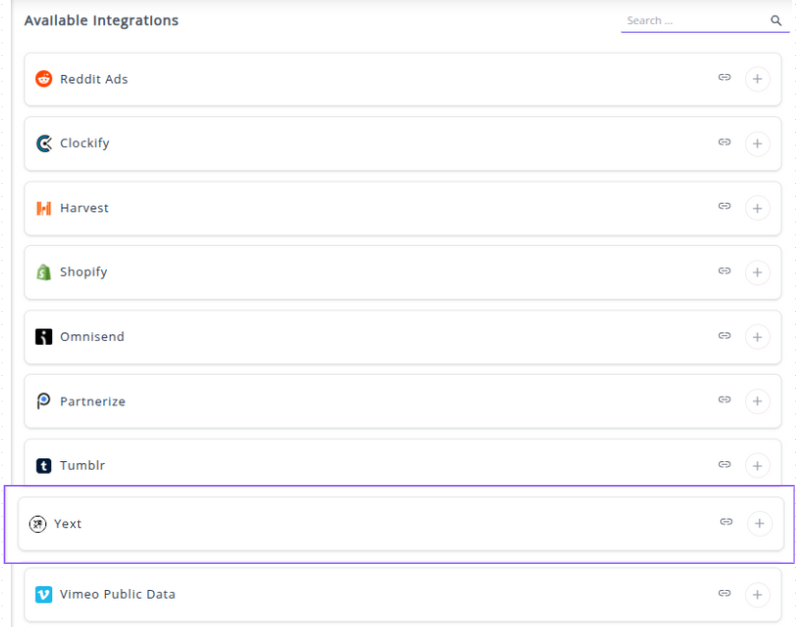
✔️ Click the + button to open the credential input window.

✔️ Generate your Yext API Credentials:
1. Log in to your Yext account.
2. Navigate to the Developer Console or Settings section to find your API Keys.
3. Generate or locate your Read-Only API Key and Account ID.
Note: Whatsdash only requires read access to your analytics data.
✔️ Complete the Integration in Whatsdash:

Paste the copied API Key and your Account ID into the input window in Whatsdash.
Click Next button to connect with Whatsdash.
✔️ Once authenticated, your Yext Integration will appear in the Connected Integrations list.
✔️ You can now create or customize dashboards using your Yext Metrics and Dimensions.
👉 How to visualize this data in your dashboard, visit the Dashboard Documentation Guide.
🔗 Yext Metrics
The table below lists the Yext Metrics available through the Whatsdash Yext Integration.
| Name | Category | Why it’s Useful |
|---|---|---|
| Average Chat Steps Completed | Chat | Measures how many steps users go through with the bot, useful for optimizing conversation flow. |
| Chat Thumbs Down Rate | Chat | Tracks user dissatisfaction with bot responses to improve AI quality. |
| Chat Total Thumbs Up | Chat | Measures positive user feedback for bot responses to gauge performance. |
| Data Match Rate | Chat | Shows how often the bot provides relevant information, highlighting AI accuracy. |
| Goal Match Rate | Chat | Determines effectiveness of the bot in fulfilling user intents. |
| Total Conversion Value | Conversion | Tracks monetary impact of conversions for ROI analysis. |
| Event Profile Views | Event Listings | Measures engagement by tracking views of full event profiles. |
| Facebook Event New RSVPs | Event Listings | Tracks new RSVPs to Facebook events for event success monitoring. |
| Apple Place Card Views | Event Listings | Shows how often Apple listings are viewed, including non-search interactions. |
| Bing Searches | Event Listings | Indicates visibility of listings on Bing search results. |
| Average Rating | Reviews | Provides an overall rating trend of your business. |
| Keyword Sentiment | Reviews | Measures sentiment for specific keywords in reviews to understand perception. |
| Response Count | Reviews | Shows how many reviews have been responded to, useful for engagement tracking. |
| Response Rate | Reviews | Tracks the percentage of reviews responded to, indicating responsiveness. |
| Searches Clicks | Search | Measures how often content is clicked, helping optimize search engagement. |
| Searches | Search | Counts the total searches performed, useful to gauge user activity. |
| Searches with Clicks | Search | Indicates how often users click after searching, measuring engagement. |
| Searches with Platform Results | Search | Tracks searches that return results, highlighting search effectiveness. |
| Case Deflection Rate | Search | Measures how often Support Search resolves issues without human intervention. |
| Case Starts | Search | Tracks how often users start support cases via search. |
| Percentage of Total Searches | Search | Shows contribution of specific dimensions to total searches for insights. |
| Chat Avg Convo Lenght Duration | Chat | Measures average conversation length in seconds to assess bot efficiency. |
| Conversion Count | Conversion | Counts all conversions to evaluate performance across online properties. |
| Average Conversion Value | Conversion | Measures average value per conversion for ROI insights. |
| Ticket Clicks | Event Listings | Tracks clicks for ticketing actions to monitor user interest. |
| Apple Listings Actions | Event Listings | Measures actions on Apple Listings, including directions, calls, or clicks. |
| Duplicates Detected | Event Listings | Counts duplicates to monitor data quality and accuracy. |
| Driving Directions | Pages | Tracks how often users request directions, indicating interest in visiting your location. |
| Event: {EVENT_TYPE} | Pages | Custom events on Store Pages to track specific user interactions. |
| Profile Updates | Profile Data | Measures updates to your Yext profile, showing how actively your profile is maintained. |
| Publisher Suggestions | Profile Data | Counts all publisher suggestions, helping monitor profile improvements from external sources. |
| Keyword Mentions | Reviews | Tracks frequency of keywords in reviews to monitor sentiment and trends. |
| Clusters | Search | Counts distinct clusters to analyze patterns in search queries. |
| Case Deflections | Search | Shows users who started a journey but did not create a case, indicating effective self-service. |
| Result Rate | Search | Measures percentage of searches returning results, highlighting search accuracy. |
| Chat Thumbs Up Rate | Chat | Tracks positive user feedback on bot responses. |
| Chat Avg Convo Length Msgs | Chat | Average number of messages per conversation, helping optimize bot interactions. |
| Chat Total Impressions | Chat | Shows total opportunities users had to interact with the bot. |
| Chat Total Link Clicks | Chat | Measures engagement by tracking clicks on bot-provided links. |
| Chat Total Responses | Chat | Counts all bot responses to monitor volume and activity. |
| Click Count | Conversion | Total clicks across online properties to measure engagement. |
| Apple Search Taps | Event Listings | Tracks visits to Apple listings via search, showing search-driven engagement. |
| Duplicates Suppressed | Event Listings | Counts suppressed duplicates, monitoring data quality. |
| Call to Action Clicks | Pages | Tracks user interactions with call-to-action buttons. |
| Clicks to Website | Pages | Measures users visiting your website via Store Pages. |
| Google Search Click Through Rate | Pages | Shows how often users click your Pages in Google Search results. |
| Page Views | Pages | Tracks views of your Store Pages, indicating interest. |
| Sessions | Pages | Counts unique visitors (sessions) to Store Pages. |
| Taps to Call | Pages | Measures how often users click to call from Store Pages. |
| Response Time (Hours) | Reviews | Average time taken to respond to reviews, useful for responsiveness metrics. |
| Reviews | Reviews | Counts new reviews received to track feedback volume. |
| Rolling Average Rating | Reviews | Tracks competitor review ratings for benchmarking. |
| Searches Click Through Rate | Search | Measures percentage of searches that resulted in clicks. |
| Chat Conversation Rate | Chat | Tracks percentage of users who interacted with the bot. |
| Chat Total Conversations | Chat | Counts unique conversations, showing bot usage. |
| Chat Total Thumbs Down | Chat | Tracks negative feedback from users. |
| Suggestions Count Metric | Content | Counts all content suggestions, monitoring user engagement. |
| Event Searches | Event Listings | Shows how often your event appears in search results on Yext Publisher sites. |
| Google Search Average Position | Pages | Tracks average position of top-ranking pages in Google Search results. |
| Google Search Clicks | Pages | Counts clicks from Google Search to your Pages. |
| Google Search Impressions | Pages | Tracks appearances of your Pages in Google Search results. |
| Sessions | Search | Measures sessions started from search activity. |
| Voice Searches | Search | Helps understand how many users engage with your site or listings via voice search, indicating adoption of voice technology. |
| Case Submits | Search | Tracks users who start with a search and end up submitting a case, reflecting search-to-action effectiveness. |
| Event Matches per Search | Search Tracker | Measures how well your events match search intent, useful for optimizing event keywords and listings. |
| Ad Matches | Search Tracker | Tracks how often your business or competitors appear in ads, useful for competitive visibility analysis. |
| Facebook Post Impressions | Social | Shows how many times Facebook posts were viewed, reflecting organic and paid content reach. |
| Facebook Page Likes | Social | Indicates total followers and page popularity, measuring brand loyalty and audience growth. |
| Total Listings Impressions | Location Listings | Tracks visibility across major networks like Google and Bing, essential for monitoring local SEO reach. |
| Profile Views | Location Listings | Measures how often your listings are viewed, indicating user interest in your business details. |
| Facebook Post Unique Negative Actions | Social Analytics | Highlights negative engagement (e.g., hides, reports), useful for improving post quality. |
| Facebook Post Paid Reach | Social Analytics | Tracks paid post reach, allowing you to evaluate ad spend efficiency and audience targeting. |
| Facebook Post Organic Reach | Social Analytics | Measures unpaid reach, helping you gauge content virality and organic visibility. |
| Instagram Post Total Impressions | Social Analytics | Counts how many times your Instagram post appeared on users’ screens — key for brand exposure. |
| Instagram Post Total Interactions | Social Analytics | Tracks likes, shares, and comments — a solid indicator of Instagram audience engagement. |
| Post Count (Social Entity Posts) | Social Analytics | Tracks how many social posts were published per location or page, showing posting activity. |
| Average First Match Position | Search Tracker | Measures how high your listings appear in search results, critical for SEO performance tracking. |
| Event Share of Intelligent Search | Search Tracker | Indicates your share of intelligent (AI-powered) search results for events, showing visibility strength. |
| Local Pack Presence | Search Tracker | Shows how often your business appears in Google’s local pack, vital for local SEO tracking. |
| Local Pack Share of Search | Search Tracker | Measures your share of local search visibility among competitors. |
| Matches per Search | Search Tracker | Reflects how often your listings match user queries on SERPs, useful for keyword optimization. |
| Search Requests | Search Tracker | Tracks how many search requests were successfully analyzed, showing platform activity. |
| Total Matches | Search Tracker | Shows total listings appearing in search results, helping measure coverage and presence. |
| Facebook Page Total Check Ins | Social | Indicates real-world engagement by tracking users who check in to your business on Facebook. |
| Facebook Page Views | Social | Measures total page visits, indicating brand awareness and interest. |
| Google Listings Actions | Location Listings | Tracks interactions (clicks, calls, directions) from Google listings, showing engagement. |
| Google Listings Impressions | Location Listings | Measures how often listings appear on Google, indicating visibility trends. |
| New Listings Live | Location Listings | Tracks new listings that went live, useful for onboarding or expansion analysis. |
| Active Listings Live | Location Listings | Monitors total active listings across platforms, ensuring data consistency. |
| Facebook Post Click Rate | Social Analytics | Calculates engagement efficiency by measuring clicks relative to reach, reflecting content effectiveness. |
| Facebook Post Unique Clicks | Social Analytics | Helps measure post engagement beyond likes and shares, showing how many users interacted with post elements. |
| Facebook Post Total Impressions | Social Analytics | Indicates overall post visibility and brand exposure across users’ feeds. |
| Facebook Post Total Reach | Social Analytics | Shows how many unique users saw the post, valuable for understanding audience spread. |
| Facebook Post Organic Impressions | Social Analytics | Reveals non-paid reach effectiveness, helping assess organic content performance. |
| Facebook Post Engaged Fans | Social Analytics | Identifies core fans actively interacting with your content. |
| Instagram Post Total Saves | Social Analytics | Reflects valuable content users want to revisit, showing deeper engagement. |
| Facebook Page Posts Engagement Rate | Social Analytics | Measures post performance efficiency relative to audience size. |
| Thumbs Down Events | Search | Shows dissatisfaction in search results to help refine content quality. |
| Search Terms | Search | Tracks what users are searching for, revealing intent and keyword opportunities. |
| Thumbs Up Events | Search | Measures satisfaction and relevance of search results. |
| Ad Presence | Search Tracker | Indicates how often your ads appear in searches compared to competitors. |
| Local Pack Existed | Search Tracker | Tracks frequency of local packs appearing in search results for your business. |
| Organic Share of Search | Search Tracker | Measures how much organic visibility you hold in search engine results. |
| Facebook Page Impressions | Social | Shows how frequently your Facebook Page content appears to users. |
| Post Count (Social Posts) | Social | Helps track content publishing activity and posting frequency. |
| Searches | Location Listings | Monitors how often your listings appear in user searches. |
| Listings Accuracy | Location Listings | Ensures business data consistency across all directories. |
| Facebook Post Total Reactions | Social Analytics | Shows overall sentiment and emotional engagement with posts. |
| Instagram Post Reach | Social Analytics | Measures unique audience size for each Instagram post. |
| Apple Showcase Taps | Social Analytics | Tracks user engagement with Apple Showcase cards. |
| Total Post Impressions | Social Analytics | Provides total cross-platform visibility for Facebook + Instagram posts. |
| Instagram Page Total Posts | Social Analytics | Indicates overall posting activity level on Instagram. |
| Instagram Page Total Followers | Social Analytics | Measures brand following and growth over time. |
| Average First Local Pack Match Position | Search Tracker | Evaluates ranking performance in local search results. |
| Average First Organic Match Position | Search Tracker | Determines how well your website ranks organically. |
| Average Local Pack Number of Results | Search Tracker | Shows competition density in local pack results. |
| Average Local Pack Position | Search Tracker | Indicates how high the local pack appears in SERPs. |
| Event Rich Snippet Presence | Search Tracker | Tracks structured data effectiveness in event listings. |
| Knowledge Card Existed | Search Tracker | Measures visibility in Google knowledge panels. |
| Share of Intelligent Search | Search Tracker | Tracks dominance in intelligent (AI-enhanced) search results. |
| Google User Photos | Social | Shows user-generated visual content on Google listings. |
| Total Listings Actions | Location Listings | Tracks engagement actions like direction clicks, website visits, or calls. |
| Yelp Page Views | Location Listings | Measures visibility of your listings on Yelp. |
| Google Search Term Impressions | Location Listings | Reveals how often search keywords led users to your listings. |
| Facebook Post Total Clicks | Social Analytics | Tracks all user clicks on a post, indicating content curiosity. |
| Facebook Post Paid Impressions | Social Analytics | Evaluates paid campaign reach and ad effectiveness. |
| Instagram Post Engagement Rate | Social Analytics | Measures Instagram content performance relative to reach. |
| Total Post Reach | Social Analytics | Combines total unique reach across Facebook and Instagram. |
| Instagram Page New Followers Per Day | Social Analytics | Tracks daily audience growth trends. |
| Instagram Page Following Count | Social Analytics | Shows networking activity and following ratio. |
| Instagram Page Total Impressions | Social Analytics | Tracks total Instagram content exposure. |
| Instagram Page Total Reach | Social Analytics | Indicates total unique viewers of all IG content. |
| Instagram Page Engaged Accounts | Social Analytics | Shows how many accounts interacted with your content. |
| Instagram Page Total Views | Social Analytics | Measures profile visibility and interest over time. |
| Instagram Page Total Comments | Social Analytics | Tracks community interaction and discussion around content. |
| Instagram Page Total Shares | Social Analytics | Indicates shareability and virality of your content. |
| Instagram Page Total Interactions | Social Analytics | Measures total engagement (likes, comments, shares, saves). |
| Instagram Page Total Likes | Social Analytics | Captures overall positive engagement with posts. |
🔗 Yext Dimensions
The table below lists the Yext Metrics available through the Whatsdash Yext Integration.
| Name | Category | Why It's Useful |
|---|---|---|
| Direct Answer Type | Search | Identifies the type of direct answer returned for a search; useful for understanding automated response behavior. |
| Filter Value | Search | Value used to filter a search; helps refine analytics and user intent. |
| Has Case Submit | Search | Indicates the last search in the case creation process; useful for tracking support workflows. |
| Has Click | Search | Indicates whether a search resulted in a click; key for measuring engagement. |
| Has Results | Search | Shows if a search returned results (excluding third-party verticals); useful for identifying empty searches. |
| Legacy Search Term | Search | Normalized version of a search term for historical comparison; helps with trend analysis. |
| Locale | Search | Locale in which the search was run; useful for geographic segmentation. |
| Result Title | Search | Title of third-party results; helps identify external content relevance. |
| Search ID | Search | Unique ID of the search; useful for session-level tracking. |
| Search Term Cluster Performance | Search | Measures cluster performance based on CTR and search volume; helps optimize clusters. |
| Traffic Type | Search | Identifies internal vs external traffic; useful for source analysis. |
| User Device Class | Search | Device type of the user; helps analyze engagement by device. |
| User Lat,Long | Search | User’s location coordinates; enables geo-analysis of search behavior. |
| User Postal Code | Search | User’s postal code; supports localized analysis. |
| Medium | Conversion Tracking | Source of click for conversion attribution; essential for campaign analysis. |
| Search Experience | Search | Name of the Answers Experience; helps evaluate specific search experiences. |
| Search Experience Key | Search | Key of the Answers Experience; aids in precise tracking and reporting. |
| Search Term Label | Search | Label assigned to search terms; helps categorize search queries. |
| Blank Search Term | Search | Indicates searches without input; identifies empty or default searches. |
| Click Label | Search | Label for CTA clicks; useful for tracking user interactions. |
| Filter Operator | Search | Operator used in search filtering; aids analytics on filtering behavior. |
| Filter Source | Search | Source of applied filters; tracks filter usage patterns. |
| Has Direct Answer | Search | Shows whether a search returned a direct answer; measures answer accuracy. |
| Has Search Term Cluster | Search | Indicates if a search term belongs to a cluster; helps with term grouping analysis. |
| Referrer Domain | Search | Domain where the user came from; useful for traffic source analysis. |
| Referrer URL | Search | Full URL of referrer; allows detailed source tracking. |
| Result Vertical Position | Search | Position of verticals in search results; helps optimize content placement. |
| Search Term | Search | Normalized search term; critical for query analytics. |
| User Location Accuracy | Search | Method for detecting user location; ensures data reliability. |
| Competitor | Competitors | Tracks monitored competitors; supports competitive analysis. |
| Local Pack Competitor | Competitors | Tracks competitors in local packs; helps local SEO insights. |
| Product | Conversion Tracking | Conversion attributed to a specific product; helps product performance tracking. |
| Backend | Search | Backend used for results (Algolia, Bing, etc.); aids backend performance analysis. |
| Click Type | Search | Type of click (e.g., CTA, direct answer); informs user interaction analysis. |
| Configuration Version Label | Search | Version of configuration used for search; helps track experiment setups. |
| Configuration Version Label | Search | Version label for clicks or conversions; useful for versioned analysis. |
| Filter Key | Search | Field used to filter searches; helps identify filtering patterns. |
| Filter Type | Search | Type of filter applied; tracks user filtering behavior. |
| Raw Search Term | Search | Exact term entered by user; critical for precise search analytics. |
| Search Term Cluster | Search | Name of cluster a search term belongs to; enables trend grouping. |
| Search Term Word Count | Search | Number of words in search term; useful for query complexity analysis. |
| User Region | Search | Region of user running the search; supports geographic segmentation. |
| Conversion Type | Conversion Tracking | Type of conversion (purchase, lead, etc.); essential for conversion analysis. |
| Medium Type | Conversion Tracking | Type of traffic medium; helps campaign and channel reporting. |
| Search Term (Normalized) | Conversion Tracking | Normalized search term; useful for mapping to conversions. |
| Traffic Source | Conversion Tracking | Source of traffic leading to conversion; critical for attribution. |
| Configuration Version | Search | Version number of configuration used; ensures accurate version tracking. |
| Direct Answer Click | Search | Indicates if click came from direct answer; measures engagement with direct answers. |
| Direct Answer Field | Search | Field returned in direct answer; useful for answer content analysis. |
| Direct Answer Field Type | Search | Type of field in direct answer; aids content classification. |
| Direct Answer Field Value | Search | Value returned in direct answer; tracks the content served. |
| Has Case Start | Search | First search in a case creation process; monitors support workflows. |
| Has Voice Search | Search | Shows if search was via voice; supports voice interaction analysis. |
| Integration Source | Search | Source of the search (standard vs overlay); helps track integration usage. |
| Result Entity Position | Search | Position of entity in vertical; useful for UI and result placement analysis. |
| Search Vertical | Search | Vertical used for search; enables vertical-level performance tracking. |
| Session ID | Search | ID of session the search was run in; supports session-level analysis. |
| User Browser | Search | Browser used for search; helps analyze browser-specific behavior. |
| User City | Search | City of the user; useful for local engagement tracking. |
| User Country | Search | Country of the user; supports geographic reporting. |
| Vertical Returned | Search | Vertical returned in results; helps evaluate vertical relevance. |
| Click Type | Conversion Tracking | Type of click for conversion; aids in user interaction insights. |
| Conversion Action | Conversion Tracking | Action type for conversion; essential for campaign performance. |
| Vertical Config ID | Conversion Tracking | Vertical config ID; helps link conversions to verticals. |
| Events | Entities | Events tied to entities; supports event-level analytics. |
| Entity Group | Entities | Group of entity types; useful for categorizing entities. |
| All Entities (by location ID) | Entities | Entity events by location ID; enables location-level analysis. |
| Sites | Location Listings | Tracks sites for site-interaction events; aids cross-site reporting. |
| Page Url | Pages | URLs visited on Store Pages; essential for page-level metrics. |
| Ratings | Reviews | Review ratings; supports sentiment and quality analysis. |
| Review Labels | Reviews | Labels assigned to reviews; helps categorize feedback. |
| Site | Reviews | Sites reviews appear on; useful for multi-site review tracking. |
| Event Search Schedule Condition | Search Tracker | Identifies schedule conditions; helps track event search timing. |
| Match Type | Search Tracker | Type of match in search tracker (local map, listings); supports SEO monitoring. |
| Search Result Type | Search Tracker | Organic, Local Pack, Knowledge Card; helps classify search results. |
| Weeks | Time | Events grouped by week; useful for time-based trend analysis. |
| Year | Time | Year of event; enables annual aggregation. |
| Field Name | Entities | Name of updated profile field; tracks profile changes. |
| All Entities (by folder ID) | Entities | Entity events by folder ID; supports folder-level insights. |
| Folder | Entities | Folder associated with an entity; aids organizational reporting. |
| Device | Location Listings | Device of user interaction; helps analyze device-specific behavior. |
| Raw Search Term | Location Listings | Exact search term entered; critical for query-level reporting. |
| Directory | Pages | Helps segment and analyze data based on the directory structure of store pages. |
| Page Type | Pages | Allows you to compare performance metrics across different types of pages. |
| Query Template | Search Tracker | Enables tracking which search queries generated engagement or conversions. |
| Facebook Impression Type | Social | Lets you distinguish between Organic, Paid, and Viral impressions for better ad strategy. |
| Platform | Traffic Source | Identifies where user interactions occurred (Desktop vs Mobile) to optimize experiences. |
| Visitor ID Method | Visitors | Helps understand how visitors are identified for accurate user tracking. |
| Day of Week | Time | Useful to analyze trends and patterns by day of the week. |
| Week Number | Time | Helps track weekly performance and seasonality. |
| Year Week(ISO) | Time | Useful for consistent week-based reporting using ISO standards. |
| Day Of Month | Time | Allows analysis of daily trends within a month. |
| Value Proposition | Conversion Tracking | Tracks which value propositions are driving conversions. |
| All Entities (by entity ID) | Entities | Enables tracking metrics at an entity-specific level. |
| Locations | Entities | Helps analyze metrics based on geographic or physical locations. |
| Action | Location Listings | Understand user interactions with your business (e.g., bookings, orders). |
| App | Location Listings | Tracks which app or interface was used for interactions. |
| Review Keywords | Reviews | Identify key themes or topics in user reviews. |
| Match Position | Search Tracker | Determines the rank of search results, important for SEO and visibility. |
| Search Engine | Search Tracker | Understand which search engines drive traffic and engagement. |
| Facebook RSVP Type | Social | Tracks RSVP types for Facebook events to gauge interest. |
| Visitor Email | Visitors | Helps connect interactions to unique users for email marketing or follow-ups. |
| Visitor Name | Visitors | Allows personalized engagement and tracking per visitor. |
| Days | Time | Analyze events on a specific day for granular reporting. |
| Year Of Week | Time | Track yearly performance aggregated by week. |
| Year Week | Time | Combines year and week for time-based trend analysis. |
| Entity Type | Entities | Helps categorize interactions by type of entity (e.g., store, product). |
| Publisher Suggestion Type | Entities | Track how suggested publishers impact engagement. |
| Is Click | Location Listings | Identify which actions are clicks to calculate CTR and other metrics. |
| Page Site | Pages | Helps segment metrics based on the domain of the page. |
| Frequent Words | Reviews | Identify most common words in reviews for sentiment or feedback analysis. |
| Sentiment Collection | Reviews | Categorize reviews by sentiment for performance insights. |
| Keyword | Search Tracker | Tracks which search keywords generate engagement. |
| Age | Social | Allows demographic analysis by age groups. |
| Visitor ID | Visitors | Provides unique visitor tracking for user-level analysis. |
| Day Of Week Name(ISO) | Time | Useful for day-specific reporting with ISO standardization. |
| Months | Time | Track trends and seasonality by month. |
| Quarters | Time | Analyze performance on a quarterly basis. |
| Year Of Week(ISO) | Time | ISO-standard year-week reporting for consistent time tracking. |
| Year Month | Time | Track performance trends aggregated by month and year. |
🔗 Explore More Integrations
Whatsdash supports a wide range of marketing, analytics, and eCommerce integrations to give you a holistic view of your business performance.
👉 Visit the Integrations Page to explore all available connections
Vimeo Public Data
Vimeo is a video-sharing platform known for its high-quality content and supportive community for creative professionals, businesses, and organizations. It provides tools for video hosting, management, and sharing, along with various analytics features.
Why Connect Vimeo Public Data to Whatsdash?
Integrate your Vimeo Public Data Integration with Whatsdash to consolidate core video performance metrics for a quick, high-level view of your content's social reach and engagement.
-
Simplified Reporting & Dashboards : Instantly track key video performance Metrics like views and likes using visual, customizable reports.
-
Content Performance at a Glance : Easily monitor which videos are gaining the most traction in terms of public engagement (likes, comments) and popularity (views).
-
Cross-Channel Analysis : Blend Vimeo Public Data with web analytics, social media, and sales data to understand the broader impact of your video content.
📋 Steps to Integrate your Vimeo Public Data account to Whatsdash
✔️ Navigate to the 'Integrations' page using the Navigation bar.
✔️ Select Vimeo Public Data from the Available Integrations.
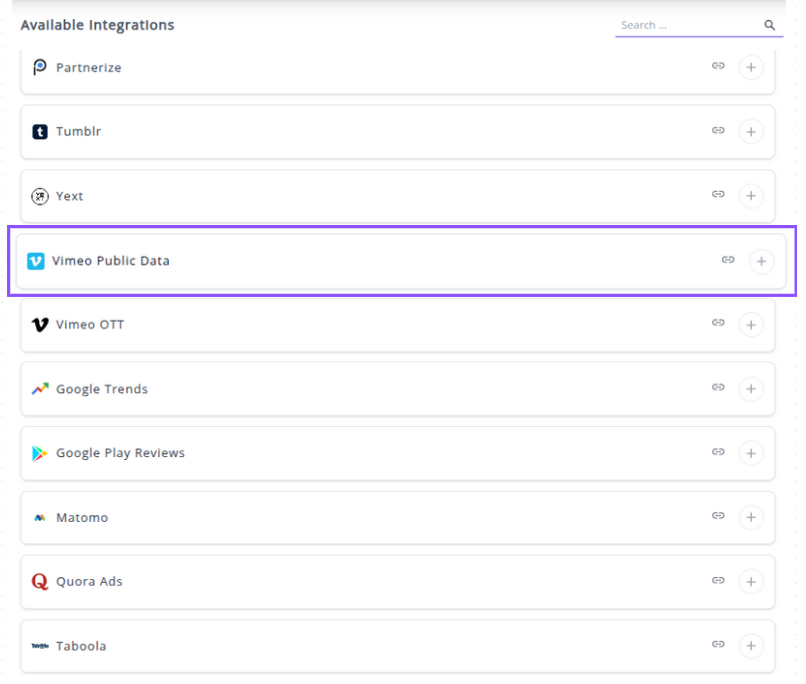
✔️ Click + button to open the Vimeo authorization window.
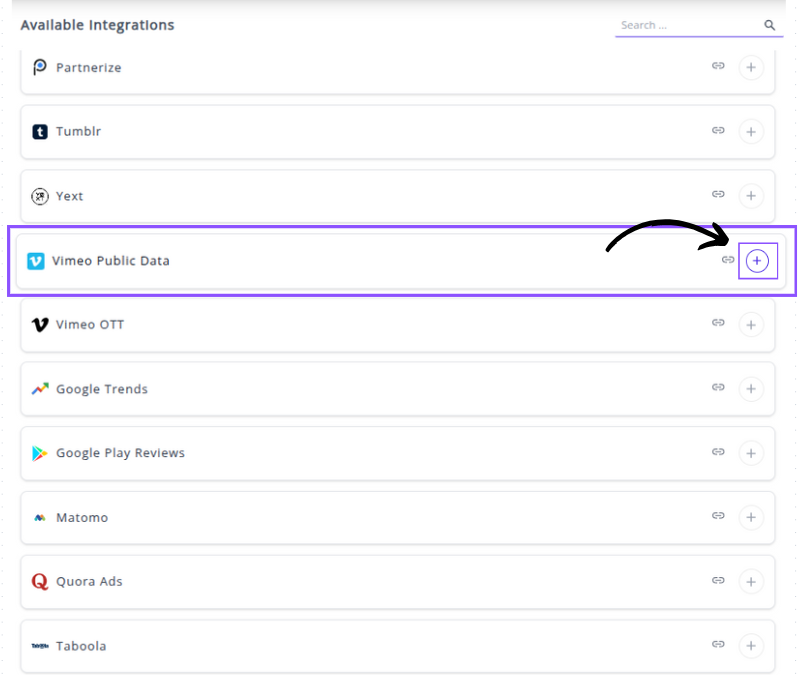
✔️ You will be redirected to a Vimeo Sign-in page. Log in with the Vimeo account that owns the videos you wish to track.
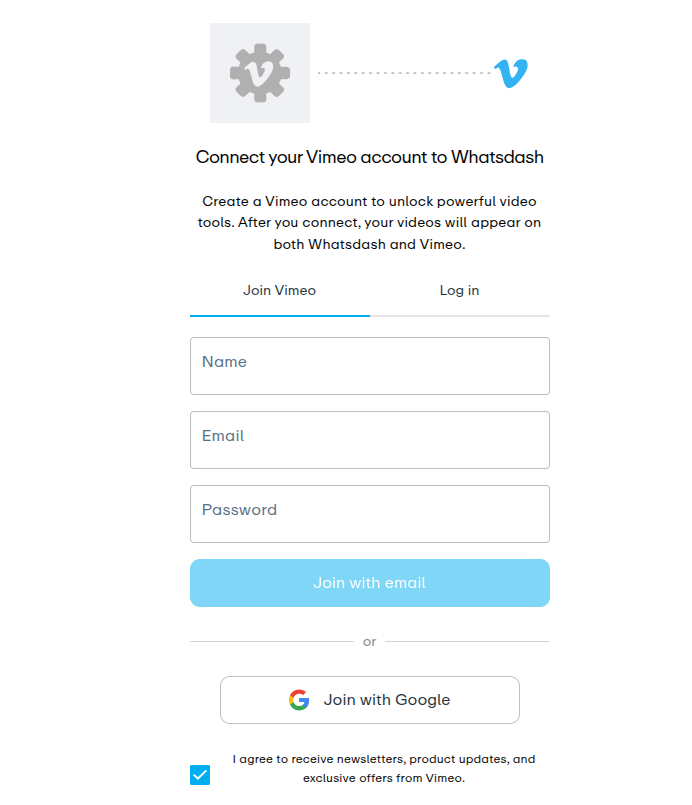
✔️ Grant Whatsdash the necessary permissions (typically Read access to your videos and public information).
✔️ Once authenticated, you will be directed back to Whatsdash. Your Vimeo Public Data Integration will appear in the Connected Integrations list.
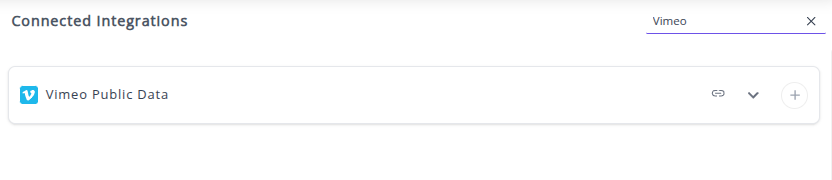
✔️ You can now create or customize dashboards using your Vimeo Public Data Metrics and Dimensions.
👉 How to visualize this data in your dashboard, visit the Dashboard Documentation Guide.
🔗 Vimeo Public Data Metrics
The table below lists the Vimeo Public Data Dimensions available through the Whatsdash Vimeo Public Data Integration.
| Name | Category | Why it's Useful |
|---|---|---|
| Followers | User | Measures the size of the user’s audience or fanbase. |
| Portfolios | User | Tracks how many project portfolios the user has created. |
| Albums | User | Shows how many albums the user has organized their videos into. |
| Following | User | Indicates how many other users this user follows. |
| Moderated Channels | User | Reveals the user’s role in managing channels or communities. |
| Videos | User | Tracks the number of videos uploaded by the user. |
| Shared Videos | User | Shows how many videos have been shared by the user. |
| Permission Policies | User | Displays how many access or privacy rules the user has set. |
| Channels | User | Indicates how many channels belong to the user. |
| Groups | User | Tracks group participation or collaboration activity. |
| Likes | User | Shows engagement with other creators through likes. |
| Teams | User | Displays team membership count for collaborative work. |
| Pictures | User | Counts profile or related image assets for the user. |
| Appearances | User | Indicates how many times the user appears in other creators’ videos. |
| Text Tracks | Video | Counts subtitles or caption files linked to a video. |
| Albums | Video | Shows how many albums include the specific video. |
| Duration | Video | Displays the total length of a video in seconds. |
| Likes | Video | Measures viewer appreciation for the video through likes. |
| Credits | Video | Lists contributors or collaborators credited in the video. |
| Comments | Video | Tracks the volume of viewer discussions and feedback. |
| Pictures | Video | Counts thumbnails or image assets associated with the video. |
| Available Albums | Video | Indicates how many available albums feature the video. |
🔗 Vimeo Public Data Dimensions
The table below lists the Vimeo Public Data Dimensions available through the Whatsdash Vimeo Public Data Integration.
| Name | Category | Why it's Useful |
|---|---|---|
| User Name | User | Identifies the creator or account owner. |
| Account Type | User | Shows the Vimeo subscription tier (Basic, Plus, Pro, etc.). |
| User Bio | User | Provides the creator’s biography or professional summary. |
| User Location | User | Displays the user’s geographical information for regional insights. |
| Website Name | User | Reveals the primary website linked to the user. |
| Website Description | User | Gives context or details about the user’s external website. |
| Website Link | User | Provides a clickable URL to the user’s website. |
| User Profile Link | User | Direct link to the user's Vimeo profile for navigation or reference. |
| Video Name | Video | Identifies the title of the video. |
| Description | Video | Provides an overview or summary of the video’s content. |
| Video Link | Video | The direct URL to the video on Vimeo. |
| Video Width | Video | Technical specification of video width in pixels. |
| Video Height | Video | Technical specification of video height in pixels. |
| Video Language | Video | Indicates the primary language of the video. |
| Video Status | Video | Shows whether the video is public, private, or processing. |
| Content Rating | Video | Indicates audience suitability (e.g., mature, all ages). |
| Video Tags | Video | Keywords or categories associated with the video. |
| Application Name | Video | Shows which app or tool uploaded the video. |
| Embed HTML | Video | Provides HTML embed code for integrating the video externally. |
| Add Privacy | Video | Determines who can add the video to collections or channels. |
| View Privacy | Video | Controls who can view the video. |
| Download Privacy | Video | Controls who can download the video. |
| Comments Privacy | Video | Defines who can comment on the video. |
| Embed Privacy | Video | Controls where the video can be embedded. |
| Badges Header | Video | Displays header-level recognition or achievement badges. |
| Badges VOD | Video | Indicates if the video is part of a Video-on-Demand series. |
| Badges Staff Pick Normal | Video | Marks if the video was chosen as a regular Staff Pick. |
| Badges Staff Pick Best of Month | Video | Highlights if the video was selected as Best of the Month. |
| Badges Staff Pick Best of Year | Video | Highlights if the video was selected as Best of the Year. |
| Badges Staff Pick Premiere | Video | Shows if the video was featured as a Staff Pick Premiere. |
| Badges Weekend Challenge | Video | Marks participation in Vimeo’s Weekend Challenge program. |
| Badges Live Streaming | Video | Indicates live streaming capabilities or participation. |
| Badges Live Archived | Video | Marks archived live streams on the user’s channel. |
| Year | Time | Displays the calendar year of the event or upload. |
| Year Month | Time | Combines year and month for monthly reporting. |
| Year Week | Time | Tracks performance or uploads by week number. |
| Year Week (ISO) | Time | ISO-standard week-year combination for analytics alignment. |
| Week | Time | Shows the week of the year (01–53). |
| Week (ISO) | Time | ISO version of the week for international calendar consistency. |
| Month | Time | Extracted month value (01–12) for grouping or filtering. |
| Date | Time | Represents the full calendar date (YYYYMMDD). |
| Day Of Month | Time | Numeric day of the month (01–31). |
| Day Of Week Name | Time | Text name of the weekday (e.g., Tuesday). |
| Day Of Week Name (ISO) | Time | ISO-standard weekday name, ensuring international consistency. |
| Year Of Week | Time | Displays the year corresponding to a given week. |
| Year Of Week (ISO) | Time | ISO-compliant year representation for weekly datasets. |
🔗 Explore More Integrations
Whatsdash supports a wide range of marketing, analytics, and eCommerce integrations to give you a holistic view of your business performance.
👉 Visit the Integrations Page to explore all available connections
Vimeo OTT
Vimeo OTT is a comprehensive video monetization platform that allows businesses to launch and manage their own branded streaming service (SVOD, TVOD, or AVOD) across various devices.
Why Connect Vimeo OTT to Whatsdash?
Integrate your Vimeo OTT data with Whatsdash to gain a unified view of your streaming business performance, from video engagement to subscriber churn and total revenue.
-
Unified Streaming & Revenue Reporting: Get clear, instant dashboards that combine video viewership data (views, watch time) with critical business metrics (subscribers, revenue, transactions).
-
Track Key Monetization KPIs: Easily monitor Subscription Video On Demand (SVOD) and Transactional Video On Demand (TVOD) performance, including free trials, renewals, churn rate, and average transaction value.
-
Cross-Platform Content Insights: Analyze which content is performing best, identify top videos by views and finish rates, and segment performance by geographical region or viewing device.
📋 Steps to Integrate your Vimeo OTT account to Whatsdash
✔️ Navigate to the 'Integrations' page using the Navigation bar.
✔️ Select Vimeo Public Data from the Available Integrations.
✔️ Click + button to open the Vimeo connection window.

In the connection pop-up, you will be prompted to enter your API credentials.
- API Key : Obtain these required credentials from your Vimeo OTT developer or admin settings and enter them into the respective fields.

✔️ Click Next button to authenticate and connect.
✔️ Once authenticated, you will be directed back to Whatsdash. Your Vimeo OTT Integration will appear in the Connected Integrations list.
✔️ You can now create or customize dashboards using your Vimeo OTT Metrics and Dimensions.
👉 How to visualize this data in your dashboard, visit the Dashboard Documentation Guide.
🔗 Vimeo OTT Metrics
The table below lists the Vimeo OTT Metrics available through the Whatsdash Vimeo OTT Integration.
| Name | Category | Why it’s Useful |
|---|---|---|
| Playlists Count | Products | Shows the total number of playlists available within a product category — helps analyze content variety. |
| Movies Count | Products | Displays the total number of movies in the product catalog — useful for inventory and catalog growth tracking. |
| Series Count | Products | Indicates how many series are available — helps evaluate long-form content offerings. |
| Video Duration | Videos | Represents total duration (in seconds) of a video — critical for measuring engagement time. |
| Files Count | Videos | Displays the total number of associated files per video — useful for quality and media management. |
| Plays Count | Videos | Tracks how many times content has been played — key metric for popularity and audience reach. |
| Finishes Count | Videos | Measures how often viewers complete a video — valuable for completion rate and engagement insights. |
| Episode Number | Videos | Identifies the episode’s number within a season — useful for ordering and tracking episodic content. |
| Season Number | Videos | Indicates the season’s number for a video — essential for grouping series content. |
| Items Count | Collection | Shows how many items (episodes/videos) are in a collection — helps understand collection size and structure. |
| Position | Collection | Displays the order of an item within a playlist or series — ensures correct sequence display and playback logic. |
🔗 Vimeo OTT Dimensions
The table below lists the Vimeo OTT Dimensions available through the Whatsdash Vimeo OTT Integration.
| Name | Category | Why it’s Useful |
|---|---|---|
| Video ID | Videos | Unique identifier for each video; essential for mapping and tracking individual video performance. |
| Video Title | Videos | Shows the title of the video; used for identification and reporting. |
| Video Description | Videos | Provides a summary of the video’s content for better context in analytics. |
| Video Status | Videos | Indicates whether the video is published, draft, or private — useful for filtering visibility. |
| Video Season Name | Videos | Identifies the season of the video, relevant for episodic series tracking. |
| Video Series Name | Videos | Displays the series to which the video belongs, helping group related content. |
| Video Plans | Videos | Lists the access level (public, free, standard) — useful for understanding audience access. |
| Subtitles Language | Videos | Shows available subtitle languages for accessibility insights. |
| Product ID | Products | Unique product identifier used in OTT catalog and purchase tracking. |
| Description | Products | Describes the product offering for user understanding. |
| Is Active | Products | Indicates if a product is active (True/False) — useful for filtering current offerings. |
| Collection ID | Collection | Unique ID of a collection; helps in linking and referencing in analytics. |
| Name | Collection | The title of the collection (series, movie, or playlist). |
| Description | Collection | A short summary of the collection; helps in understanding context. |
| Slug | Collection | URL-friendly identifier used in web addresses and SEO tracking. |
| Collection Type | Collection | Defines whether the content is a series, playlist, or movie. |
| Release Year | Collection | Year of the original release — useful for trend and lifecycle analysis. |
| Collection Plans | Collection | Lists which subscription tiers can access the collection. |
| Director | Collection | Shows who directed the content — relevant for creative performance analysis. |
| Writers | Collection | Lists the writers of the series or film — useful for credits and attribution. |
| Is Featured | Collection | Identifies highlighted or promoted collections — helps measure featured content performance. |
| Year | Time | Represents the calendar year; key for yearly trend analysis. |
| Month | Time | Represents the month (01–12); helps with monthly comparisons. |
| Year Month | Time | Combines year and month (YYYYMM) for consistent time-based grouping. |
| Year Week | Time | Displays combined year-week (e.g., 202532); used for weekly performance tracking. |
| Year Week(ISO) | Time | ISO-compliant version of Year Week; ensures consistency in international reporting. |
| Week | Time | Week number (01–53) for fine-grained weekly analysis. |
| Week(ISO) | Time | ISO week number version; useful for cross-region date standardization. |
| Date | Time | Specific calendar date (YYYYMMDD); most granular time dimension. |
| Day Of Month | Time | Day of the month (01–31); helps analyze daily performance. |
| Day Of Week Name | Time | Displays weekday names (e.g., Tuesday); helps spot day-of-week trends. |
| Day Of Week Name(ISO) | Time | ISO-compliant weekday naming for consistent weekly insights. |
| Year Of Week | Time | Indicates the year associated with a given week number. |
| Year Of Week(ISO) | Time | ISO-standardized version of “Year Of Week.” |
🔗 Explore More Integrations
Whatsdash supports a wide range of marketing, analytics, and eCommerce integrations to give you a holistic view of your business performance.
👉 Visit the Integrations Page to explore all available connections
Google Trends
Google Trends is a public web facility by Google that analyzes the popularity of top search queries in Google Search across various regions and languages.
Why Connect Google Trends to Whatsdash?
Integrating Google Trends data with Whatsdash transforms external market interest into contextual metrics, enabling your team to make data-driven decisions on content, marketing, and product development alongside your internal business performance data.
-
Market Trend Spotting: Monitor the search popularity of keywords, products, and competitors to identify emerging trends and avoid declining ones, ensuring your content and marketing stay relevant.
-
Content & SEO Strategy: Use search interest data to plan your content calendar, refine your SEO strategy, and update existing content around current high-interest topics.
-
Cross-Channel Analysis: Blend normalized search interest data with your Google Analytics, social media, and sales metrics to understand how public interest in a topic correlates with on-site engagement and revenue.
📋 Steps to Integrate your Google Trends to Whatsdash
✔️ Navigate to the 'Integrations' page using the Navigation bar.
✔️ Select Google Trends from the Available Integrations.

✔️ Click + button to open the Vimeo connection window.
✔️ In the connection pop-up, you will be prompted to enter the following parameters:
Connection Name: Enter a descriptive name for this specific Google Trends connection (e.g., "Seasonal Sales Trends," "Competitor Interest," or "SEO Keyword Analysis").
Query Type: Select the type of trend data you want to retrieve. Options typically include "Interest over time", "Related queries", "Related topics" and so on.
Search Term: Enter the keyword, phrase, or topic you want to track. You can often add multiple terms separated by commas for comparison.
Select Country: Choose the country or region you want to get search interest data for. You can also select "Worldwide" by deafult.
Search Type: Specify the type of search where the trends should be observed (e.g., "Web" for general Google Search, "Image", "YouTube" ,"News" or "Shopping").
Category: Select a relevant category to narrow down the search context and avoid ambiguous results (e.g., "Arts & Entertainment," "Business & Industrial"). "All categories" is the default.
Timezone: Select the timezone for the data collection.
Result Type: Choose the format for the results (e.g., "Top", "Rising").

✔️ Click Next button to save these parameters and establish the connection.
✔️ You can now create or customize dashboards using your Google Trends Metrics and Dimensions by configuring search terms, locations, and time ranges directly within your dashboard widgets.
👉 How to visualize this data in your dashboard, visit the Dashboard Documentation Guide.
🔗 Google Trends Metrics
The table below lists the Google Trends Metrics available through the Whatsdash Google Trends Integration.
| Name | Category | Why it’s Useful |
|---|---|---|
| Interest (%) | Keyword / Metrics | Measures how often a search term is entered relative to total search volume over a specific period — useful to track popularity trends and compare term interest over time. |
🔗 Google Trends Dimensions
The table below lists the Google Trends Dimensions available through the Whatsdash Google Trends Integration.
| Name | Category | Why it’s Useful |
|---|---|---|
| DMA Code | Region | Tracks how a search term trends in a designated market area (DMA) — useful for regional marketing insights. |
| DMA | Region | Shows trends in a designated market area — helps in hyper-local trend analysis. |
| Geo Code | Region | Tracks trends by geographic codes — useful for location-specific insights. |
| Geo | Region | Provides trend insights by geographic area — helps in targeting campaigns geographically. |
| Country | Region | Shows search trends globally or by country — useful for country-level marketing strategies. |
| Country Code | Region | Gives the country code of trend data — useful for standardizing regional analysis. |
| City | Region | Tracks search trends by city — helpful for micro-targeting campaigns. |
| City Code | Region | Identifies city code for trend data — ensures consistency in city-level reporting. |
| Region | Region | Shows trends in specific regions — supports regional trend comparison. |
| Region Code | Region | Provides standardized code for regions — enables integration with other datasets. |
| Search Term | Keyword | The actual keyword or phrase searched — foundational for all trend analysis. |
| Topic Code | Keyword | Code for suggested topics — useful for automatic topic categorization. |
| Topic Title | Keyword | Title of suggested topic — helps understand related topics. |
| Topic Type | Keyword | Type of suggested topic — differentiates between categories (e.g., queries, entities). |
| Related Query | Keyword | Related search queries — helps identify variations and emerging trends. |
| Search Volume | Keyword | Shows the volume of searches — critical for demand analysis. |
| Year | Time | Year of the data — supports time-based trend analysis. |
| Month | Time | Month of the data — helps in monthly trend reporting. |
| Week | Time | Week number — useful for weekly trend tracking. |
| Week(ISO) | Time | ISO week number — ensures standardized weekly reporting. |
| Year Week | Time | Combined year and week — enables weekly trend aggregation. |
| Year Week(ISO) | Time | ISO year-week combination — ensures consistency in weekly trend analysis. |
| Year Month | Time | Year and month — useful for monthly trend analysis. |
| Year Of Week | Time | Year for the specific week — helps align week-based metrics. |
| Year Of Week(ISO) | Time | ISO year of week — ensures standard weekly comparisons. |
| Day Of Month | Time | Day number within a month — supports daily trend tracking. |
| Day Of Week Name | Time | Day name (e.g., Tuesday) — useful for weekday trend patterns. |
| Day Of Week Name(ISO) | Time | ISO-standard weekday name — for consistent weekday reporting. |
| Related News1 Title | News | Title of related trending news — helps contextualize trends. |
| Related News1 URL | News | URL for news — provides direct reference to news source. |
| Related News1 Image | News | News image — visual context for trends. |
| Related News1 Image URL | News | URL of news image — for embedding or display. |
| Related News1 Source | News | Source of news — attribution and credibility check. |
| Related News2 Title | News | Title of the second related news item — additional context. |
| Related News2 URL | News | URL for news — link to source. |
| Related News2 Image | News | Image of news — visual context. |
| Related News2 Image URL | News | URL of image — for embedding/display. |
| Related News2 Source | News | News source — attribution. |
| Related News3 Title | News | Title of third news item — context for trends. |
| Related News3 URL | News | URL of news — reference. |
| Related News3 Image | News | Image of news — visual aid. |
| Related News3 Image URL | News | URL of image — embedding purposes. |
| Related News3 Source | News | Source of news — attribution. |
| Related News4 Title | News | Title of fourth news item — trend context. |
| Related News4 URL | News | URL for news — reference. |
| Related News4 Image URL | News | Image URL — for embedding/display. |
| Related News4 Source | News | Source of news — attribution. |
🔗 Explore More Integrations
Whatsdash supports a wide range of marketing, analytics, and eCommerce integrations to give you a holistic view of your business performance.
👉 Visit the Integrations Page to explore all available connections
Google Play Reviews
The Google Play Reviews integration allows the admin to pull detailed user feedback, ratings, and device metadata for their Android applications directly into Whatsdash for app performance tracking and reputation management.
Why Connect Google Play Reviews to Whatsdash?
Integrating your Google Play Reviews with Whatsdash transforms user feedback from the Play Store into essential metrics on your centralized dashboard, enabling proactive reputation management and data-driven product improvements.
-
Real-Time Sentiment Analysis: Instantly track average ratings, sentiment trends, and common topics mentioned in reviews to understand user satisfaction and app health.
-
Unified Feedback Management: Consolidate app reviews alongside your other customer service and product metrics (e.g., bug reports, app store revenue) for a holistic view of the user experience.
-
Actionable Insights for Product Teams: Use Dimensions like Device and Android OS Version to quickly identify app issues that are specific to certain devices or operating systems, allowing development teams to prioritize fixes.
📋 Steps to Integrate your Google Play Reviews to Whatsdash
The integration process involves securely linking your Google Play Developer account and specifying the application you wish to track.
✔️ Navigate to the 'Integrations' page using the Navigation bar.
✔️ Select Google Play Reviews from the Available Integrations.

✔️ Click the + button to open the connection window.

✔️ Enter the Package Name of the app you want to track.This is the unique, reverse-domain identifier of your app on the Play Store.

✔️ Click Next button. You will be redirected to a Google sign-in page.
✔️ Select the Google account that is linked to your Google Play Developer Console.
✔️ Grant Whatsdash the necessary permissions to Read your Google Play Review data.
✔️ Once authenticated, you will be directed back to Whatsdash. Your Google Play Reviews Integration will appear in the Connected Integrations list.
✔️ You can now create or customize dashboards using your app review Metrics and Dimensions.
👉 How to visualize this data in your dashboard, visit the Dashboard Documentation Guide.
🔗 Google Play Reviews Metrics
The table below lists the Google Play Reviews Metrics available through the Whatsdash Google Play Reviews Integration.
| Name | Category | Why It’s Useful |
|---|---|---|
| Number of reviews | Reviews | Measures the total user feedback volume, useful for tracking engagement growth. |
| Average rating | Review | Indicates overall user satisfaction and app quality perception. |
| Thumbs up | Reviews | Shows how many users found a review helpful, useful for gauging review credibility. |
| Thumbs down | Reviews | Highlights unhelpful reviews, helping monitor feedback quality. |
🔗 Google Play Reviews Dimensions
The table below lists the Google Play Reviews Dimensions available through the Whatsdash Google Play Reviews Integration.
| Name | Category | Why It’s Useful |
|---|---|---|
| Review Id | Reviews | Identifies each unique review for easy reference and filtering. |
| Ratting | Reviews | Shows user sentiment towards your app, helping track satisfaction trends. |
| Reviewer Name | Reviews | Helps identify repeat reviewers or key user segments. |
| Text | Reviews | Provides direct user feedback to understand issues or praise. |
| Review Date | Reviews | Tracks when reviews are received to analyze trends over time. |
| ReplyText | Reviews | Displays developer responses, useful for engagement analysis. |
| Device | Reviews | Identifies device models, helping correlate issues with specific hardware. |
| Android Version | Reviews | Reveals compatibility or performance issues across Android versions. |
| Device Manufacturer | Reviews | Helps detect brand-specific app performance or feedback trends. |
| Year | Time | Enables year-based trend analysis of reviews. |
| Year Of Week | Time | Helps group reviews by year and week for consistent weekly trends. |
| Year Of Week(ISO) | Time | ISO-standard week grouping for precise international time analysis. |
| Year Month | Time | Allows monthly trend reporting and seasonal analysis. |
| Month | Time | Enables aggregation of reviews and ratings by month. |
| Year Week | Time | Helps evaluate weekly review trends over the year. |
| Year Week(ISO) | Time | Provides consistent weekly comparison across locales. |
| Week | Time | Useful for identifying weekly spikes or dips in user feedback. |
| Week(ISO) | Time | ISO-compliant week segmentation for international reporting. |
| Day Of Month | Time | Enables daily tracking of review volume or sentiment. |
| Day Of Week Name | Time | Helps detect patterns like higher reviews on weekends. |
| Day Of Week Name(ISO) | Time | Provides standardized weekday mapping for multi-region consistency. |
| Date | Time | Allows detailed day-by-day trend analysis for precise time-based insights. |
🔗 Explore More Integrations
Whatsdash supports a wide range of marketing, analytics, and eCommerce integrations to give you a holistic view of your business performance.
👉 Visit the Integrations Page to explore all available connections
Matomo
Matomo is a privacy-focused, open-source web and app analytics platform.
Why Connect Matomo to Whatsdash?
Integrate your Matomo data with Whatsdash to transform raw website and app data into clear, actionable business insights, while benefiting from Matomo's privacy features and 100% data ownership.
-
100% Data Accuracy & Ownership: Access reports based on 100% of your data, with no sampling, ensuring you make impactful decisions based on accurate reports you fully own and control.
-
Comprehensive User Journey Analysis: Pull in data on visitor profiles, custom dimensions, events, and conversion funnels to get a complete view of the user journey alongside sales and marketing data.
-
Centralized, Customizable Reporting: Utilize Whatsdash's pre-built templates and custom reporting features to visualize Matomo's rich data without navigating Matomo's interface for every report.
📋 Steps to Integrate your Matomo account to Whatsdash
✔️ Navigate to the 'Integrations' page using the Navigation bar.
✔️ Select Matomo from the Available Integrations.

✔️ Click the + button to open the connection window.

✔️ Enter the Name of Your Login .
✔️ Enter the Site ID .
✔️ Paste the Auth Token.

✔️ Click Next.
✔️ Your Matomo Integration will now appear in the Connected Integrations list, and you can begin building dashboards.

🔗 Matomo Metrics
The table below lists the Matomo Metrics available through the Whatsdash Matomo Integration.
| Name | Category | Why it’s useful |
|---|---|---|
| Visitors | Location | Shows total visits from a specific region, useful for identifying audience distribution. |
| Actions | Location | Measures user engagement by counting actions like page views or clicks from a location. |
| Maximum Actions | Location | Identifies the most active visitor behavior within a single session from a region. |
| Total Visit Length | Location | Tracks how long visitors from a region stay on the site, indicating engagement quality. |
| Bounce Count | Location | Counts visitors from a region who left after one page, helping assess relevance. |
| Converted Visits | Location | Measures how many visits from a region led to conversions, useful for regional performance. |
| Sum of Daily Unique Visitors | Location | Shows total distinct visitors per day from a region, indicating audience size. |
| Sum of Daily Users | Location | Tracks total daily users by region, useful for monitoring active audience reach. |
| Number of Visits | Language | Indicates total sessions by users of a specific language, useful for localization strategies. |
| Number of Actions | Language | Measures engagement level among visitors using a particular language. |
| Maximum Actions | Language | Shows highest activity per user in one session, helpful for user intensity analysis. |
| Total Visit Length | Language | Tracks total time spent by users of a language, indicating content relevance. |
| Bounce Count | Language | Identifies sessions with only one interaction, signaling content mismatch for a language group. |
| Converted Visits | Language | Measures how many sessions in a language group resulted in conversions. |
| Sum of Daily Unique Visitors | Language | Indicates distinct daily visitors using a specific language, showing audience diversity. |
| Sum of Daily Users | Language | Tracks total daily users grouped by language. |
| Number of Visits | Device | Shows how many visits came from a specific device type (desktop, mobile, etc.). |
| Number of Actions | Device | Measures total interactions per device, useful for UX optimization. |
| Maximum Actions | Device | Tracks the most active user session by device type. |
| Sum of Visit Length | Device | Reflects engagement by showing total visit time from a device type. |
| Bounce Count | Device | Counts quick exits by device, identifying performance or usability issues. |
| Converted Visits | Device | Measures conversions across device types, valuable for mobile vs desktop comparison. |
| Sum of Daily Unique Visitors | Device | Tracks daily distinct visitors by device type. |
| Sum of Daily Users | Device | Measures overall daily user activity per device. |
| Number of Form Views | Pages | Shows how many times a form on a page was viewed, measuring exposure. |
| Number of Form Viewers | Pages | Counts unique users who viewed a form, distinguishing reach from repeat views. |
| Number of Form Starts | Pages | Indicates how many times users began filling out a form, showing interest. |
| Number of Form Starters | Pages | Tracks unique users who started filling out a form. |
| Number of Form Submissions | Pages | Measures total form completions, indicating success rate. |
| Number of Form Submitters | Pages | Counts unique users who submitted a form, showing engagement depth. |
| Number of Form Resubmitters | Pages | Tracks users who resubmitted forms, possibly due to corrections or retries. |
| Number of Form Conversions | Pages | Measures how many form submissions led to actual conversions. |
| Form Starters Rate | Pages | Calculates the percentage of viewers who started the form, indicating engagement rate. |
| Form Conversion Rate | Pages | Measures how effectively page forms convert users, helping evaluate form performance. |
| Form Submitter Rate | Pages | Indicates the proportion of users who complete form submissions after starting, showing drop-off efficiency. |
| Average Form Time Hesitation | Pages | Tracks hesitation time before form submission, helping identify user uncertainty or complexity. |
| Average Time to First Submission | Pages | Shows how long users take to submit a form for the first time, indicating usability. |
| Average Form Time Spent | Pages | Measures total time users spend filling forms, useful for optimizing form length and clarity. |
| Number of Visits | Referrers | Tracks total visits from external referrers, useful for identifying key traffic sources. |
| Number of Actions | Referrers | Counts interactions from referrer traffic, helping measure engagement. |
| Maximum Actions | Referrers | Shows highest user activity from a referrer, highlighting highly engaged audiences. |
| Total Visit Length | Referrers | Measures total time visitors from referrers spend on site, reflecting engagement quality. |
| Bounce Count | Referrers | Tracks visits from referrers that leave after one page, useful for evaluating referral traffic quality. |
| Number of Visits Converted | Referrers | Counts how many referrer visits resulted in conversions, indicating referral effectiveness. |
| Daily Unique Visitors | Referrers | Measures daily distinct visitors from referrers, showing reach consistency. |
| Daily Users | Referrers | Tracks total users per day from referrers, helping understand return behavior. |
| Number of Visits | Search Engine | Measures visits generated by search engines, critical for SEO performance tracking. |
| Number of Actions | Search Engine | Indicates engagement through total actions performed by search engine visitors. |
| Maximum Actions | Search Engine | Identifies most active users from search sources, useful for engagement insights. |
| Total Visit Length | Search Engine | Tracks how long search visitors stay, showing session quality. |
| Bounce Count | Search Engine | Measures bounce rate from search traffic, indicating landing page effectiveness. |
| Number of Visits Converted | Search Engine | Tracks search visits that led to conversions, valuable for SEO ROI evaluation. |
| Daily Unique Visitors | Search Engine | Counts daily distinct visitors from search engines, showing organic visibility. |
| Daily Users | Search Engine | Tracks overall daily user volume from search engines, useful for trend monitoring. |
| Number of Visits | Campaign | Indicates total campaign-driven visits, useful for campaign performance tracking. |
| Number of Actions | Campaign | Measures engagement level of campaign visitors. |
| Maximum Actions | Campaign | Identifies top engaged users from campaign traffic. |
| Total Visit Length | Campaign | Tracks total session duration from campaign traffic. |
| Bounce Count | Campaign | Measures quick exits from campaign visits, highlighting landing page optimization needs. |
| Number of Visits Converted | Campaign | Shows how many campaign visits resulted in conversions, important for ROI. |
| Daily Unique Visitors | Campaign | Tracks unique daily users from campaigns, showing audience reach. |
| Daily Users | Campaign | Measures total daily users from campaigns, indicating sustained campaign activity. |
🔗 Matomo Dimensions
The table below lists the Matomo Dimensions available through the Whatsdash Matomo Integration.
| Name | Category | Why It’s Useful |
|---|---|---|
| Country Name | Location | Helps identify where your visitors are coming from for regional performance analysis. |
| Country Code | Location | Useful for mapping and filtering traffic data by country codes in dashboards. |
| language | Language | Reveals user language preferences, aiding localization and content optimization. |
| Device | Device | Identifies device types (mobile, desktop, tablet) to optimize for user experience. |
| Page URL | Pages | Tracks which pages users visit most, helping identify top-performing content. |
| Referrer Name | Referrers | Shows which external sources or campaigns drive the most traffic. |
| Search Engine Name | Searchengine | Helps understand which search engines generate organic traffic. |
| Search Engine URL | Searchengine | Provides deeper insight into search engine referral sources. |
| Campaign Name | Campaign | Tracks traffic and conversions driven by specific marketing campaigns. |
| Year | Time | Enables analysis of annual trends in traffic and engagement. |
| Year Of Week | Time | Groups visits by week-year combinations for consistent weekly performance analysis. |
| Year Of Week(ISO) | Time | Provides ISO-standard week grouping for precise cross-region reporting. |
| Year Month | Time | Useful for monitoring month-over-month changes and seasonal trends. |
| Month | Time | Enables month-based traffic segmentation and reporting. |
| Year Week | Time | Helps identify week-level changes in user behavior over the year. |
| Year Week(ISO) | Time | Offers standardized week format for comparing weekly data internationally. |
| Week | Time | Tracks weekly visit patterns and engagement fluctuations. |
| Week(ISO) | Time | Ensures consistent week segmentation in international reporting. |
| Day Of Month | Time | Useful for daily trend and activity pattern monitoring. |
| Day Of Week Name | Time | Reveals which weekdays attract the most user engagement. |
| Day Of Week Name(ISO) | Time | Standardized weekday mapping for consistent multi-region analytics. |
| Date | Time | Allows detailed date-level trend analysis and traffic tracking. |
🔗 Explore More Integrations
Whatsdash supports a wide range of marketing, analytics, and eCommerce integrations to give you a holistic view of your business performance.
👉 Visit the Integrations Page to explore all available connections
Quora Ads
The Quora Ads integration allows the admin to pull detailed campaign performance data, including impressions, clicks, conversions, and cost metrics, directly into Whatsdash for comprehensive ad spend analysis and optimization alongside other marketing channels.
Why Connect Quora Ads to Whatsdash?
Integrating your Quora Ads data with Whatsdash provides a clear, centralized view of your advertising ROI on the platform, helping you move beyond basic campaign reports to actionable cross-channel insights.
-
Targeted ROI Measurement: Analyze which specific Quora campaigns, ad sets, and ads are driving the highest quality conversions and revenue, allowing you to instantly allocate budget to top performers.
-
Cross-Channel Performance Comparison: Blend Quora's click and conversion data with metrics from other relevant Integrations to determine its true contribution within your overall marketing mix.
-
Simplified Reporting for Stakeholders: Use pre-built or custom templates to create high-level dashboards that clearly communicate Quora Ads performance to clients or management without requiring them to navigate the Quora Ads Manager interface.
📋 Steps to Integrate your Quora Ads Account to Whatsdash
Integrating Quora Ads requires authentication via OAuth to grant Whatsdash secure access to your campaign data.
✔️ Navigate to the 'Integrations' page using the Navigation bar.
✔️ Select Quora Ads from the Available Integrations.
✔️ Click the + button to open the Quora Ads authorization window.

✔️ You will be redirected to the official Quora login page. Enter the credentials for the Quora account that has Admin access to your Quora Ads accounts.

✔️ Review the permissions requested by Whatsdash (e.g., Read access to your Ad Account data) and click the button to Allow access.
✔️ Once authenticated, you will be directed back to Whatsdash. A screen will prompt you to Select the specific Quora Ad Accounts you wish to track and report on. Select the desired accounts.
✔️ Your Quora Ads Integration will appear in the Connected Integrations list. qads1
✔️ You can now create or customize dashboards using your Quora Ads Metrics and Dimensions.
👉 How to visualize this data in your dashboard, visit the Dashboard Documentation Guide
🔗 Quora Ads Metrics
The table below lists the Quora Ads Metrics available through the Whatsdash Quora Ads Integration.
| Name | Category | Why it’s Useful |
|---|---|---|
| Clicks | Campaign | Total number of clicks; measures engagement with your ads. |
| Conversions | Campaign | Total number of conversions; indicates campaign effectiveness in driving actions. |
| Conversion Rate | Campaign | Rate of conversions relative to clicks; shows efficiency of the campaign. |
| Cost Per Click (CPC) | Campaign | Average cost per click; helps optimize bidding strategy and ROI. |
| Click Through Rate (CTR) | Campaign | Ratio of clicks to impressions; measures ad relevance and effectiveness. |
| Impressions | Campaign | Number of times ads were shown; provides reach and exposure insight. |
| Spend | Campaign | Total amount spent; tracks actual cost against budget. |
| Daily Budget | Budget | Daily budget for the campaign; ensures spending stays within planned limits. |
| Lifetime Budget | Budget | Total budget for the campaign; useful for long-term planning. |
| Leads Generated | Leads | Total number of leads captured; measures lead generation success. |
| Form Completion Rate | Leads | Percentage of completed forms relative to leads; indicates lead quality. |
| Cost Per Lead | Leads | Average cost per lead; helps evaluate cost efficiency of lead generation efforts. |
🔗 Quora Ads Dimensions
The table below lists the Quora Ads Dimensions available through the Whatsdash Quora Ads Integration.
| Name | Category | Why it’s Useful |
|---|---|---|
| Account ID | Account | Unique identifier for the ad account; helps track data across multiple accounts. |
| Account Name | Account | Name of the account for easy identification. |
| Account Currency | Account | Currency used in the account; important for financial and ROI calculations. |
| Ad ID | Ad | Unique identifier for each ad; critical for performance tracking. |
| Ad Name | Ad | Name of the ad for easy reference in reporting. |
| Landing URL | Ad | URL where users land after clicking the ad; useful for conversion tracking. |
| Ad Set ID | Ad Set | Unique identifier for an ad set; helps organize multiple ads under a campaign. |
| Ad Set Name | Ad Set | Name of the ad set; aids in grouping and reporting. |
| Bid Amount | Ad Set | The bid value for the ad set; helps analyze cost and budget allocation. |
| Campaign ID | Campaign | Unique identifier for a campaign; ensures proper data segmentation. |
| Campaign Name | Campaign | Name of the campaign; helps track performance across campaigns. |
| Status | Campaign | Current campaign status (active, paused, etc.); crucial for monitoring live campaigns. |
| Year | Time | Calendar year of campaign activity; helps with time-based trend analysis. |
| Year Of Week | Time | Year associated with a specific week; useful for weekly reporting. |
| Year Of Week(ISO) | Time | ISO standard year of the week; ensures consistency across datasets. |
| Year Month | Time | Year and month combination; useful for monthly trend analysis. |
| Month | Time | Numeric month value; allows for monthly aggregation and reporting. |
| Year Week | Time | Year and week combination; aids weekly trend tracking. |
| Year Week(ISO) | Time | ISO standard year-week; ensures standardized weekly reporting. |
| Week | Time | Week number; helps in weekly performance tracking. |
| Week(ISO) | Time | ISO week number; standardizes week-based analysis. |
| Day Of Month | Time | Day of the month; enables daily trend analysis. |
| Day Of Week Name | Time | Name of the day; useful for day-of-week performance patterns. |
| Day Of Week Name(ISO) | Time | ISO day-of-week name; ensures standardized weekly reporting. |
| Date | Time | Exact date in YYYYMMDD format; essential for precise time-series analysis. |
🔗 Explore More Integrations
Whatsdash supports a wide range of marketing, analytics, and eCommerce integrations to give you a holistic view of your business performance.
👉 Visit the Integrations Page to explore all available connections
Taboola Integration
Taboola is a leading content discovery and native advertising platform that powers recommendations across the open web.
Why Connect Taboola to Whatsdash?
Integrating your Taboola data with Whatsdash transforms raw campaign metrics into clear, actionable business insights, enabling rapid optimization of your content and spend.
-
Centralized Performance Monitoring: Instantly track key Metrics like Clicks, Impressions, and Spend across all your Taboola campaigns in one dashboard, eliminating the need to log into the Taboola Backstage interface repeatedly.
-
Cross-Channel ROI Analysis: Blend your Taboola campaign cost and conversion data with Metrics from Google Analytics 4, CRM, and eCommerce platforms for accurate Return On Ad Spend (ROAS) calculations and comprehensive funnel analysis.
-
Granular Optimization: Leverage detailed breakdown Dimensions like Site Name, Country Name, and Item Name to quickly identify high-performing content and placements, allowing you to reallocate budget for maximum efficiency.
📋 Steps to Integrate your Taboola Account to Whatsdash
✔️ Navigate to the 'Integrations' page using the Navigation bar.
✔️ Select Taboola from the Available Integrations.

✔️ Click the + button to open the Taboola authorization window.

✔️ You will be prompted to enter your Client ID and Client Secret to allow Whatsdash to access your Taboola data via the API.

✔️ Once authenticated, you will be directed back to Whatsdash. Your Taboola Integration will appear in the Connected Integrations list.
✔️ You can now create or customize dashboards using your Taboola Metrics and Dimensions.
👉 How to visualize this data in your dashboard, visit the Dashboard Documentation Guide.
🔗 Taboola Metrics
The table below lists the Taboola Metrics available through the Whatsdash Taboola Integration.
| Name | Category | Why it’s useful |
|---|---|---|
| Clicks | Campaign | Measures the total number of user clicks, indicating engagement. |
| Impressions | Campaign | Shows how many times ads were displayed, useful for reach and exposure analysis. |
| Visible Impressions | Campaign | Counts only ads that were viewable, important for accurate performance evaluation. |
| Spent | Campaign | Total money spent on the campaign, necessary for ROI calculations. |
| Conversions Value | Campaign | Revenue generated from conversions, key for business impact assessment. |
| ROAS | Campaign | Return On Ad Spend, helps measure overall efficiency of ad spend. |
| ROAS Clicks | Campaign | ROAS for click-through conversions, useful for understanding paid clicks’ effectiveness. |
| ROAS Views | Campaign | ROAS for view-through conversions, important for assessing passive engagement. |
| CTR | Campaign | Click Through Rate, shows the proportion of impressions resulting in clicks. |
| Viewable CTR | Campaign | Click rate on viewable impressions, more accurate indicator of ad effectiveness. |
| CPM | Campaign | Cost per 1000 impressions, standard metric for ad pricing and efficiency. |
| Viewable CPM | Campaign | Cost per 1000 viewable impressions, important for evaluating true ad visibility costs. |
| CPC | Campaign | Cost per click, used to understand the efficiency of clicks relative to spend. |
| Campaign Count | Campaign | Number of campaigns in the timeframe, useful for portfolio-level analysis. |
| CPA | Campaign | Cost per conversion/action, key metric for ROI and efficiency evaluation. |
| CPA Clicks | Campaign | Cost per click-through conversion, useful for assessing performance of direct clicks. |
| CPA Views | Campaign | Cost per view-through conversion, important for passive engagement ROI. |
| CPA Conversion Rate | Campaign | Overall conversion rate, shows how efficiently clicks convert to actions. |
| CPA Conversion Rate Clicks | Campaign | Click-through conversion rate, indicates the effectiveness of clicked ads. |
| CPA Conversion Rate Views | Campaign | View-through conversion rate, shows effectiveness of passive ad exposure. |
| CPA Action Count | Campaign | Total conversions/actions, useful for volume-based performance tracking. |
| CPA Click Action Count | Campaign | Total click-through conversions, important for analyzing click-driven performance. |
| CPA View Action Count | Campaign | Total view-through conversions, important for evaluating passive engagement. |
🔗 Taboola Dimensions
The table below lists the Taboola Dimensions available through the Whatsdash Taboola Integration.
| Name | Category | Why it’s useful |
|---|---|---|
| Campaign ID | Campaign | Identifies each campaign uniquely for performance tracking and reporting. |
| Campaign Name | Campaign | Helps recognize campaigns easily by name during analysis and reporting. |
| Traffic Allocation Mode | Campaign | Indicates how traffic is distributed among ad variations, useful for testing strategies. |
| Campaign Learning State | Campaign | Shows the optimization or learning status of a campaign, indicating readiness and performance stability. |
| Alphabetic Site ID | Site | Identifies the site (account) using an alphanumeric ID for reference in data sources. |
| Site Name | Site | Provides the human-readable name of the site, aiding in reporting clarity. |
| Site ID | Site | Represents the numeric site identifier for internal tracking and API integrations. |
| Country Code | Country | Shows the two-letter ISO country code, used for geographic segmentation and filtering. |
| Country Name | Country | Provides the full country name, improving readability in reports. |
| Region Name | Region | Identifies specific regional performance within a country for targeted analysis. |
| DMA Name | DMA | Displays U.S. Designated Market Area names for granular U.S.-based campaign analysis. |
| Platform Code | Platform | Machine-readable identifier for ad delivery platforms (e.g., mobile, desktop). |
| Platform Name | Platform | Human-readable name of the ad delivery platform, improving analysis readability. |
| OS Name | OS Family | Displays the operating system family (e.g., Android, iOS) for device performance analysis. |
| OS Version | OS Version | Shows the OS version, useful for understanding performance across software updates. |
| Browser Name | Browser | Indicates which browser is used by the audience, useful for optimization and compatibility insights. |
| Currency Code | Currency | Displays the currency used in campaign reporting for accurate financial analysis. |
| Year | Time | Shows the reporting year, useful for annual trend and performance comparisons. |
| Year Of Week | Time | Represents the year associated with each week, helpful for time-series grouping. |
| Year Of Week(ISO) | Time | Displays ISO-standard year-week grouping for consistent global reporting. |
| Year Month | Time | Combines year and month for simplified monthly trend analysis. |
| Month | Time | Displays the month number, used for monthly comparisons and filters. |
| Year Week | Time | Represents the week number within a year, useful for weekly trend visualization. |
| Year Week(ISO) | Time | Provides ISO-standard week identifiers for globally consistent weekly reports. |
| Week | Time | Shows the week number for easier short-term trend analysis. |
| Week(ISO) | Time | Displays ISO-standard week numbering for consistent global analysis. |
| Day Of Month | Time | Identifies which day of the month data belongs to, used for daily breakdowns. |
| Day Of Week Name | Time | Displays the weekday name (e.g., Tuesday), used for identifying weekly behavioral trends. |
| Day Of Week Name(ISO) | Time | Provides ISO-standard weekday names for uniform cross-regional reporting. |
| Date | Time | Shows the specific date (YYYYMMDD), used for precise daily performance tracking. |
🔗 Explore More Integrations
Whatsdash supports a wide range of marketing, analytics, and eCommerce integrations to give you a holistic view of your business performance.
👉 Visit the Integrations Page to explore all available connections
Stripe
Stripe is a leading financial infrastructure platform that provides a suite of APIs and tools for businesses to accept online payments, manage subscriptions, and run their commerce platform.
Why Connect Stripe to Whatsdash?
Integrating your Stripe data with Whatsdash transforms raw transaction records into actionable business insights, helping you to track revenue, manage subscriptions, and understand customer payment behavior.
-
Unified Financial Reporting: Gain a holistic view of your financial health by blending detailed Stripe transactions with data from your marketing, CRM, and inventory systems in one dashboard.
-
Subscription Performance Monitoring: Easily track and visualize crucial SaaS and subscription metrics like Monthly Recurring Revenue (MRR), Churn Rate, and Customer Lifetime Value (LTV) without complex SQL queries or tool-hopping.
-
Custom Metrics & Granular Control: Go beyond Stripe's standard reports by creating custom Metrics and visualizations based on transaction, customer, and billing data, giving you precise control over your financial narrative.
📋 Steps to Integrate your Stripe Account to Whatsdash
✔️ Navigate to the 'Integrations' page using the Navigation bar.
✔️ Select Stripe from the Available Integrations.
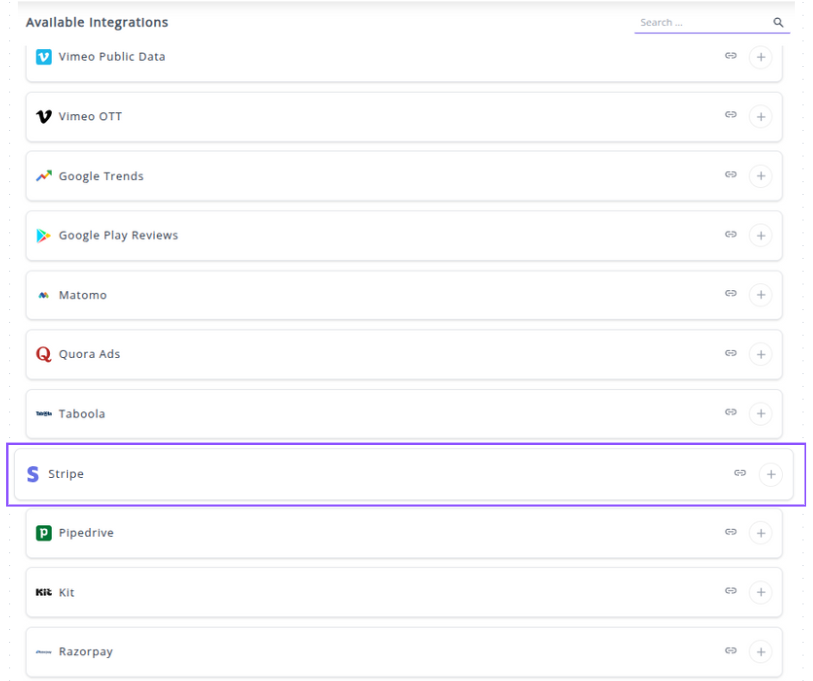
✔️ Click the + button to open the Stripe authorization window.
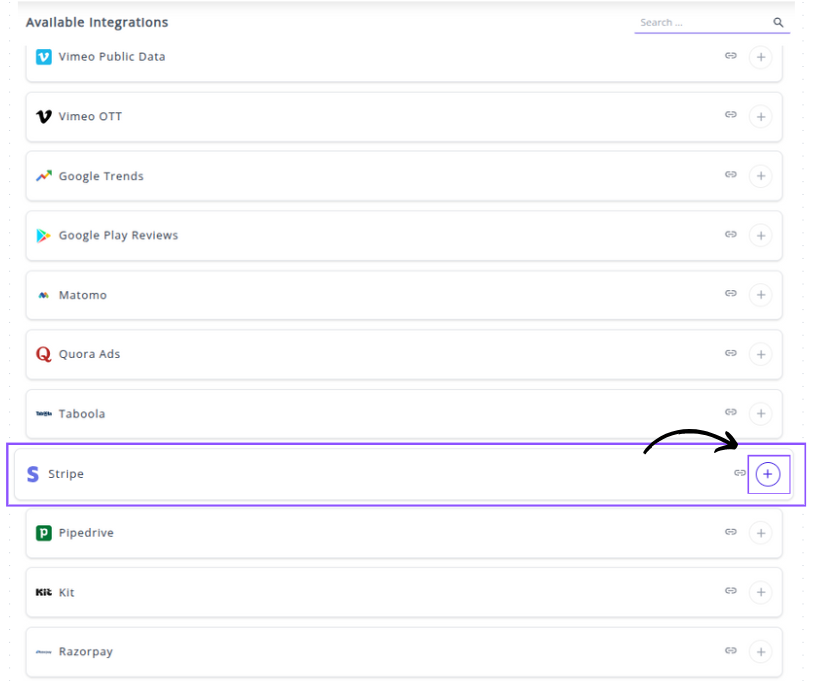
✔️ The popup window appears for the following fields to fill for the connection.
- API Key: Paste your Stripe Secret Key here.

✔️ Click Next button. Your Stripe Integration will appear in the Connected Integrations list.
✔️ Once authenticated, you will be directed back to Whatsdash. Your Stripe Integration will appear in the Connected Integrations list.
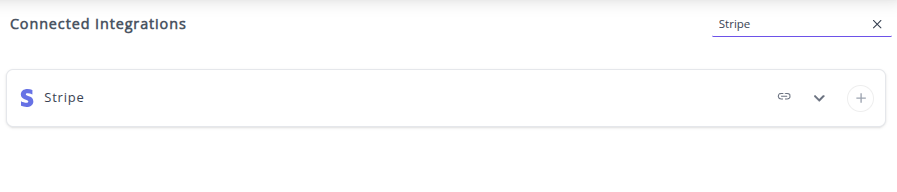
✔️ You can now create or customize dashboards using your Stripe Metrics and Dimensions.
👉 How to visualize this data in your dashboard, visit the Dashboard Documentation Guide.
🔗 Stripe Metrics
The table below lists the Stripe Metrics available through the Whatsdash Stripe Integration.
| Name | Category | Why it’s useful |
|---|---|---|
| Monthly Recurring Revenue (MRR) | subscriptions | Measures recurring revenue from active subscriptions, useful for growth tracking and forecasting. |
| Payment Amount | payments | Represents the total intended payment, useful for revenue reporting and reconciliation. |
| Payments Count | payments | Tracks the total number of payment attempts, including successes and failures, for volume and operational analysis. |
| Refund Count | refunds | Tracks the number of refunds issued, useful for monitoring refund rates and operational issues. |
| Discount | subscriptions | Shows total discounts applied, useful for understanding promotional impact and revenue adjustments. |
| Received Amount | payments | Total amount successfully received, essential for revenue tracking and financial reporting. |
| Subscription Count | subscriptions | Total subscriptions managed, useful for understanding customer engagement and subscription growth. |
| Subscription Amount | subscriptions | Total amount per subscription, useful for revenue calculation and MRR derivation. |
| Subscription Quantity | subscriptions | Tracks the number of units per subscription, useful for detailed revenue and usage analysis. |
| Average Payment Amount | payments | Shows average payment size, helpful for understanding customer behavior and payment trends. |
| Refund Amount | refunds | Total amount refunded, useful for revenue reconciliation and assessing refund impact. |
| Customer Count | customers | Tracks unique paying customers, essential for customer acquisition and retention analysis. |
🔗 Stripe Dimensions
The table below lists the Stripe Dimensions available through the Whatsdash Stripe Integration.
| Name | Category | Why it’s useful |
|---|---|---|
| Customer | payments | Links payments to specific customers for reporting and analysis. |
| Refund Date | refunds | Tracks when a refund was created, useful for monitoring refund trends. |
| Year | Time | Enables yearly aggregation and time-based reporting. |
| Year Month | Time | Useful for monthly trend analysis and reporting. |
| Year Week | Time | Allows weekly reporting and trend comparison. |
| Year Week(ISO) | Time | ISO-standard week tracking for consistent weekly analysis. |
| Day Of Month | Time | Enables day-level analysis of payments, refunds, or subscriptions. |
| Date | Time | Exact date of events, crucial for daily reporting and time series analysis. |
| Customer Created Date | customers | Tracks when customers were created, helpful for cohort analysis. |
| Currency | customers | Identifies the currency for transactions, necessary for financial reporting. |
| Month | Time | Monthly segmentation for reporting and trend identification. |
| Week | Time | Weekly segmentation for trend monitoring. |
| Week(ISO) | Time | ISO-standard week segmentation for consistent reporting. |
| Day Of Week Name | Time | Useful for understanding weekly patterns and trends. |
| Payment Date | payments | Tracks when payments occur, enabling payment trend analysis. |
| Payment Status | payments | Monitors payment completion and issues, ensuring operational oversight. |
| Price ID | subscriptions | Links subscription plans to payments for product-level reporting. |
| Year Of Week(ISO) | Time | ISO-standard yearly week for accurate weekly time analysis. |
| Refund ID | refunds | Unique identifier for refunds, used for tracking and reconciliation. |
| Refund Status | refunds | Tracks the current state of refunds, helping identify pending or failed refunds. |
| Subscription Status | subscriptions | Indicates active, canceled, or pending subscriptions for lifecycle analysis. |
| Subscription Created Date | subscriptions | Tracks subscription start date for cohort and retention analysis. |
| Year Of Week | Time | Year + week, useful for weekly trend reporting. |
| Day Of Week Name(ISO) | Time | ISO-standard day names, useful for global weekly trend analysis. |
🔗 Explore More Integrations
Whatsdash supports a wide range of marketing, analytics, and eCommerce integrations to give you a holistic view of your business performance.
👉 Visit the Integrations Page to explore all available connections
Pipedrive
Pipedrive is a sales Customer Relationship Management (CRM) platform designed to help sales teams manage deals, track activities, and optimize their sales pipelines.
Connecting Pipedrive to Whatsdash integrates your detailed sales pipeline, activity, and deal performance data directly into Whatsdash for real-time sales reporting, forecasting, and cross-departmental analysis.
Why Connect Pipedrive to Whatsdash?
Integrate your Pipedrive data with Whatsdash to transform raw CRM data into clear, visual dashboards that provide instantaneous insights into the health of your sales pipeline and the performance of your team.
-
Real-Time Pipeline Visibility: Get a live, consolidated view of your sales funnel, tracking deal movement, expected revenue, and conversion rates across all stages without manually exporting data or logging into the Pipedrive app.
-
Activity & Performance Monitoring: Easily track key sales Metrics like the number of calls made, emails sent, and activities completed by individual sales reps or teams, allowing you to instantly identify high-performing behaviors and coaching opportunities.
-
Holistic Business Analysis: Blend Pipedrive deal data with marketing spend from your ad platforms (GA4, Facebook Ads) to calculate true Customer Acquisition Cost (CAC) and measure marketing-to-sales ROI.
📋 Steps to Integrate your Pipedrive Account to Whatsdash
✔️ Navigate to the 'Integrations' page using the Navigation bar.
✔️ Select Pipedrive from the Available Integrations.

✔️ Click the + button to open the Pipedrive authorization window.

✔️ You will be redirected to the official Pipedrive login page. Enter the credentials for the Pipedrive account that has Admin access to your company's CRM data.
✔️ Review the permissions requested by Whatsdash (e.g., Read access to Deals, Activities, and Organizations) and click the button to Allow and Install the integration.
✔️ Once authenticated, you will be directed back to Whatsdash. Your Pipedrive Integration will appear in the Connected Integrations list.
✔️ You can now create or customize dashboards using your Pipedrive Metrics and Dimensions.
👉 How to visualize this data in your dashboard, visit the Dashboard Documentation Guide.
🔗 Pipedrive Metrics
The table below lists the Pipedrive Metrics available through the Whatsdash Pipedrive Integration.
| Name | Category | Why it’s Useful |
|---|---|---|
| Deal | Deal | Total number of deals; provides a quick overview of pipeline volume. |
| Deal Value | Deal | Expected monetary value of deals; critical for revenue forecasting. |
| Deal Probability | Deal | Likelihood of closing a deal; helps prioritize opportunities and forecast accurately. |
| Leads | Lead | Total number of leads; gives insight into potential opportunities entering the pipeline. |
| Leads Value | Lead | Estimated value of all leads; aids in revenue potential assessment before conversion. |
🔗 Pipedrive Dimensions
The table below lists the Pipedrive Dimensions available through the Whatsdash Pipedrive Integration.
| Name | Category | Why it’s Useful |
|---|---|---|
| Deal Id | Deal | Unique identifier for each deal; essential for tracking and referencing deals. |
| Deal Title | Deal | Describes the deal; helps identify opportunities quickly. |
| Deal Status | Deal | Indicates if the deal is open, won, lost, or inactive; key for sales pipeline tracking. |
| Deal Currency | Deal | Tracks the currency of the deal; important for financial reporting. |
| Deal Origin | Deal | Shows where the deal came from (referral, web lead, etc.); useful for analyzing lead sources. |
| Deal Origin ID | Deal | Links the deal to a specific source or campaign; helps measure source effectiveness. |
| Deal Channel | Deal | Communication channel used (email, phone, social media); informs engagement strategy. |
| Deal Channel ID | Deal | Unique identifier for the channel; ensures precise tracking of interactions. |
| Deal Is Delete | Deal | Shows if a deal has been deleted; helps maintain data accuracy. |
| Deal Visible To | Deal | Specifies visibility of the deal (private/team/org); useful for access control. |
| Deal Lost Reason | Deal | Explains why a deal was lost; aids in improving sales strategy. |
| Person ID | Deal | Links the deal to a specific contact or company; crucial for CRM relationships. |
| Owner ID | Deal | Identifies the sales rep responsible; tracks performance and accountability. |
| Stage ID | Deal | Identifies the stage in the sales pipeline; monitors deal progression. |
| Pipeline ID | Deal | Links the deal to a pipeline; helps manage multiple sales workflows. |
| Lead ID | Lead | Unique identifier for a lead; essential for lead management and tracking. |
| Lead Title | Lead | Describes the lead; allows quick identification of prospects. |
| Lead Currency | Lead | Tracks monetary value of the lead; used for forecasting and reporting. |
| Lead Source Name | Lead | Indicates where the lead originated; useful for marketing analysis. |
| Lead Origin | Lead | Specific method/platform of lead generation; aids campaign performance evaluation. |
| Lead Origin ID | Lead | Unique ID linking lead to a source or campaign; enables precise reporting. |
| Lead Channel | Lead | Channel through which lead was acquired; helps optimize outreach. |
| Lead Channel ID | Lead | Unique identifier for the channel; ensures accurate tracking. |
| Is Archived | Lead | Shows if a lead/deal is archived; helps maintain active records. |
| Was Seen | Lead | Indicates if the lead/deal was interacted with; informs follow-up strategy. |
| Label IDs | Lead | Categorizes leads; helps segment and prioritize prospects. |
| Visible To | Lead | Controls access to lead information; important for privacy and team management. |
| CC Email | Lead | Email to receive communications; supports collaborative workflows. |
| Owner ID | Lead | Identifies responsible user; tracks lead ownership. |
| Creator ID | Lead | Shows who created the lead/deal; useful for accountability. |
| Organization ID | Lead | Links lead/deal to a company; central for B2B tracking. |
| Next Activity ID | Lead | Next scheduled activity; ensures timely follow-ups. |
| Person ID | Lead | Links to a contact/stakeholder; vital for CRM relationships. |
| Year | Time | Year of record; supports time-based reporting. |
| Year Of Week | Time | Year for week-based grouping; useful for weekly trends. |
| Year Of Week(ISO) | Time | ISO standard for week-year; ensures consistency in reporting. |
| Year Month | Time | Year and month of record; useful for monthly trend analysis. |
| Month | Time | Month of record; enables monthly reporting. |
| Year Week | Time | Year and week number; supports weekly analytics. |
| Year Week(ISO) | Time | ISO week-year; ensures standardization across datasets. |
| Week | Time | Week number (01–53); for weekly reporting. |
| Week(ISO) | Time | ISO week number; aligns with global standards. |
| Day Of Month | Time | Day of the month; for daily-level reporting. |
| Day Of Week Name | Time | Name of the day (e.g., Tuesday); supports weekday trend analysis. |
| Day Of Week Name(ISO) | Time | ISO standard day name; ensures reporting consistency. |
| Date | Time | Full date (YYYYMMDD); allows detailed time-series analysis. |
🔗 Explore More Integrations
Whatsdash supports a wide range of marketing, analytics, and eCommerce integrations to give you a holistic view of your business performance.
👉 Visit the Integrations Page to explore all available connections
Kit
Kit is an email marketing platform designed for creators, bloggers, and small businesses to manage and monetize their audience through email campaigns, landing pages, and sophisticated automation workflows.
Why Connect Kit to Whatsdash?
Integrating your Kit data with Whatsdash centralizes your audience growth and monetization metrics, giving you a clear, single source of truth for your creator business performance.
-
Audience Growth Monitoring: Easily track and visualize key email marketing Metrics like Total Subscribers, New Subscribers, and Unsubscribes alongside your website traffic to measure list health and growth effectiveness.
-
Sales & Monetization Insights: See revenue from your digital product sales and paid newsletters directly in the dashboard, enabling you to calculate the true value of your email list.
-
Campaign Performance & Segmentation: Analyze the performance of your automated email Sequences and individual Broadcasts (open rates, click rates) and segment your data by Tags to measure the engagement of specific audience groups.
📋 Steps to Integrate your Kit Account to Whatsdash
✔️ Navigate to the 'Integrations' page using the Navigation bar.
✔️ Select Kit from the Available Integrations.
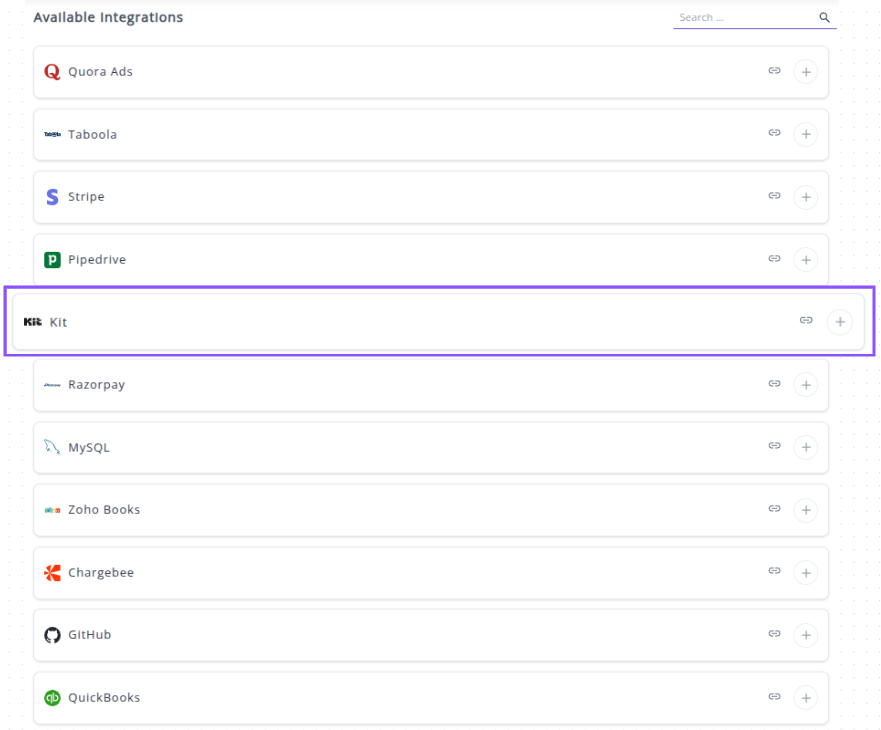
✔️ Click the + button.

Authorization in the Kit Window

✔️ A new window will open, redirecting you to the Kit login page.
- If you are not already logged in, Sign in to the Kit account that you wish to connect.
- If you are logged in, you will be taken directly to the permission screen.
✔️ On the permission screen, Grant Whatsdash the necessary permissions to access your subscriber, campaign, and monetization data for reporting purposes.
✔️ Once authenticated, you will be automatically redirected back to Whatsdash. Your Kit Integration will now appear in the Connected Integrations list.
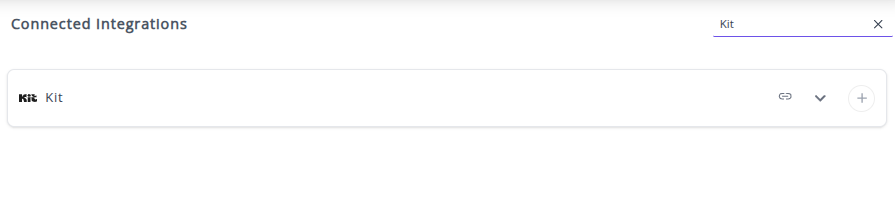
✔️ You can now create or customize dashboards using your Kit Metrics and Dimensions.
👉 How to visualize this data in your dashboard, visit the Dashboard Documentation Guide.
🔗 Kit Metrics
The table below lists the Kit Metrics available through the Whatsdash Kit Integration.
| Name | Category | Why it’s useful |
|---|---|---|
| Recipients | Broadcasts | Number of recipients for a broadcast, helps measure reach and audience size. |
| Open rate | Broadcasts | Percentage of recipients who opened the broadcast, key for engagement analysis. |
| Click rate | Broadcasts | Percentage of recipients who clicked links, indicates content effectiveness. |
| Total clicks | Broadcasts | Total number of clicks, useful for measuring interaction with the broadcast. |
| Unsubscribes | Broadcasts | Number of unsubscribes, important for monitoring subscriber retention. |
| Progress | Broadcasts | Shows broadcast delivery progress, useful for workflow tracking. |
| Discount | Purchases | Discount applied on purchases, helps track promotional impact. |
| Subtotal bill | Purchases | Purchase subtotal before tax, useful for financial breakdown. |
| Tax | Purchases | Tax applied to purchases, necessary for accurate financial reporting. |
| Total bill | Purchases | Total amount billed including taxes, critical for revenue reporting. |
| Total forms | Forms | Number of forms, useful for tracking lead capture efforts. |
| Total tags | Tags | Total tags in the system, helps measure segmentation complexity. |
| Total segments | Segments | Total audience segments, useful for analyzing segmentation and targeting. |
| Total sequences | Sequences | Number of sequences, helps monitor automation workflows. |
| Total subscribers | Subscribers | Total subscribers in the system, essential for growth tracking. |
| Total email templates | Email Templates | Total templates created, useful for template management and usage tracking. |
🔗 Kit Dimensions
The table below lists the Kit Dimensions available through the Whatsdash Kit Integration.
| Name | Category | Why it’s useful |
|---|---|---|
| Created at | Broadcasts | Timestamp when the broadcast was created, useful for tracking campaign timing. |
| Broadcast subject | Broadcasts | Subject of broadcasts, helps in analyzing engagement based on subject lines. |
| Description | Broadcasts | Content description, useful for understanding broadcast purpose or content type. |
| Published at | Broadcasts | Date broadcast went live, useful for scheduling and performance analysis. |
| Send at | Broadcasts | Date/time broadcast was sent, helps measure delivery efficiency. |
| Public | Broadcasts | Indicates if broadcast is public, useful for segmentation and reporting. |
| Email address | Broadcasts | Email associated with the broadcast, useful for targeting or auditing. |
| ID | Broadcasts | Unique broadcast identifier, essential for linking analytics or tracking. |
| Preview text | Broadcasts | Shows snippet preview, helps assess engagement before sending. |
| Content | Broadcasts | Full content of the broadcast, useful for content analysis. |
| Status | Broadcasts | Current status of broadcast (draft/sent), helps in workflow tracking. |
| Format | Forms | Form type or layout, useful for analyzing form performance. |
| Name | Forms | Form name, helps identify specific forms in reporting. |
| Created at | Forms | Timestamp when form was created, useful for growth and performance tracking. |
| Archived | Forms | Indicates if the form is archived, helps in filtering active forms. |
| Type | Forms | Type of form, useful for segmenting responses. |
| Subscribers | Subscriber email address, core for campaign targeting and reporting. | |
| First Name | Subscribers | Subscriber first name, useful for personalization and segmentation. |
| State | Subscribers | Subscriber state, helps with geographical segmentation. |
| Created at | Subscribers | When subscriber joined, useful for lifecycle analysis. |
| ID | Subscribers | Unique subscriber identifier, essential for linking events. |
| Name | Tags | Tag name, useful for categorizing subscribers or campaigns. |
| Created at | Tags | Timestamp when tag was created, helps track tagging trends. |
| ID | Tags | Unique tag identifier, essential for reporting and automation. |
| ID | Email Templates | Template ID, useful for linking templates to campaigns. |
| Templates category | Email Templates | Helps categorize templates, useful for reporting/template management. |
| Name | Email Templates | Template name, helps identify specific templates. |
| Is default | Email Templates | Indicates default template, useful for system settings and selection. |
| ID | Purchases | Unique purchase identifier, essential for transaction tracking. |
| Email address | Purchases | Customer email associated with purchase, useful for revenue analysis. |
| Currency | Purchases | Transaction currency, necessary for financial reporting. |
| Transaction ID | Purchases | Transaction identifier, useful for audits and reconciliation. |
| Transaction time | Purchases | Timestamp of purchase, helps track trends and lifecycle. |
| Status | Purchases | Purchase status (completed/pending), important for monitoring revenue flow. |
| ID | Segments | Segment identifier, useful for targeting and analytics. |
| Name | Segments | Segment name, helps categorize audiences. |
| Created at | Segments | Segment creation timestamp, useful for tracking audience evolution. |
| ID | Sequences | Sequence identifier, useful for tracking automated campaigns. |
| Name | Sequences | Sequence name, helps identify automation workflows. |
| Created at | Sequences | When the sequence was created, useful for scheduling and reporting. |
| Year | Time | Year of the event, useful for yearly trends and analysis. |
| Month | Time | Month of the event, helps with monthly reporting. |
| Year Month | Time | Year and month combined, useful for monthly aggregated reporting. |
| Week | Time | Week of the year, useful for weekly analysis. |
| Week(ISO) | Time | ISO week, standard week numbering for analysis consistency. |
| Year Week | Time | Year and week combined, useful for weekly trend analysis. |
| Year Week(ISO) | Time | ISO-compliant year and week, helps standardize weekly reporting. |
| Year Of Week | Time | Year corresponding to a week, useful for grouping weekly data by year. |
| Year Of Week(ISO) | Time | ISO year for a given week, ensures standardized weekly reporting. |
| Day Of Month | Time | Day of the month, useful for daily reporting. |
| Day Of Week Name | Time | Name of the day (e.g., Monday), useful for analyzing day-wise trends. |
| Day Of Week Name(ISO) | Time | ISO day name, standardizes day reporting. |
| Date | Time | Full date (YYYYMMDD), essential for precise daily reporting. |
🔗 Explore More Integrations
Whatsdash supports a wide range of marketing, analytics, and eCommerce integrations to give you a holistic view of your business performance.
👉 Visit the Integrations Page to explore all available connections
Razorpay
Razorpay is a leading payment gateway solution that allows businesses to accept, process, and manage online payments through various methods, including credit/debit cards, UPI, net banking, and digital wallets.
Why Connect Razorpay to Whatsdash?
Integrating your Razorpay financial data with Whatsdash transforms raw transaction logs into clear, real-time profitability and sales performance reports alongside your marketing and other business metrics.
-
Unified Financial Reporting: Consolidate payment data—including payments, refunds, and settlements—with your advertising spend and sales funnel metrics in one central dashboard.
-
Real-Time Revenue Insights: Gain immediate clarity on key Metrics like total revenue, transaction count, average payment value, and success rates to monitor financial health as it happens.
-
Transaction-Level Detail & Analysis: Go beyond high-level summaries by using powerful dimensions like Payment ID, Status, and Currency to filter and analyze specific transaction segments, understand failure reasons, and manage refunds effectively.
📋 Steps to Integrate your Razorpay Account to Whatsdash
✔️ Navigate to the 'Integrations' page using the Navigation bar.
✔️ Select Razorpay from the Available Integrations.

✔️ Click the + button.
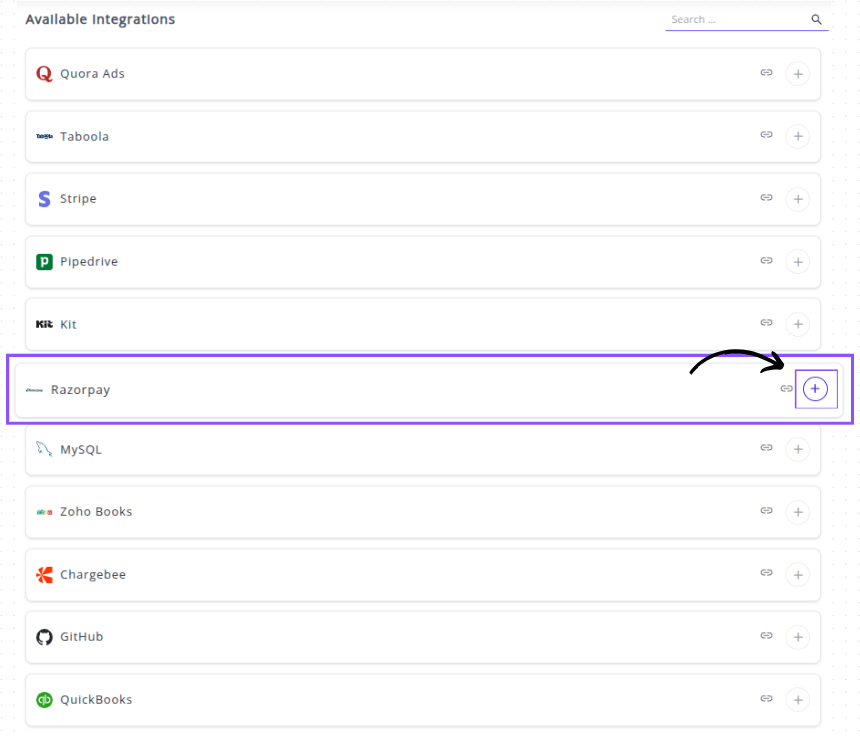
✔️ Enter Credentials into Whatsdash
After clicking the + button, a connection window will appear prompting you to enter the necessary parameters from your Razorpay account:
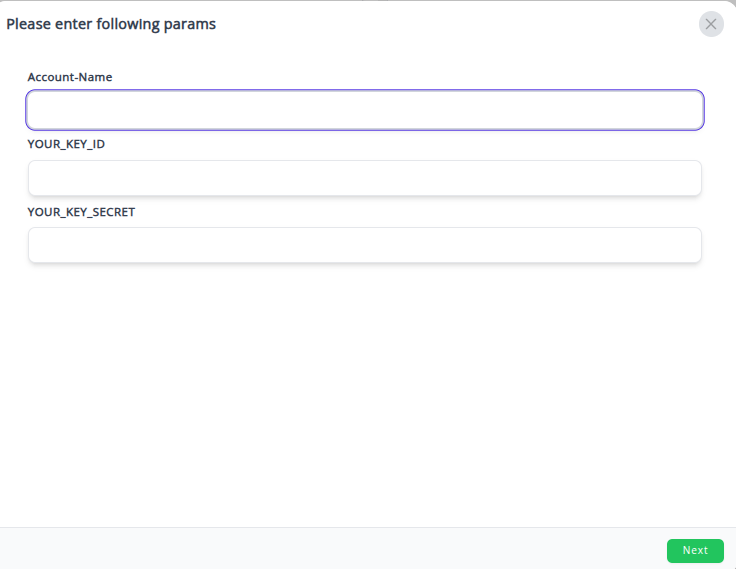
- Account-Name: Enter a descriptive name for this specific connection.
- YOUR_KEY_ID: Paste the Key ID you copied from your Razorpay Dashboard.
- YOUR_KEY_SECRET: Paste the Key Secret you copied and securely saved from your Razorpay Dashboard.
✔️ Your Razorpay integration will appear in the Connected Integrations list.
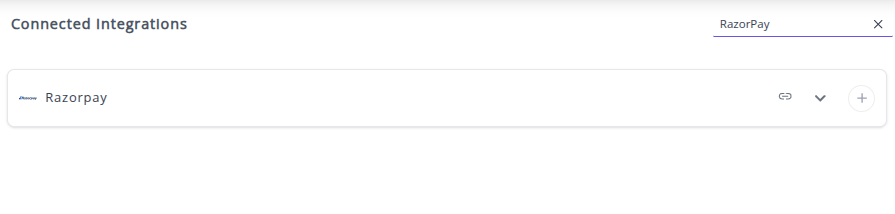
✔️ You can now create or customize dashboards using your Razorpay Metrics and Dimensions.
👉 How to visualize this data in your dashboard, visit the Dashboard Documentation Guide.
🔗 Razorpay Metrics
The table below lists the RazorPay Metrics available through the Whatsdash RazorPay Integration.
| Name | Category | Why it’s useful |
|---|---|---|
| Order Amount | Orders | Total order value, essential for revenue tracking and reporting. |
| Order Amount Paid | Orders | Amount successfully paid, helps track partial/full payments and cash flow. |
| Order Amount Due | Orders | Remaining balance to be paid, useful for monitoring pending payments. |
| Payment Amount | Payment | Total payment received, critical for financial reporting and reconciliation. |
| Payment Amount Refunded | Payment | Amount refunded, helps track customer refunds and adjustments. |
| Payment Fee | Payment | Transaction fees charged by Razorpay, essential for calculating net revenue. |
| Payment Tax | Payment | Tax portion of payment fee, important for accurate tax reporting. |
| Refund Amount | Refund | Total refunded to customer, useful for monitoring returns and financial impact. |
| Invoice Gross Amount | Invoice | Total invoice amount before discounts/taxes, useful for total billing overview. |
| Invoice Tax Amount | Invoice | Tax applied to the invoice, needed for tax reporting and compliance. |
| Invoice Taxable Amount | Invoice | Amount subject to tax, important for accounting and auditing. |
| Invoice Amount | Invoice | Total invoice value including taxes, helps track billing completeness. |
| Invoice Amount Paid | Invoice | Amount actually paid by customer, critical for payment reconciliation. |
| Invoice Amount Due | Invoice | Remaining invoice balance, helps manage collections. |
| Invoice Line Items Amount | Invoice | Amount charged for individual items, useful for itemized revenue reporting. |
| Invoice Line Items Unit Amount | Invoice | Unit price of items, necessary for pricing and margin analysis. |
| Invoice Line Items Gross Amount | Invoice | Total gross for line item, helps assess revenue before discounts/taxes. |
| Invoice Line Items Tax Amount | Invoice | Tax on individual line items, useful for granular tax reporting. |
| Invoice Line Items Taxable Amount | Invoice | Taxable portion of line items, helps in compliance and audits. |
| Invoice Line Items Net Amount | Invoice | Net amount after taxes/discounts, important for final revenue calculation. |
| Invoice Line Items Quantity | Invoice | Quantity of items sold, essential for inventory and sales tracking. |
🔗 Razorpay Dimensions
The table below lists the RazorPay Dimensions available through the Whatsdash RazorPay Integration.
| Name | Category | Why it’s useful |
|---|---|---|
| Order ID | Orders | Unique identifier for the order, essential for tracking and reconciliation. |
| Order Currency | Orders | Currency of the order, needed for multi-currency reporting and conversions. |
| Order Receipt | Orders | Merchant-defined receipt number for internal tracking or customer reference. |
| Order Status | Orders | Shows current order state, important for monitoring payment progression. |
| Payment Created At | Payment | Timestamp of payment initiation, useful for time-based analyses. |
| Payment ID | Payment | Unique payment identifier, critical for retrieving and tracking payments. |
| Payment Currency | Payment | Currency in which payment was made, useful for financial reporting. |
| Payment Status | Payment | Current payment state, helps track completed or failed transactions. |
| Payment Method | Payment | Method used for payment, valuable for analyzing payment trends. |
| Payment Description | Payment | Custom description provided for payment, useful for context or audit. |
| Payment Bank | Payment | Bank used by the customer, useful for tracking netbanking and banking analytics. |
| Payment Email | Payment | Customer email, essential for communication and customer identification. |
| Refund ID | Refund | Unique refund identifier, needed to track specific refund transactions. |
| Refund Currency | Refund | Currency in which the refund was processed, useful for reporting. |
| Refund Created At | Refund | Timestamp of refund initiation, important for financial tracking. |
| Refund Status | Refund | Current refund state, helps monitor completion or failures. |
| Invoice ID | Invoice | Unique identifier for invoices, essential for invoice management. |
| Invoice Receipt | Invoice | Receipt number of the invoice, used for tracking and customer reference. |
| Invoice Number | Invoice | Unique invoice number, important for accounting and reporting. |
| Invoice Customer ID | Invoice | Customer identifier linked to invoice, useful for customer-level analysis. |
| Invoice Customer Name | Invoice | Name of the invoice recipient, needed for identification and reporting. |
| Invoice Customer Email | Invoice | Email of invoice recipient, important for communication. |
| Invoice Customer City | Invoice | City of invoice recipient, useful for geographic reporting. |
| Invoice Customer Country | Invoice | Country of invoice recipient, useful for compliance and reporting. |
| Invoice Created At | Invoice | Timestamp when invoice was created, critical for time-based reporting. |
| Invoice Line Items ID | Invoice | Identifier for each line item, used for product-level tracking. |
| Invoice Line Items Name | Invoice | Name of billed product/service, important for itemized reporting. |
| Invoice Line Items Description | Invoice | Detailed description of items, helpful for audits and clarity. |
| Year | Time | Year (YYYY) for temporal grouping of transactions. |
| Year Of Week | Time | Year for a specific week, useful for weekly analysis. |
| Year Of Week(ISO) | Time | ISO year-week, useful for standardized weekly reporting. |
| Year Month | Time | Year and month (YYYYMM), useful for monthly aggregation. |
| Month | Time | Month (MM), helpful for monthly reporting and trends. |
| Year Week | Time | Year and week (YYYYWW), useful for weekly reporting. |
| Year Week(ISO) | Time | ISO year-week, standardized for cross-system comparison. |
| Week | Time | Week number, helpful for weekly trend analysis. |
| Week(ISO) | Time | ISO week number, useful for standard weekly metrics. |
| Day Of Month | Time | Day of the month, useful for daily reporting. |
| Day Of Week Name | Time | Name of the day, useful for weekday trend analysis. |
| Day Of Week Name(ISO) | Time | ISO weekday name, useful for standardized weekly analysis. |
| Date | Time | Full date (YYYYMMDD), essential for precise daily reporting. |
🔗 Explore More Integrations
Whatsdash supports a wide range of marketing, analytics, and eCommerce integrations to give you a holistic view of your business performance.
👉 Visit the Integrations Page to explore all available connections
MySQL
MySQL is the world's most popular open-source relational database management system, a fundamental component for countless web applications and transactional systems.
Why Connect MySQL to Whatsdash?
Integrating your MySQL database with Whatsdash allows you to unlock the raw power of your transactional and application data, transforming it from a data storage system into a source of real-time, actionable business intelligence for all stakeholders.
-
Simplified Real-Time Reporting: Connect directly to your live database to pull custom datasets and metrics into visual, easy-to-digest dashboards without needing to run complex, repetitive SQL queries.
-
Custom Metrics & Granular Control: Use Whatsdash's interface to build reports based on the exact SQL queries your business needs, creating Custom Metrics and visualizations from any table or view within your database.
-
Data Blending & Cross-Source Analysis: Combine key performance indicators (KPIs) from your MySQL database (like sales orders or user signups) with data from other sources (e.g., Google Ads spend, Shopify inventory) to get a true, holistic view of your business's performance.
📋 Steps to Integrate your MySQL Database to Whatsdash
💡 Tip : When setting up the MySQL connection, always use a dedicated, read-only database user to ensure the reporting tool can only retrieve data, not modify or delete it, maintaining the security and integrity of your live application database.
📋 Steps to Integrate your MySQL Databases to Whatsdash
Integrating your SQL Server instance typically involves providing connection details and credentials to establish a secure link. We will incorporate the detailed steps for selecting the specific data source and defining its schema (Dimensions and Metrics) for Whatsdash.
Step 1: Configure Connection Credentials 🔐
✔️ Navigate to the 'Integrations' page using the Navigation bar.
✔️ Select MySQL from the Available Integrations.

✔️ Click the + button to open the connection configuration window.

✔️ Enter the following required connection parameters for your SQL Server Connection:

Host Name/IP: The hostname or IP address of your SQL Server.
Port: The port number (default is typically 1433, but specify if different).
Username: The SQL or Domain user name.
Password: The corresponding password.
✔️ Click Next button to ensure the provided credentials and details can successfully connect to the database.
Step 2: Select Database and Tables/Views 📁
Once the connection is validated, the system will allow you to specify the exact data source within the server.
Select Database:
Select Tables/Views: You will be presented with a list of available tables and views within that database. Select the specific table or view containing the core data you intend to query (e.g., the Sales.Orders table or a specific reporting view).
Click Next to proceed.
Step 3: Define Dimensions and Metrics (Schema) 📊
In this crucial final step, you define how the columns from your selected table/view will be interpreted and used in Whatsdash reports.
Specify Fields: You are now prompted to specify which columns from your selected tables will be treated as Dimensions and which will be treated as Metrics.
Dimensions: Select columns that categorize or segment data (e.g., OrderDate, CustomerID, ProductCategory).
Metrics: Select columns that contain numerical values you want to measure, aggregate, or calculate (e.g., OrderTotal, LineItemQuantity).
Finalize Integration: After defining your core dimensions and metrics, the connection is finalized.
✔️ Once the process is complete, click Next. Your MySQL Integration will appear in the Connected Integrations list.
🔗 Explore More Integrations
Whatsdash supports a wide range of marketing, analytics, and eCommerce integrations to give you a holistic view of your business performance.
👉 Visit the Integrations Page to explore all available connections
Zoho Books
Zoho Books is cloud-based accounting software that helps businesses manage their finances, automate bookkeeping tasks, track expenses, manage inventory, and handle invoicing and payments.
Connecting Zoho Books to Whatsdash lets you quickly and easily review your key financial performance indicators (KPIs), such as revenue, expenses, and outstanding receivables, centralized alongside your marketing and sales data.
Why Connect Zoho Books to Whatsdash?
Integrating your Zoho Books data with Whatsdash allows you to connect your marketing and sales efforts directly to financial outcomes. This enables non-accounting users (like marketers or sales reps) to see the actual financial impact of their work.
-
Real-Time Financial Health : Monitor top-line metrics like Total Revenue, Total Expenses, and Net Income in real-time without logging into the accounting system.
-
Cash Flow & Receivables : Track Total Outstanding Invoices and Average Days to Pay to manage cash flow and quickly identify collection issues.
-
Unified Business Reporting : See financial results alongside operational data (e.g., website traffic from GA4 or sales from Zoho CRM) for a holistic view of business performance.
📋 Steps to Integrate your Zoho Books account to Whatsdash
✔️ Navigate to the 'Integrations' page using the Navigation bar.
✔️ Select Zoho Books from the Available Integrations.

✔️ Click the + button to open the "Zoho" authorization window.
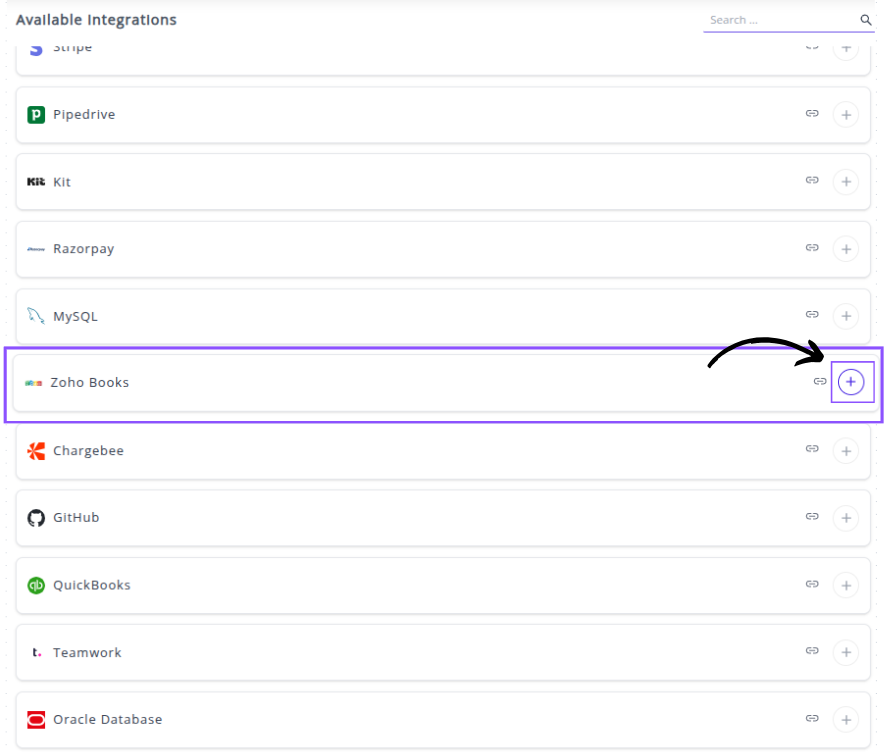
✔️ Select your Zoho Data Center : You will first be directed to a screen to choose your regional data center . This ensures Whatsdash connects to the correct Zoho server.

✔️ You will then be redirected to the Zoho Sign-in page. Log in with the Zoho account that has administrative access to your Zoho Books data.
✔️ Once authenticated, you will be directed back to Whatsdash. Your Zoho Books Integration will appear in the Connected Integrations list.
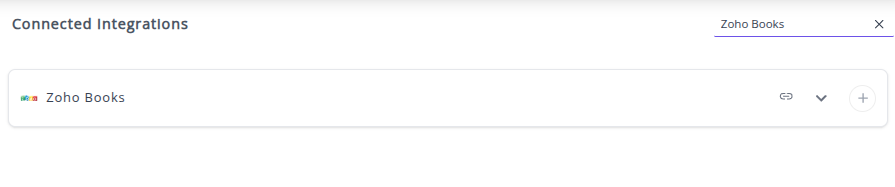
✔️ You can now create or customize dashboards using your Zoho Books Metrics and Dimensions.
👉 How to visualize this data in your dashboard, visit the Dashboard Documentation Guide
🔗 Zoho Books Metrics
The table below lists the Zoho Books Metrics available through the Whatsdash Zoho Books Integration.
| Name | Category | Why It’s Useful |
|---|---|---|
| Total Expenses | Expense | Helps track the total outgoing expenses to understand overall business spending. |
| Expenses Without Tax | Expense | Useful for analyzing pure operational costs excluding tax impact. |
| BCY Total | Expense | Enables consistent financial reporting across currencies by converting values to the base currency. |
| BCY Total Without Tax | Expense | Provides standardized expense analysis across currencies, excluding taxes for clearer insights. |
| Invoice Amount | Invoice | Represents the total payable amount, essential for revenue tracking and billing analysis. |
| Invoice Balance | Invoice | Helps monitor outstanding payments and manage accounts receivable effectively. |
| Adjustment | Invoice | Tracks manual modifications like rounding, discounts, or corrections applied to invoices. |
| Reminders Sent | Invoice | Useful for tracking how many payment reminders were issued, helping improve collection efficiency. |
| Shipping Charge | Invoice | Identifies shipping-related revenue or costs for accurate invoice and profitability assessment. |
| Write Off Amount | Invoice | Monitors uncollectible amounts written off, providing insight into payment reliability. |
| Exchange Rate | Invoice | Ensures accurate currency conversion and reporting for international transactions. |
🔗 Zoho Books Dimensions
The table below lists the Zoho Books Metrics available through the Whatsdash Zoho Books Integration.
| Name | Category | Why It’s Useful |
|---|---|---|
| Year | Time | Helps group and filter data by year for annual financial reports and trends. |
| Year Of Week | Time | Useful for identifying yearly trends while focusing on week-based periods. |
| Year Of Week(ISO) | Time | Provides ISO-standard week-year grouping for consistent international reporting. |
| Year Month | Time | Enables monthly financial summaries and time-based comparisons (e.g., month-over-month). |
| Month | Time | Useful for analyzing data within a specific month or comparing performance across months. |
| Year Week | Time | Allows weekly trend analysis across different years. |
| Year Week(ISO) | Time | Provides ISO-compliant weekly reporting, ensuring consistency in week numbering. |
| Week | Time | Helps identify weekly performance patterns and operational cycles. |
| Week(ISO) | Time | Useful for ISO-based week comparisons across datasets. |
| Day Of Month | Time | Enables daily tracking within months, ideal for short-term activity analysis. |
| Day Of Week Name | Time | Helps identify performance variations by weekdays (e.g., higher sales on weekends). |
| Day Of Week Name(ISO) | Time | Standardized weekday representation for global consistency in reports. |
| Date | Time | Essential for precise date-level tracking, filtering, and trend analysis. |
🔗 Explore More Integrations
Whatsdash supports a wide range of marketing, analytics, and eCommerce integrations to give you a holistic view of your business performance.
👉 Visit the Integrations Page to explore all available connections
Chargebee
Chargebee is a leading subscription billing and revenue management platform that automates recurring billing, invoicing, payments, and subscription management for SaaS and subscription-based businesses.
Why Connect Chargebee to Whatsdash?
Integrating your Chargebee data with Whatsdash allows you to consolidate your critical subscription and financial data alongside marketing, sales, and operational metrics. This integration transforms complex subscription metrics into clear, actionable dashboards for holistic business analysis.
-
Centralized Subscription Analytics: Track key SaaS metrics like Monthly Recurring Revenue (MRR), Churn Rate, and Customer Lifetime Value (LTV) without logging into a separate system.
-
Financial Clarity: Gain instant visibility into invoicing, payment collections, refunds, and overall revenue health.
-
Cross-Functional Reporting: Blend Chargebee data with marketing spend or user behavior to calculate Customer Acquisition Cost (CAC) and LTV/CAC ratios for a complete view of profitability.
📋 Steps to Integrate your Chargebee Account to Whatsdash
✔️ Navigate to the 'Integrations' page using the Navigation bar.
✔️ Select Chargebee from the Available Integrations.
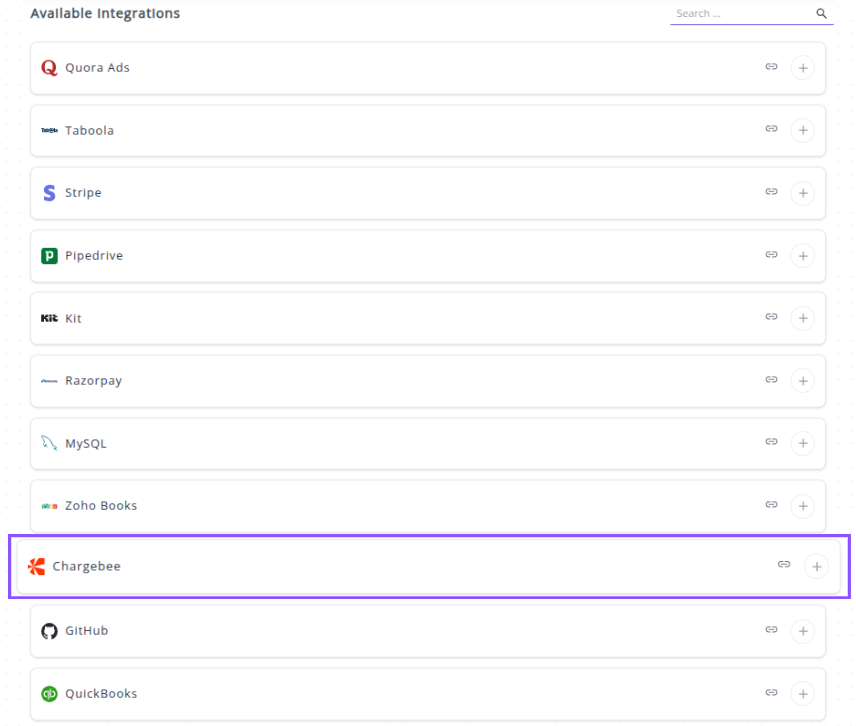
✔️ Click the + button. A connection window will appear prompting for the integration parameters.
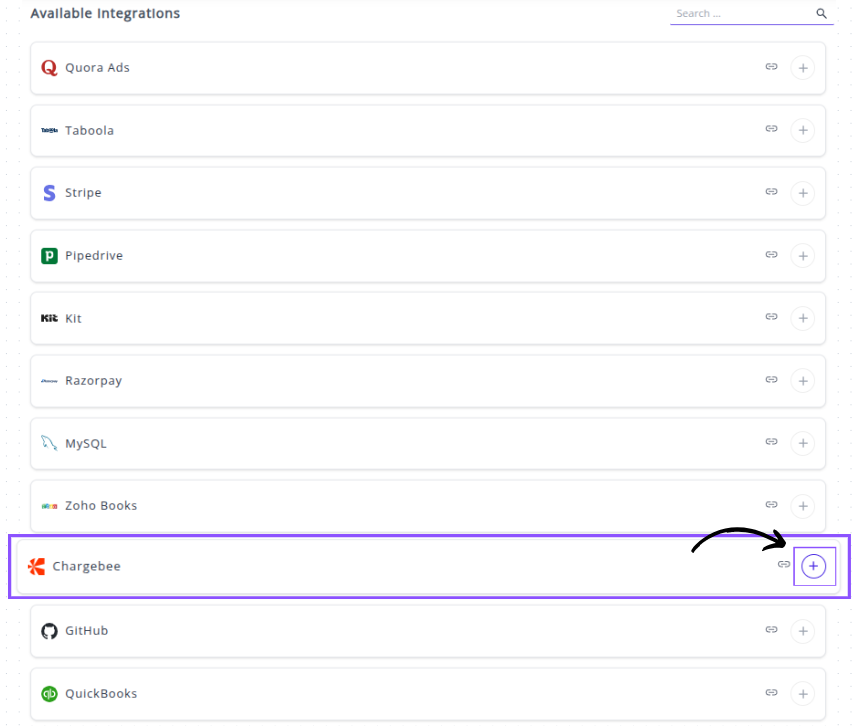
✔️ You will be prompted to enter your Chargebee Api key and Your-site.
How to find your Chargebee Site Name and API Key:
Site Name : Your Chargebee site name is the subdomain of your Chargebee admin URL (e.g., if your URL is https://whatsdash-test.chargebee.com, your Site Name is whatsdash-test).
API Key (Api key):
- Log in to your Chargebee account.
- Navigate to Settings → Configure Chargebee → API Keys and Webhooks → API keys.
- To create a new one, click on Create Key.
- You can then configure the type of API key (e.g., Full-Access, Read-Only) based on your needs and click Create Key to generate it.
✔️ Enter the Api key and the Site Name into the respective fields in the Whatsdash integration window.

✔️ Click Next button. Your Chargebee Integration will now appear in the Connected Integrations list.
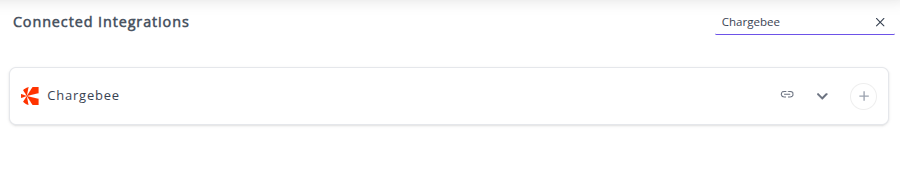
✔️ You can now create or customize dashboards using your Chargebee Metrics and Dimensions.
👉 To visualize this data in your dashboard, visit the Dashboard Documentation Guide.
🔗 Chargebee Metrics
The table below lists the Chargebee Metrics available through the Whatsdash Chargebee Integration.
| Name | Category | Why it’s useful |
|---|---|---|
| Exchange Rate | transaction | Converts foreign currency to base currency for accurate financial reporting. |
| Transaction Amount | transaction | Tracks the monetary value of transactions, useful for revenue and accounting analysis. |
| Amount Unused | transaction | Identifies unused credits or overpayments, useful for applying to future invoices. |
| Invoice Total | invoice | Represents total invoice amount including taxes, discounts, and adjustments, helpful for billing accuracy. |
| Invoice Amount Paid | invoice | Tracks amount successfully paid, crucial for cash flow and receivable management. |
| Invoice Exchange Rate | invoice | Converts invoice amounts from foreign currency to base currency, ensuring accurate reporting. |
| Invoice Amount Adjusted | invoice | Captures credits, write-offs, and manual adjustments, important for accurate financial statements. |
| Invoice Write Off Amount | invoice | Shows amounts written off, useful for understanding uncollectible revenue. |
| Invoice Credits Applied | invoice | Displays applied credits, helping track utilization of customer balances. |
| Invoice Amount Due | invoice | Shows remaining payable amount, critical for collections and revenue tracking. |
| Invoice Amount To Collect | invoice | Estimates total expected collection, useful for cash flow planning. |
| Invoice Round Off Amount | invoice | Adjusts for currency or tax precision differences, ensuring accurate invoice totals. |
| Invoice New Sales Amount | invoice | Separates new sales from renewals or add-ons, useful for growth analysis. |
| Invoice Tax | invoice | Tracks total tax applied, important for compliance and reporting. |
| Invoice Line Items Amount | invoice | Aggregates all line items, helping analyze total charges before adjustments. |
| Invoice Line Items Level Discount Amount | invoice | Tracks discounts applied at line item level, useful for promotion analysis. |
| Invoice Line Items Level Unit Amount | invoice | Captures unit price of each line item, useful for pricing and revenue analytics. |
| Invoice Line Items Quantity | invoice | Tracks quantity of items billed, helpful for inventory and subscription usage reports. |
🔗 Chargebee Dimensions
The table below lists the Chargebee Dimensions available through the Whatsdash Chargebee Integration.
| Name | Category | Why it’s useful |
|---|---|---|
| Transition ID | transaction | Tracks unique state changes in subscriptions or invoices, useful for auditing and lifecycle monitoring. |
| Subscription ID | transaction | Identifies each subscription for managing recurring billing and customer subscriptions. |
| Transition Date | transaction | Helps analyze when subscription or invoice changes occurred, useful for reporting timelines. |
| Transition Status | transaction | Monitors whether a subscription or invoice change succeeded or failed, key for troubleshooting. |
| Transition Updated At | transaction | Tracks the most recent updates to transitions for data accuracy. |
| Transition Currency Code | transaction | Identifies the currency for transactions, necessary for financial reconciliation. |
| Transition Invoice ID | transaction | Links subscription changes to specific invoices, useful for invoice tracking. |
| Transition Invoice Status | transaction | Shows current invoice billing state, aiding in cash flow and receivables management. |
| Invoice Status | invoice | Monitors payment status of invoices, important for financial reporting. |
| Invoice Price Type | invoice | Indicates tax treatment on invoices, useful for accounting and compliance. |
| Invoice Paid At | invoice | Tracks exact payment time, useful for revenue recognition. |
| Invoice Line Items ID | invoice | References billed products or services, helpful for line-item reporting. |
| Invoice Line Items Date From | invoice | Marks start of billing period for items, useful for subscription period tracking. |
| Invoice Line Items Pricing Model | invoice | Shows how charges are calculated for each line item, aiding pricing analysis. |
| Invoice Line Items Subscription ID | invoice | Links line items to subscriptions for detailed revenue tracking. |
| Invoice Line Items Description | invoice | Provides item-level billing details, useful for audits and customer queries. |
| Invoice Line Items Entity Type | invoice | Classifies item type (plan, addon, charge), aiding reporting by entity. |
| Invoice Line Items Entity ID | invoice | Tracks unique entity IDs, helpful for precise product or service analysis. |
| Invoice Line Items Tax Exempt Reason | invoice | Captures tax exemption reasons, important for compliance reporting. |
| Year | Time | Aggregates data annually, useful for yearly trend analysis. |
| Year Of Week | Time | Groups data by year-week, helpful for weekly performance tracking. |
| Year Of Week(ISO) | Time | ISO standard week grouping, ensures consistency across reporting systems. |
| Year Month | Time | Aggregates data monthly, useful for month-on-month analysis. |
| Month | Time | Tracks monthly patterns or seasonality in data. |
| Year Week | Time | Helps analyze weekly trends within a year. |
| Year Week(ISO) | Time | Standardized weekly reporting using ISO format. |
| Week | Time | Tracks week number, useful for operational reporting. |
| Week(ISO) | Time | ISO week reporting for consistency across systems. |
| Day Of Month | Time | Tracks specific day of month, useful for billing or revenue analysis. |
| Day Of Week Name | Time | Analyzes day-of-week trends, helpful for scheduling or sales insights. |
| Day Of Week Name(ISO) | Time | ISO standard day-of-week reporting for accurate comparisons. |
| Date | Time | Exact date tracking for precise reporting and audits. |
🔗 Explore More Integrations
Whatsdash supports a wide range of marketing, analytics, and eCommerce integrations to give you a holistic view of your business performance.
👉 Visit the Integrations Page to explore all available connections
GitHub
GitHub is the world's leading platform for software development, providing version control using Git and collaboration tools for millions of developers and teams.
Why Connect GitHub to Whatsdash?
Integrating your GitHub data with Whatsdash transforms raw development activity into clear, quantifiable insights, making it easy to track and report on engineering performance alongside business KPIs.
-
Track Development Velocity: Monitor core metrics like Cycle Time, Commit Frequency, and Pull Request (PR) throughput to identify bottlenecks and measure the efficiency of your engineering workflow.
-
Align Tech with Business: Blend development data (e.g., Issues Closed) with product, sales, and marketing metrics to clearly demonstrate the impact of the engineering team on overall business goals.
-
Simplify Reporting for Stakeholders: Present complex development statistics in accessible, visual dashboards that non-technical stakeholders can easily understand.
📋 Steps to Integrate your GitHub Account to Whatsdash
✔️ Navigate to the 'Integrations' page using the Navigation bar.
✔️ Select Github from the Available Integrations.
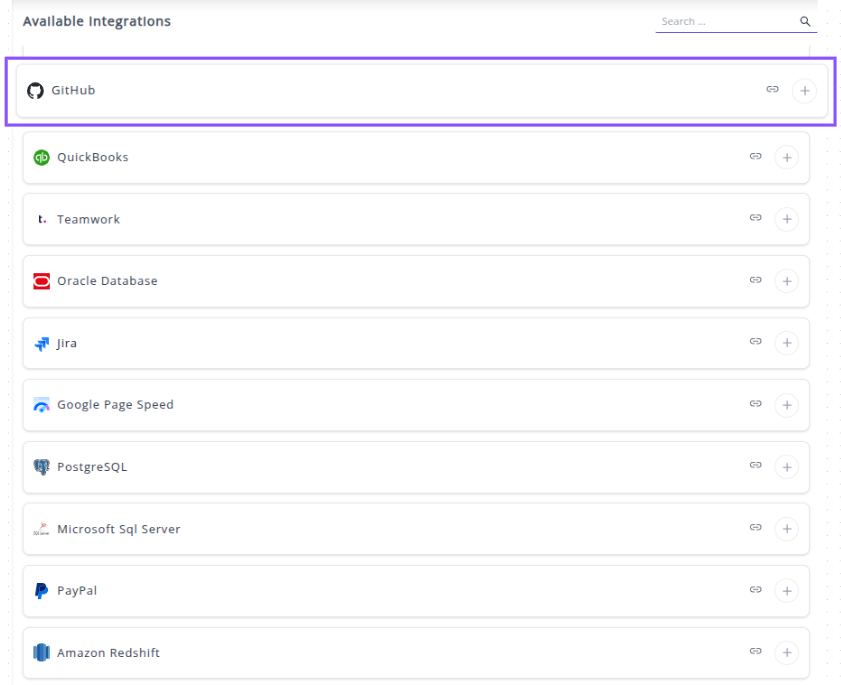
✔️ Click the + button.

✔️ You will be redirected to a GitHub sign-in page to authorize the connection.
✔️ Sign in to your GitHub account using your Username/Email and Password, or choose to "Continue with Google," "Continue with Apple," or "Sign in with a passkey."

✔️ Once signed in, GitHub will prompt you to Grant Whatsdash Access to your data. Review the requested read-only permissions and click Authorize Whatsdash (or a similar confirmation button).
✔️ Once authenticated and authorized, you will be redirected back to Whatsdash. Your GitHub Integration will now appear in the Connected Integrations list.
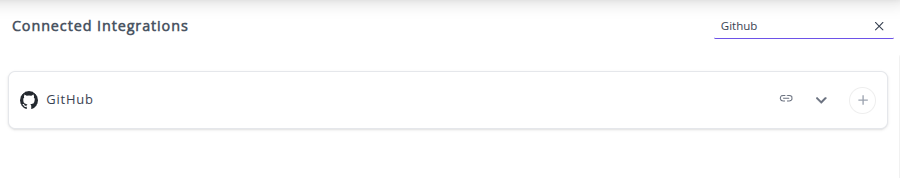
✔️ You can now create or customize dashboards using your GitHub Metrics and Dimensions.
👉 To visualize this data in your dashboard, visit the Dashboard Documentation Guide.
🔗 GitHub Metrics
The table below lists the Github Metrics available through the Whatsdash Github Integration.
| Name | Category | Why it’s useful |
|---|---|---|
| Issue Count | Issue | Tracks the total number of issues, useful for monitoring project workload. |
| Forks Count | Repo | Shows how many times the repository has been forked, indicating popularity and collaboration. |
| Watchers | Repo | Number of users watching the repo, useful for gauging interest in the project. |
| Branch Count | Branch | Total branches in the repository, helps track development activity and branch management. |
| Issue Comment Count | Issue | Number of comments on issues, useful for measuring team interaction and discussion. |
| Commit Comments Count | Commit | Tracks comments on commits, useful for reviewing code discussions. |
| Time since last Commit | Commit | Shows time elapsed since the last commit, helpful for monitoring activity and repo health. |
| Pull Requests Count | PR | Total pull requests, indicates development progress and contributions. |
| Pull Request Draft Count | PR | Tracks draft PRs, helping to identify work-in-progress contributions. |
| Collaborators | Collaborators | Number of collaborators, useful for understanding team size and engagement. |
| Issue Resolution Time | Issue | Measures time taken to close issues, important for project efficiency analysis. |
| Commit Count | Commit | Total commits, helps track codebase changes and developer activity. |
| Stars | Repo | Number of stars, a key metric for popularity and community interest. |
| Contributions | Contributor | Total contributions by a contributor, useful for performance tracking. |
| Sub Issues Count | Issue | Tracks sub-issues under main issues, helps manage complex tasks. |
| Issue Reactions | Issue | Number of reactions on issues, useful to gauge engagement and community feedback. |
| Verified Commit Count | Commit | Number of verified commits, important for security and authenticity verification. |
| Protected Branches | Branch | Number of protected branches, ensures critical branches are safeguarded. |
🔗 GitHub Dimensions
The table below lists the Github Dimensions available through the Whatsdash Github Integration.
| Name | Category | Why it’s useful |
|---|---|---|
| Contributor Name | Contributor | Identifies all contributors to a repository, useful for tracking contributions and collaboration. |
| Issue Title | Issue | Provides the title of issues for monitoring and managing project tasks. |
| Issue Created By | Issue | Shows who created an issue, helping track accountability and reporting. |
| Issue Closed By | Issue | Identifies who closed an issue, useful for workflow and performance analysis. |
| Issue Assignee Name | Issue | Shows who is responsible for an issue, helping with task assignment tracking. |
| Issue Creation Time | Issue | Timestamp for when the issue was created, useful for timeline analysis. |
| Issue State | Issue | Indicates the status of an issue (open/closed), key for workflow tracking. |
| Pull Request Name | PR | Provides the title of pull requests for tracking feature development or bug fixes. |
| Pull Request Created By | PR | Identifies who created a PR, useful for contributor performance and accountability. |
| Pull Request Creation Time | PR | Timestamp for PR creation, useful for project timeline analysis. |
| Pull Request Closing Time | PR | Time when the PR was closed, useful to track resolution speed. |
| Pull Request Merged At | PR | Shows merge time, important for release tracking and workflow analysis. |
| Pull Request Assignee | PR | Shows the assignee of a PR, helpful for responsibility tracking. |
| Pull Request Head Branch | PR | Identifies the source branch of the PR, useful for branch management. |
| Pull Request Base Branch | PR | Identifies the target branch for the PR, helping in release planning. |
| Committer Name | Commit | Tracks who committed changes, useful for accountability and contribution analysis. |
| Author Name | Commit | Shows the author of commits, important for tracking code contributions. |
| Committed Time | Commit | Timestamp of the commit, used for time-series analysis of development activity. |
| Commit Message | Commit | Contains commit notes, helpful for understanding changes and version history. |
| Branch Name | Branch | Lists repository branches, essential for branch management and workflow overview. |
| Year | Time | Helps group and analyze GitHub data by calendar year for trend analysis. |
| Year Of Week | Time | Useful for weekly trend analysis within a year. |
| Year Of Week(ISO) | Time | Provides ISO-standard weekly grouping for consistent reporting. |
| Year Month | Time | Aggregates data by year and month for monthly reporting. |
| Month | Time | Allows month-level analysis and seasonal pattern detection. |
| Year Week | Time | Tracks data weekly with year context for time-series insights. |
| Year Week(ISO) | Time | ISO-compliant weekly aggregation for standardized weekly reporting. |
| Week | Time | Enables week-level analysis across years for activity tracking. |
| Week(ISO) | Time | ISO-standard week grouping, helpful for cross-region consistency. |
| Day Of Month | Time | Analyzes activity or metrics by day within a month. |
| Day Of Week Name | Time | Identifies trends by weekdays, useful for workload or activity patterns. |
| Day Of Week Name(ISO) | Time | ISO-compliant weekday grouping, ensures consistency in reporting. |
| Date | Time | Provides precise daily granularity for detailed time-series analysis. |
🔗 Explore More Integrations
Whatsdash supports a wide range of marketing, analytics, and eCommerce integrations to give you a holistic view of your business performance.
👉 Visit the Integrations Page to explore all available connections
QuickBooks
QuickBooks is the industry-leading accounting software that Whatsdash integrates with to centralize your critical financial data—like sales, revenue, expenses, and cash flow—for robust, cross-functional business intelligence and reporting.
Why Connect QuickBooks Online to Whatsdash?
Integrating your QuickBooks Online data with Whatsdash transforms raw financial records into automated, visual, and easy-to-understand dashboards that are accessible to your entire team, not just the finance department.
-
Real-Time Financial Health: Get a current, holistic view of your key financial indicators—like Profit & Loss and Cash Flow—without having to manually run and export reports from QuickBooks.
-
Custom Financial KPIs: Go beyond standard P&L reports. Use Whatsdash's powerful customization features to track Custom Metrics and unique financial KPIs relevant to your specific business model.
-
Data Blending & Context: Combine financial metrics (from QuickBooks) with operational data (from your CRM, marketing, and sales tools) to understand the true ROI and cost-effectiveness of every part of your business.
📋 Steps to Integrate your QuickBooks Online account to Whatsdash
✔️ Navigate to the 'Integrations' page using the Navigation bar.
✔️ Select QuickBooks from the Available Integrations.
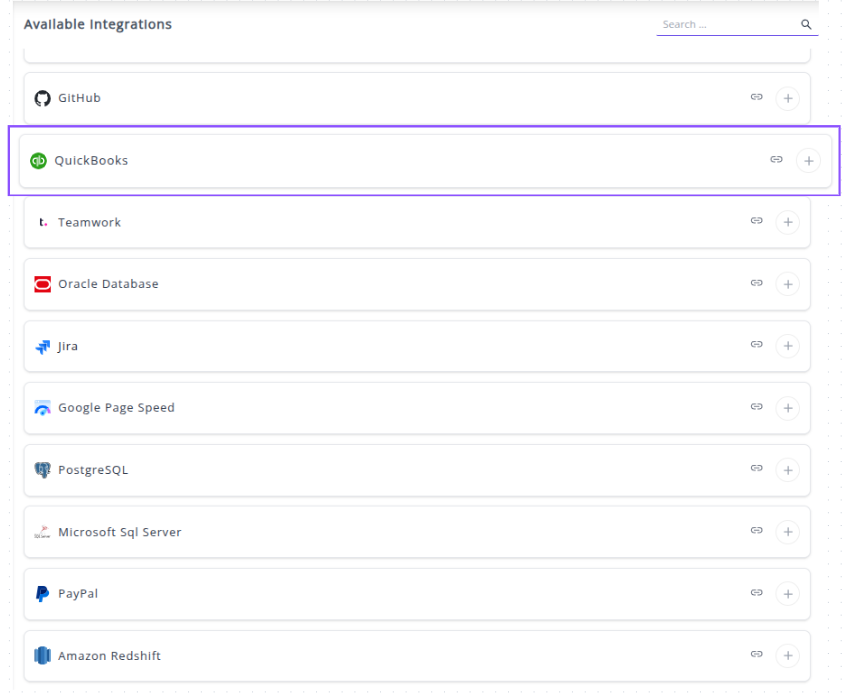
✔️ Click the + button.

✔️ You will be redirected to the Intuit(QuickBooks) sign-in page.

✔️ Sign in with the Intuit account credentials that have access to the QuickBooks Online company you want to report on.
✔️ Authorize the connection. You will be prompted to grant Whatsdash the necessary permissions to read your accounting data (e.g., invoices, customers, transactions). Review the permissions and click Connect or Authorize.
✔️ Once authenticated and authorized, you will be directed back to Whatsdash. Your QuickBooks Online Integration will appear in the Connected Integrations list.

✔️ You can now create or customize dashboards using your QuickBooks Metrics and Dimensions.
👉 For guidance on visualizing this data in your dashboard, visit the Dashboard Documentation Guide.
🔗 Quickbooks Metrics
The table below lists the Quickbooks Metrics available through the Whatsdash Quickbooks Integration.
| Name | Category | Why it’s useful |
|---|---|---|
| Open Invoices Amount | Invoices | Shows the total value of outstanding invoices not yet paid by customers. |
| Open Invoices | Invoices | Tracks unpaid customer invoices to monitor accounts receivable and cash flow. |
| Overdue Invoices Amount | Invoices | Displays the total amount of invoices past their due date, indicating delayed payments. |
| Overdue Invoices | Invoices | Helps identify overdue customer payments to take follow-up actions. |
| Paid Invoices Amount | Invoices | Measures total money received from paid invoices, showing actual revenue. |
| Total Expenses (Cash) | Bills | Tracks total cash expenses paid during a specific period for expense control. |
| Total Expenses (Accrual) | Bills | Captures total recorded expenses, including unpaid bills, for profitability analysis. |
| Unpaid Expenses (Bills) Amount | Bills | Shows total unpaid bills, helping manage liabilities and upcoming payments. |
| Unpaid Expenses (Bills) | Bills | Tracks vendor bills pending payment to manage cash flow efficiently. |
| Cost of Goods Sold (Cash) | Profit & Loss | Reflects direct cash costs for producing goods or services sold. |
| Cost of Goods Sold (Accrual) | Profit & Loss | Tracks all incurred production costs whether paid or not, showing true profitability. |
| Other Expenses (Cash) | Bills | Captures miscellaneous cash-based expenses not categorized elsewhere. |
| Other Expenses (Accrual) | Bills | Tracks accrued non-operating expenses like interest or taxes. |
| Other Income (Cash) | Profit & Loss | Measures non-core income sources such as rent or asset sales (cash basis). |
| Other Income (Accrual) | Profit & Loss | Tracks non-operating income recognized before payment is received. |
| Income (Cash) | Profit & Loss | Shows actual cash received from sales and other sources. |
| Income (Accrual) | Profit & Loss | Tracks total revenue earned, even if not yet collected. |
| Balance (Cash) | Balance Sheet | Displays current cash-based financial standing (assets vs liabilities). |
| Balance (Accrual) | Balance Sheet | Represents full financial position including accrued items. |
| Net Cash Increase | Balance Sheet | Shows change in available cash after inflows and outflows. |
| COGS (Cash) | Profit & Loss | Helps calculate cash-based profitability per product or service. |
| Expenses (Cash) | Profit & Loss | Tracks all cash-based spending to monitor operational efficiency. |
| Current Assets (Cash) | Balance Sheet | Reflects short-term assets that can quickly be converted to cash. |
| EBIT Growth (Accrual) | Profit & Loss | Measures change in earnings before interest and taxes under accrual basis. |
| EBIT (Accrual) | Profit & Loss | Shows operating profitability before interest and taxes (accrual). |
| Current Assets (Accrual) | Balance Sheet | Tracks short-term assets recorded under accrual accounting. |
| Net Other Income (Cash) | Profit & Loss | Shows total non-operating income after related expenses (cash basis). |
| Assets (Accrual) | Balance Sheet | Lists total owned resources used to generate income. |
| Gross Profit Growth (Cash) | Profit & Loss | Indicates improvement or decline in gross profit on cash basis. |
| Money Received | Profit & Loss | Measures total payments received from customers during a period. |
| Net Other Income (Accrual) | Profit & Loss | Tracks profit or loss from non-core activities under accrual accounting. |
| Net Income (Accrual) | Profit & Loss | Measures total profitability after all expenses on an accrual basis. |
| Paid Bills | Bills | Tracks total paid bills to monitor expenses and cash management. |
| EBIT Growth (Cash) | Profit & Loss | Shows change in EBIT (cash basis) across reporting periods. |
| Net Operating Income (Cash) | Profit & Loss | Shows operational profit after expenses and taxes but before interest. |
| Expenses (Accrual) | Profit & Loss | Captures total incurred expenses regardless of payment timing. |
| Current Liabilities (Cash) | Balance Sheet | Shows short-term financial obligations due within a year such as loans or payables. |
| Current Liabilities (Accrual) | Balance Sheet | Reflects short-term debts recorded under accrual accounting for financial accuracy. |
| Liabilities (Accrual) | Balance Sheet | Displays all obligations including long-term debts for a complete financial view. |
| Gross Profit Margin (Accrual) | Profit & Loss | Measures profitability percentage after deducting COGS from revenue under accrual basis. |
| Assets (Cash) | Balance Sheet | Tracks total resources owned by the business used for generating revenue. |
| Paid Invoices | Invoices | Indicates total revenue collected from paid customer invoices. |
| Net Income (Cash) | Profit & Loss | Shows total profit after cash expenses are deducted from revenue. |
| Net Operating Income (Accrual) | Profit & Loss | Reflects profitability from core operations on an accrual basis. |
| Gross Profit Margin (Cash) | Profit & Loss | Shows how efficiently a company turns cash sales into profit after direct costs. |
| Overdue Invoices by Due Date | Invoices | Helps track unpaid invoices that have crossed their due date for follow-up. |
| Gross Profit (Cash) | Profit & Loss | Reveals cash-based profit before deducting indirect costs and taxes. |
| Liabilities (Cash) | Balance Sheet | Lists total current and long-term obligations paid or due in cash. |
| Revenue Growth (Accrual) | Profit & Loss | Shows change in recorded revenue across periods under accrual accounting. |
| Paid Bills Amount | Bills | Tracks total expenses paid to vendors to manage cash outflow. |
| EBIT (Cash) | Profit & Loss | Measures earnings before interest and taxes based only on cash transactions. |
| Gross Profit (Accrual) | Profit & Loss | Calculates profit after COGS including all accrued revenue and expenses. |
🔗 Quickbooks Dimensions
The table below lists the Quickbooks Dimensions available through the Whatsdash Quickbooks Integration.
| Name | Category | Why it’s useful |
|---|---|---|
| Overdue Invoices Due Date | Invoices | Displays overdue invoices categorized by their due dates for better payment tracking. |
| Vendor ID | Bills | Identifies each vendor uniquely for reference in bills and payments. |
| Vendor City | Bills | Provides the city location of each vendor to help with regional expense analysis. |
| Vendor Country | Bills | Indicates the vendor’s country for global financial reporting. |
| Created Date | Bills | Tracks when each bill was created to monitor billing cycles. |
| Update Time | Bills | Records the latest modification time of a bill for version control and auditing. |
| Year | Time | Displays the year component (YYYY) for time-based financial analysis. |
| Year Of Week | Time | Shows the year corresponding to each week number for weekly reports. |
| Year Of Week(ISO) | Time | Displays ISO-compliant year and week combinations for standardized weekly reporting. |
| Year Month | Time | Combines year and month (e.g., 202501) for monthly trends and summaries. |
| Month | Time | Represents the month (01–12) to group data by month. |
| Year Week | Time | Displays year and week (e.g., 202545) to identify weekly performance. |
| Year Week(ISO) | Time | Provides ISO week numbering for consistent weekly reporting. |
| Week | Time | Indicates the week number (01–53) for time-series analysis. |
| Week(ISO) | Time | Uses ISO week format to standardize week-based data tracking. |
| Day Of Month | Time | Displays the specific day within a month (01–31) for granular daily data. |
| Day Of Week Name | Time | Shows the day name (e.g., Monday) to identify weekday-based performance. |
| Day Of Week Name(ISO) | Time | Lists ISO-compliant day names for standardized weekday grouping. |
| Date | Time | Represents complete date format (YYYYMMDD) for precise record-keeping. |
🔗 Explore More Integrations
Whatsdash supports a wide range of marketing, analytics, and eCommerce integrations to give you a holistic view of your business performance.
👉 Visit the Integrations Page to explore all available connections
Teamwork
Teamwork is a comprehensive project management platform that allows teams to manage client work, projects, and resources efficiently.
Why Connect Teamwork to Whatsdash?
Integrating your Teamwork data with Whatsdash transforms raw project data into clear, actionable business intelligence for project managers, team leads, and executives.
-
Project Health at a Glance: Monitor key metrics like task completion, milestone status, and overdue items across all projects in a single, high-level dashboard.
-
Resource & Capacity Planning: Blend time-tracking and task data with financial metrics to get a clear view of team utilization, billable hours, and project profitability.
-
Custom Project Reporting: Go beyond Teamwork’s standard reports by creating custom metrics and visualizations that combine project status, budget, and client data from other systems.
📋 Steps to Integrate your Teamwork account to Whatsdash
✔️ Navigate to the 'Integrations' page using the Navigation bar.
✔️ Select Teamwork from the Available Integrations.
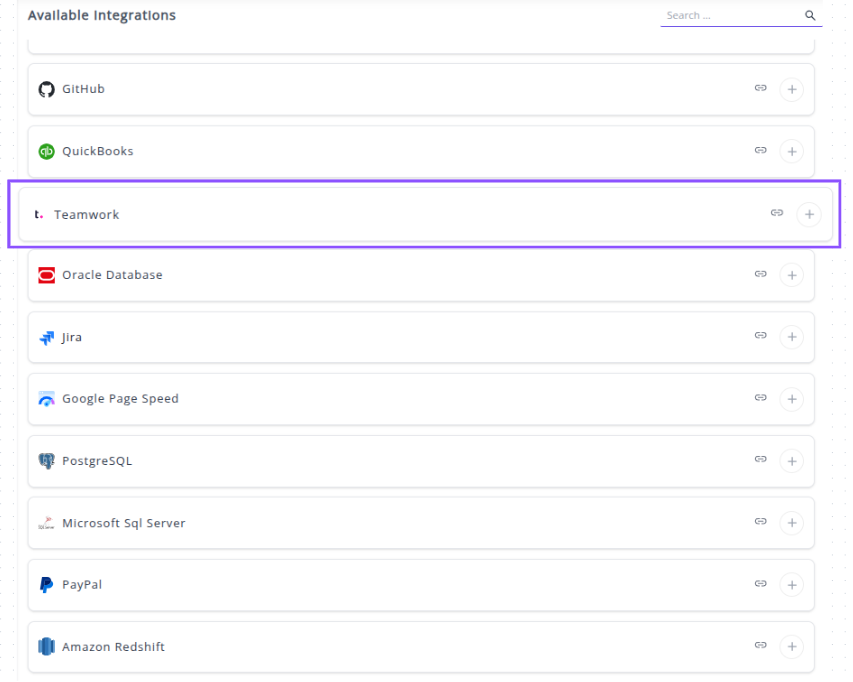
✔️ Click the + button to open the connection window.

✔️ Teamwork Login / Authorization: You will be redirected to the official Teamwork login page (or an authorization screen).
- Login: Enter the credentials for the Teamwork account that has access to the data you wish to report on.
- Authorize: Review the permissions requested by Whatsdash and click Authorize or Allow to grant access to your data.
✔️ Once authenticated, your Teamwork Integration will appear in the Connected Integrations list.
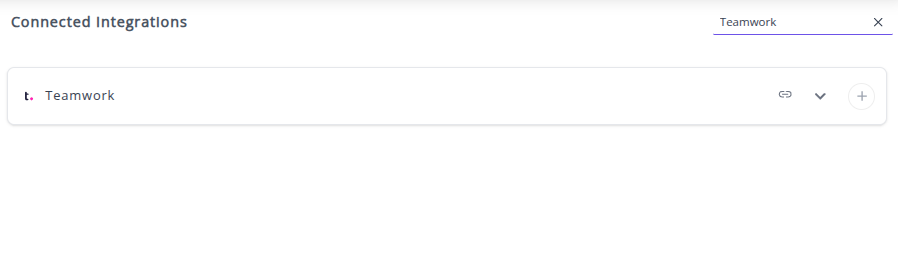
✔️ You can now create or customize dashboards using your Teamwork Metrics and Dimensions.
👉 How to visualize this data in your dashboard, visit the Dashboard Documentation Guide.
🔗 Teamwork Metrics
The table below lists the Teamwork Metrics available through the Whatsdash Teamwork Integration.
| Name | Category | Why it’s useful |
|---|---|---|
| Projects Count | Project | Shows the total number of projects, useful for tracking workload and project growth. |
| Integrations Count | Project | Displays how many integrations exist per project to monitor connectivity and automation usage. |
| Task Count | Task | Indicates the total number of tasks, helping assess project size and team workload. |
| Comments Count | Task | Tracks how many comments are made on each task to measure collaboration and communication levels. |
| Estimated Minutes | Task | Represents the estimated time required to complete a task for better time management and planning. |
| Progress of Tasks | Task | Shows the completion progress of tasks, helping visualize overall project advancement. |
| Billable Minutes Logged | Task | Displays the total billable minutes logged to monitor revenue-generating activities. |
| Total Minutes Logged | Task | Tracks the total logged minutes for productivity and time tracking analysis. |
🔗 Teamwork Dimensions
The table below lists the Teamwork Dimensions available through the Whatsdash Teamwork Integration.
| Name | Category | Why it’s useful |
|---|---|---|
| Project Name | Project | Displays the name of each project to identify workspaces clearly. |
| Billable Projects | Project | Helps differentiate projects that generate billable hours or revenue. |
| Project Status | Project | Tracks the current state of projects (active, completed, paused). |
| Project Created By | Project | Shows the creator of a project for accountability and team organization. |
| Client Name of Project | Project | Identifies the client associated with each project for client-based tracking. |
| Project Owner | Project | Indicates the owner responsible for the project’s progress and delivery. |
| Project Created Date | Project | Captures the date a project was created for timeline tracking. |
| Project Completed Date | Project | Records when a project was completed for performance and delivery metrics. |
| Project Completed By | Project | Displays the team member who marked the project as completed. |
| Project Start Date | Project | Marks the beginning of the project timeline for scheduling and progress analysis. |
| Project End Date | Project | Indicates when the project is expected or set to end. |
| Task Name | Task | Identifies the specific name of a task within a project. |
| Project Name of Task | Task | Shows which project a given task belongs to. |
| Task Status | Task | Displays whether a task is pending, in progress, or completed. |
| Client Name of Task | Task | Links tasks to their corresponding client for billing or project reporting. |
| Task Created By | Task | Tracks who created the task for accountability. |
| Task Start Date | Task | Marks when a task was started for time tracking. |
| Task Due Date | Task | Displays the task’s due date to help manage deadlines. |
| Assignee Name of Task | Task | Lists the person assigned to complete the task. |
| Task Created Date | Task | Captures the date the task was created for scheduling purposes. |
| Priority | Task | Indicates the importance or urgency level of a task. |
| TaskList Name | Task | Groups related tasks under a common task list for better organization. |
| Task Completed By | Task | Shows who completed a specific task for accountability. |
| Year | Time | Displays the year (YYYY) for time-based reports. |
| Year Of Week | Time | Represents the year corresponding to a week number for weekly analysis. |
| Year Of Week(ISO) | Time | Provides ISO-standard year-week format for consistent weekly tracking. |
| Year Month | Time | Combines year and month (e.g., 202501) for monthly reports. |
| Month | Time | Displays the month (01–12) for monthly breakdowns. |
| Year Week | Time | Combines year and week number to support weekly trend tracking. |
| Year Week(ISO) | Time | ISO-compliant year-week format for standardized weekly data. |
| Week | Time | Shows the week number (01–53) for weekly summaries. |
| Week(ISO) | Time | Displays ISO-standard week numbering. |
| Day Of Month | Time | Displays day number (01–31) for daily-level insights. |
| Day Of Week Name | Time | Shows the weekday name (e.g., Monday) for daily pattern analysis. |
| Day Of Week Name(ISO) | Time | Displays weekday names in ISO-standard order. |
| Date | Time | Shows full date (YYYYMMDD) for detailed record-keeping. |
🔗 Explore More Integrations
Whatsdash supports a wide range of marketing, analytics, and eCommerce integrations to give you a holistic view of your business performance.
👉 Visit the Integrations Page to explore all available connections
Oracle Database
Oracle Database is a powerful, relational database management system (RDBMS) widely used for large-scale enterprise data warehousing, transaction processing, and online analytical processing (OLAP).
Connecting your Oracle Database to Whatsdash allows you to pull critical business metrics from your core data systems (like ERP, CRM, or custom applications) directly into your centralized dashboards.
Why Connect Oracle Database to Whatsdash?
Integrating your Oracle data transforms complex SQL data into simple, visual dashboards for all business users.
-
Real-Time Enterprise Reporting: Create dashboards that reflect the live state of your business by querying core transactional and financial data directly from your Oracle instance.
-
Unified Data View: Centralize key operational data—such as inventory levels, sales orders, and financial summaries—alongside marketing and website performance metrics from other platforms in one place.
-
Custom SQL Metrics: Leverage the power of Oracle SQL by writing custom queries within Whatsdash to define and track specific metrics unique to your business logic and data schema.
📋 Steps to Integrate your Oracle Database to Whatsdash
Integrating a relational database typically requires standard connection parameters. Whatsdash uses a secure, read-only connection method (like JDBC or ODBC) to access your specified tables and schemas.
Step 1: Configure Connection Credentials 🔐
✔️ Navigate to the 'Integrations' page using the Navigation bar.
✔️ Select MySQL from the Available Integrations.
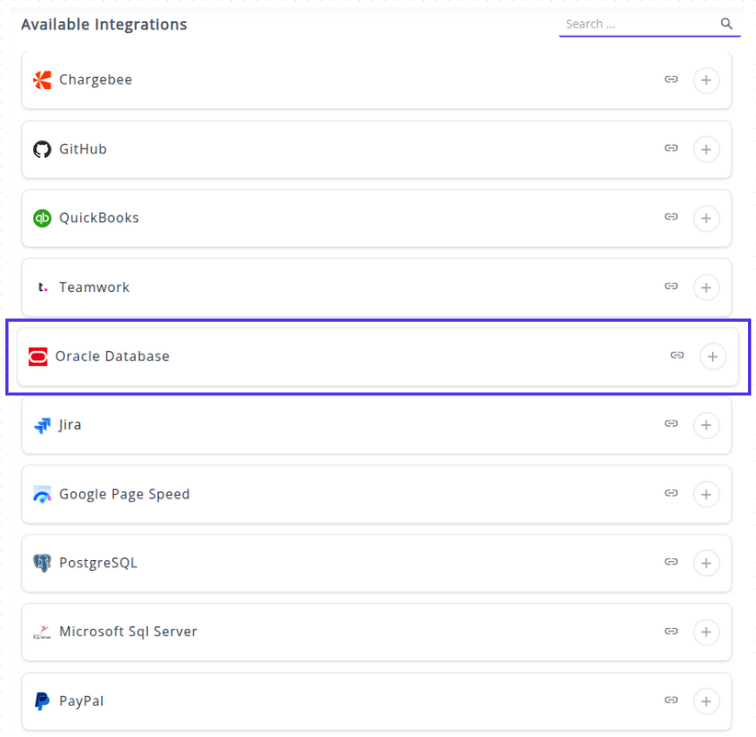
✔️ Click the + button to open the connection configuration window.

✔️ Here are the steps performed to establish the ORacle Database connection in Whatsdash
Step 1: Enter Oracle Connection Parameters 🔐
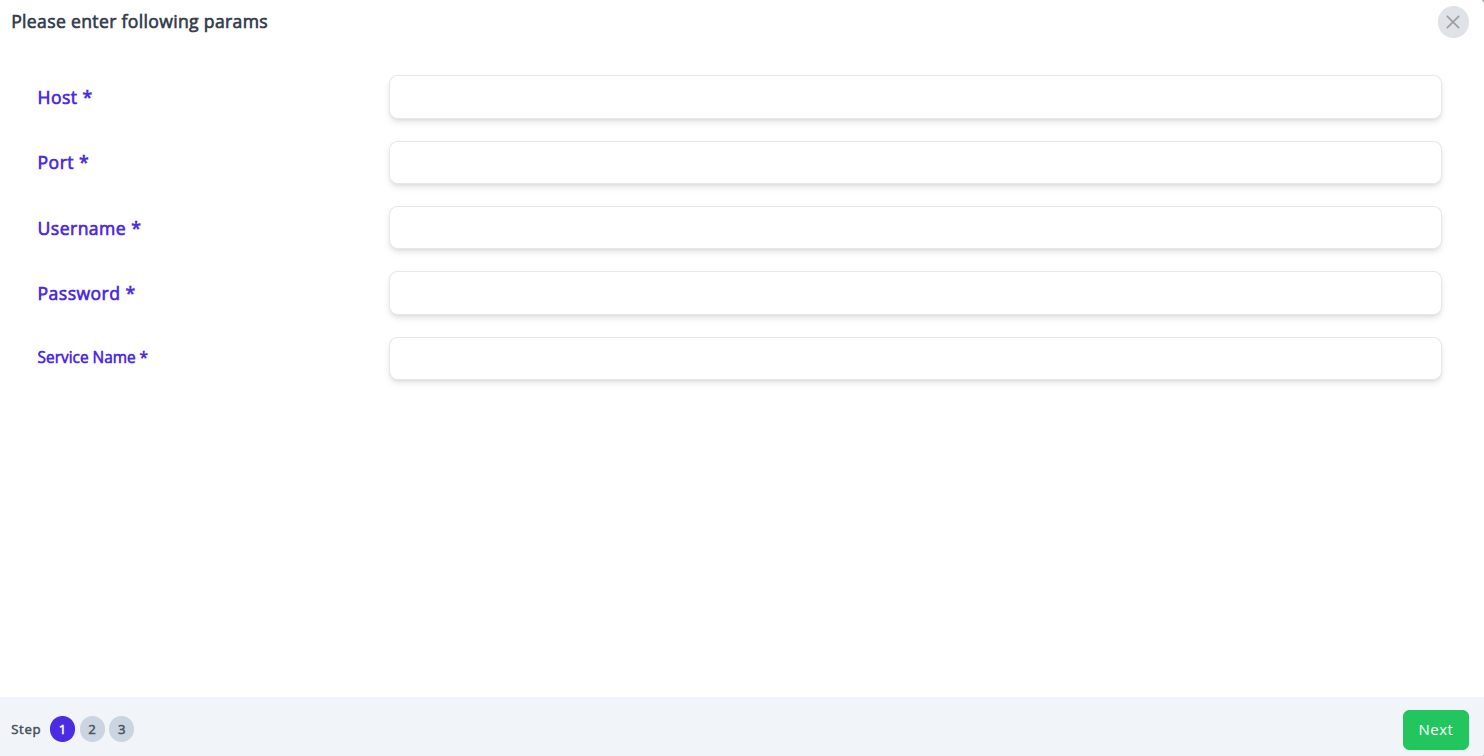
In this first step, you provide the necessary network and authentication details for Whatsdash to locate and log in to your Oracle database instance.
You must fill in the following five mandatory fields marked with an asterisk (*):
Host: Enter the hostname or IP address of your Oracle database server (e.g., oracle-prod-server.corp or 10.0.0.50).
Port: Enter the port number your Oracle database listener is using. The standard default port for Oracle is typically 1521.
Username: Enter the username for the Oracle account that has permissions to read the data you need.
Password: Enter the password associated with the provided username.
Service Name: Enter the Service Name (or potentially the SID) of the specific Oracle database instance you want to connect to. This is the logical name for the database (e.g., ORCLPDB1 or FINANCE_PROD).
Once all five fields are filled, click the Next button to proceed to the next step.
Step 2: Select Tables and Views 📁
You will be presented with a list of available tables and views accessible by the provided username.
Action: Select the specific tables or views (e.g., HR.EMPLOYEES, SALES.ORDER_DETAILS) containing the raw data you wish to use for reporting in Whatsdash.
Click Next to proceed to the final configuration step.
Step 3: Define Dimensions and Metrics (Schema) 📊
In this step, you define how the columns from your selected tables will be interpreted and used in Whatsdash reports and dashboards.
Specify Fields: You are now prompted to specify which columns from your selected tables will be treated as Dimensions and which will be treated as Metrics.
Dimensions: Select columns that categorize or segment data.
Metrics: Select columns that contain numerical values you want to measure, aggregate, or calculate.
Finalize Integration: After defining your core dimensions and metrics, the connection is finalized and saved.
The Oracle integration will now be available in your Connected Integrations list.
🔗 Explore More Integrations
Whatsdash supports a wide range of marketing, analytics, and eCommerce integrations to give you a holistic view of your business performance.
👉 Visit the Integrations Page to explore all available connections
Jira
Jira is the leading issue and project tracking software for development, IT, and business teams. By integrating Jira with Whatsdash, you can monitor project progress, track team workload, and analyze issue resolution efficiency alongside your marketing and sales data.
Why Connect Jira to Whatsdash?
Integrating your Jira data into Whatsdash transforms raw project data into executive-level, cross-functional performance dashboards.
-
Cross-Functional Visibility: Blend issue and sprint data with metrics from your marketing , sales , and finance tools to see how project delays impact revenue or how marketing campaigns drive product feature requests.
-
Customized Team Reporting: Get a clear, visual breakdown of your team's throughput, cycle time, and backlog health without needing to navigate complex Jira filters and project boards.
-
Shareable, Simplified Insights: Move beyond Jira's internal dashboards to create universally understandable reports that you can securely share with all stakeholders, including clients and executives who don't have Jira access.
📋 Steps to Integrate your Jira Account to Whatsdash
✔️ Navigate to the 'Integrations' page using the Navigation bar.
✔️ Select Jira from the Available Integrations.

✔️ Click the + button to open the connection window, which will display the parameters form.
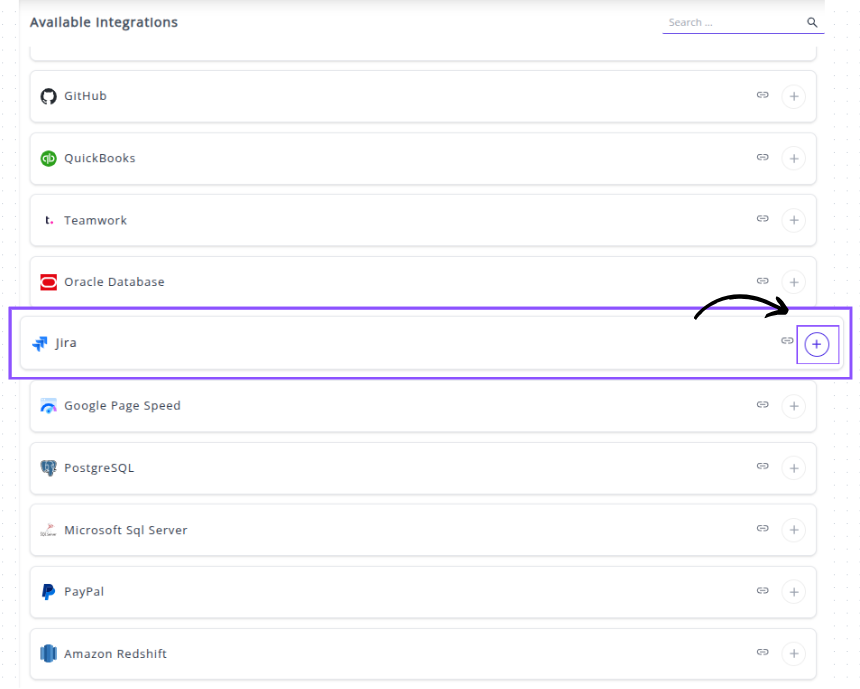
✔️ Enter your connection details:
- Api Token: Paste the API Token.
- Email: Enter the email address associated with the user account you used to generate the API Token.
- Site Url: Enter the base URL .
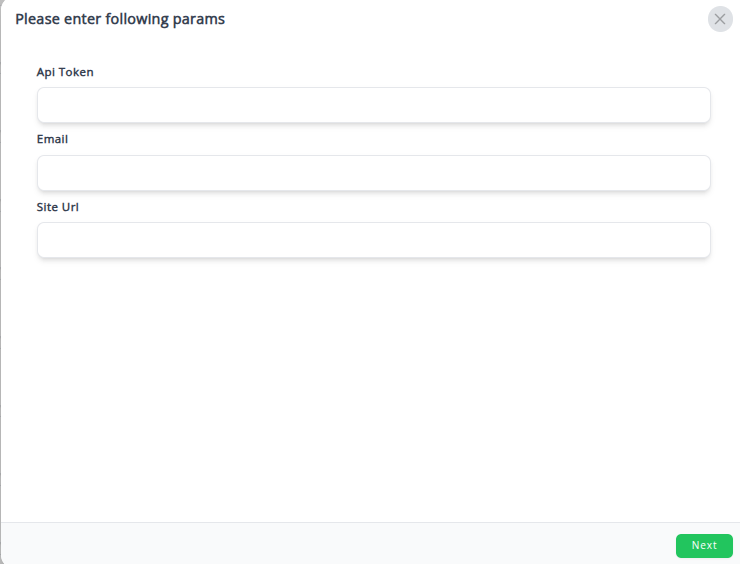
✔️ Click Next button.
✔️ Once authenticated, your Jira Integration will appear in the Connected Integrations list.

✔️ You can now create or customize dashboards using your Jira Metrics and Dimensions.
👉 How to visualize this data in your dashboard, visit the Dashboard Documentation Guide.
🔗 Jira Metrics
The table below lists the Jira Metrics available through the Whatsdash Jira Integration.
| Name | Category | Why it’s useful |
|---|---|---|
| Issues Count | Issue | Shows the total number of issues in a project, useful for workload assessment and reporting. |
| Subissue Count | Issue | Indicates the number of subtasks or child issues under a parent issue, helping track task breakdowns. |
| Watchers | Issue | Displays how many users are following or monitoring an issue, useful for gauging interest or visibility. |
| Votes Count | Issue | Shows the number of votes an issue has received, indicating priority or demand from stakeholders. |
| Project Count | Project | Represents the total number of projects in the Jira site, useful for overall project tracking. |
| Comment Count | Issue | Displays the number of comments on an issue, helping measure collaboration and communication activity. |
🔗 Jira Dimensions
The table below lists the Jira Dimensions available through the Whatsdash Jira Integration.
| Name | Category | Why it’s useful |
|---|---|---|
| Issue Name | Issue | Displays the name or summary of each issue, helping users quickly identify what the issue is about. |
| Issue Type | Issue | Categorizes issues (e.g., Bug, Task, Story) for better project organization and reporting. |
| Issue Status | Issue | Shows the current status of an issue (e.g., Open, In Progress, Done) to track workflow progress. |
| Issue Reporter | Issue | Identifies who reported the issue, useful for communication and accountability. |
| Issue Creation Date | Issue | Indicates when the issue was created, helpful for tracking backlog age and response time. |
| Issue Updation Date | Issue | Displays the last updated date to monitor activity and progress on issues. |
| Issue Priority Name | Issue | Shows the priority level (e.g., High, Medium, Low) to help prioritize work effectively. |
| Issue Priority Id | Issue | Represents the ID of the issue’s priority, useful for data integration or automation. |
| Issue Assignee Name | Issue | Identifies the person assigned to resolve the issue for workload tracking. |
| Issue Creator Name | Issue | Indicates who created the issue, useful for understanding origin and ownership. |
| Issue Project Name | Issue | Displays the project name linked to the issue for context and grouping. |
| Issue Project Key | Issue | Shows the project key (unique identifier), important for referencing issues programmatically. |
| Project Type | Project | Defines the type of project (e.g., software, business, service) to differentiate team workflows. |
| Issue Due Date | Issue | Displays when the issue is due, helping manage deadlines and overdue items. |
| Year | Time | Represents the year value (e.g., 2024), useful for year-based trend analysis. |
| Year Of Week | Time | Shows the year corresponding to a specific week, aiding weekly data grouping. |
| Year Of Week(ISO) | Time | Displays ISO-standard year-week values for consistent time reporting. |
| Year Month | Time | Combines year and month (e.g., 202410), useful for monthly trend insights. |
| Month | Time | Indicates the month number (e.g., 02), for filtering or aggregating monthly data. |
| Year Week | Time | Shows the year-week combination, ideal for weekly tracking and reporting. |
| Year Week(ISO) | Time | Displays ISO-standard year-week codes for alignment with calendar systems. |
| Week | Time | Represents the week number in a year (1–53), used for time-based grouping. |
| Week(ISO) | Time | Provides ISO week numbers for consistent reporting across regions. |
| Day Of Month | Time | Displays the day number (1–31), helpful for daily performance tracking. |
| Day Of Week Name | Time | Shows the day name (e.g., Monday, Tuesday) to analyze patterns by weekday. |
| Day Of Week Name(ISO) | Time | ISO-standard version of the day name, used for international consistency. |
| Date | Time | Full date value (e.g., 20241015) for precise time-based filtering and analysis. |
🔗 Explore More Integrations
Whatsdash supports a wide range of marketing, analytics, and eCommerce integrations to give you a holistic view of your business performance.
👉 Visit the Integrations Page to explore all available connections
Google PageSpeed Insights
Google PageSpeed Insights is a powerful tool that analyzes the performance and user experience of a web page on both mobile and desktop, based on data from both lab and real-world users (Chrome User Experience Report - CrUX).
Why Connect PageSpeed Insights to Whatsdash?
Integrating your performance data with Whatsdash transforms technical scores and metrics into actionable insights for all stakeholders, from developers to executives.
-
Track Core Web Vitals: Monitor your website's most critical performance Metrics like LCP (Largest Contentful Paint), INP (Interaction to Next Paint), and CLS (Cumulative Layout Shift) in real-time to maintain a competitive SEO ranking and excellent user experience.
-
Automated Monitoring & Benchmarking: Eliminate manual testing by setting up automated, scheduled reports for multiple URLs. Easily benchmark page performance across your entire site or against competitors.
-
Unified Business View: Blend PageSpeed scores with your Google Analytics, SEO, and Conversion Rate Optimization (CRO) data to directly quantify the business impact of your website's speed and user experience improvements.
📋 Steps to Integrate your Google PageSpeed Insights account to Whatsdash
✔️ Navigate to the 'Integrations' page using the Navigation bar.
✔️ Select Google PageSpeed Insights from the Available Integrations.

✔️ Click the + button to open the connection window.

✔️ Enter your WebPage URL details:
- A popup window will appear, prompting you to enter the URL.

url: Enter the full URL of the specific page you want to track (e.g., https://www.your-company.com/).
✔️ Click Next button.
✔️ Once authenticated and the initial scan is complete, your Google PageSpeed Insights Integration will appear in the Connected Integrations list.
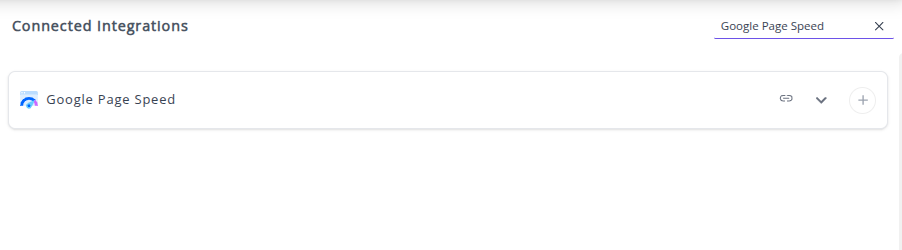
✔️ You can now create or customize dashboards using your PageSpeed Insights Metrics and Dimensions.
👉 How to visualize this data in your dashboard, visit the Dashboard Documentation Guide.
🔗 Google PageSpeed Insights Metrics
The table below lists the Google PageSpeed Insights Metrics available through the Whatsdash Google PageSpeed Insights Integration.
| Name | Category | Why it’s useful |
|---|---|---|
| Test Score | Categories | Represents the score of each individual audit, helping assess specific areas of page performance or compliance. |
| Category Score | Categories | Shows the overall score for a category (e.g., Performance, SEO), useful to quickly gauge the website’s strength in that area. |
| Environment benchmarkIndex | Environment | Provides the benchmark index for the testing environment, useful for comparing performance across different setups. |
| Test Value | Categories | Captures the numeric value of each audit, giving precise measurements behind the audit scores. |
| Analysis Time | Timing | Measures the total time taken for the page analysis, helpful to monitor performance of the audit process itself. |
🔗 Google PageSpeed Insights Dimensions
The table below lists the Google PageSpeed Insights Dimensions available through the Whatsdash Google PageSpeed Insights Integration.
| Name | Category | Why it’s useful |
|---|---|---|
| Test Name | Categories | Represents the title of the audit/test, helping identify specific performance or accessibility checks. |
| Category Name | Categories | Shows the category of the audit (like Performance, SEO, Accessibility), useful for grouping and prioritizing optimizations. |
| Strategy Name | Config Settings | Indicates whether the audit was run for Mobile or Desktop, useful for understanding device-specific performance results. |
🔗 Explore More Integrations
Whatsdash supports a wide range of marketing, analytics, and eCommerce integrations to give you a holistic view of your business performance.
👉 Visit the Integrations Page to explore all available connections
PostgreSQL
PostgreSQL is an advanced, powerful, open-source object-relational database system (ORDBMS) known for its proven reliability, feature robustness, and performance. It is a preferred data store for high-volume applications, analytics, and business intelligence systems.
Connecting your PostgreSQL Database to Whatsdash allows you to pull structured data from your core operational and analytical tables directly into your centralized dashboards for immediate business insight.
Why Connect PostgreSQL to Whatsdash?
Integrating your PostgreSQL data transforms raw SQL tables into clear, actionable business insights for all users.
-
Direct Operational Insight: Pull real-time, mission-critical metrics on inventory levels, subscription revenue, application usage, or performance data stored within your PostgreSQL tables and schemas.
-
Custom SQL Metrics: Write Custom Queries directly within Whatsdash to define and track specific metrics essential to your business logic, leveraging PostgreSQL's advanced SQL features like window functions and JSONB support.
-
Data Blending & Cross-Source Analysis: Seamlessly blend financial, sales, or product data from your PostgreSQL database with marketing data from platforms like GA4, Facebook Ads for a holistic view of business performance.
📋 Steps to Integrate your PostgreSQL Database to Whatsdash
Connecting a relational database requires a direct, secure connection. Whatsdash uses standard protocols to access your specified schemas and tables with read-only permissions.
✔️ Navigate to the 'Integrations' page using the Navigation bar.
✔️ Select PostgreSQL Database from the Available Integrations.
 ps2
✔️ Click the + button to open the connection configuration window.
ps2
✔️ Click the + button to open the connection configuration window.
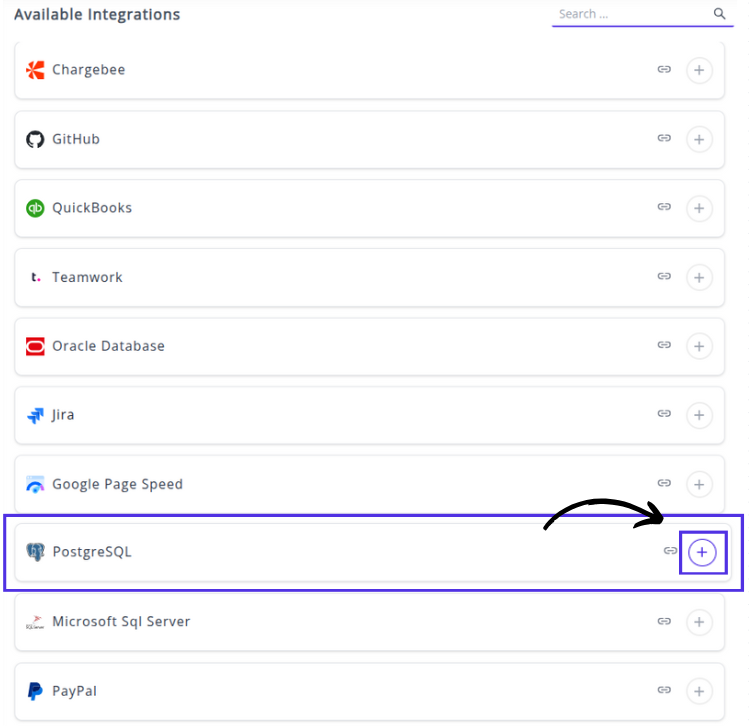
✔️ Enter your connection details in the form: Step 1: Enter your PostgreSQL Accountt credentials for the connection:

*Host : Enter the Host Name or IP Address of your PostgreSQL server.
*Port : Enter the Port Number used for PostgreSQL connections (e.g., the default 5432).
*Username : Enter the User Name with read-only privileges on the database.
*Password : Enter the Password for the specified user.
Step 2: Select Tables and Views 📁
You will be presented with a list of available tables and views accessible by the provided username.
Action: Select the specific tables or views (e.g., HR.EMPLOYEES, SALES.ORDER_DETAILS) containing the raw data you wish to use for reporting in Whatsdash.
Click Next to proceed to the final configuration step.
Step 3: Define Dimensions and Metrics (Schema) 📊
In this step, you define how the columns from your selected tables will be interpreted and used in Whatsdash reports and dashboards.
Specify Fields: You are now prompted to specify which columns from your selected tables will be treated as Dimensions and which will be treated as Metrics.
Dimensions: Select columns that categorize or segment data.
Metrics: Select columns that contain numerical values you want to measure, aggregate, or calculate.
Finalize Integration: After defining your core dimensions and metrics, the connection is finalized and saved.
✔️ Once successfully authenticated, your PostgreSQL Integration will appear in the Connected Integrations list.
🔗 Explore More Integrations
Whatsdash supports a wide range of marketing, analytics, and eCommerce integrations to give you a holistic view of your business performance.
👉 Visit the Integrations Page to explore all available connections
Microsoft SQL Server
Microsoft SQL Server is a robust, enterprise-level relational database management system (RDBMS) widely used for running mission-critical applications, data warehousing, and business intelligence.
By connecting your SQL Server instance to Whatsdash, you can securely pull transactional, operational, and analytical data directly into custom dashboards, providing a unified view of your core business metrics alongside other integrated platforms.
Why Connect Microsoft SQL Server to Whatsdash?
Integrating your SQL Server data with Whatsdash transforms raw database tables and query results into intuitive, real-time dashboards for better decision-making across your organization.
-
Centralized Data Visualization: Easily visualize complex data stored in your SQL Server database tables and custom views alongside data from your marketing, sales, and analytics tools,all in a single dashboard environment.
-
Custom Query Reporting & Control: Go beyond simple table exports. Whatsdash's direct SQL integration lets you use your own Transact-SQL (T-SQL) queries to join tables, aggregate data, and define exactly which granular metrics and dimensions are pulled for visualization.
-
Secure & Direct Connection: Leverage a secure, direct connection to your SQL Server instance, allowing you to access the single source of truth for your most critical business data without the need for manual data exports.
📋 Steps to Integrate your Microsoft SQL Server account to Whatsdash
✔️ Navigate to the 'Integrations' page using the Navigation bar.
✔️ Select Microsoft SQL Server from the Available Integrations.

✔️ Click the + button to open the connection configuration window.

✔️ Enter your connection details in the form:

-
Step 1: Enter Connection and Authentication Parameters 🔐
In this first step, you provide the essential connection details for Whatsdash to locate and log in to your Microsoft SQL Server instance.
You must fill in the following four mandatory fields marked with an asterisk (*):
Host * : Enter the hostname or IP address of your SQL Server (e.g., sqlserver.yourcompany.com or AZURE-SQL-DB.database.windows.net).
Port * : Enter the port number your SQL Server is listening on. The default port is typically 1433.
Username * : Enter the SQL username that has permissions to read the data you need .
Password * : Enter the password associated with the provided username.
Once all four fields are filled, click the green Next button to proceed.
-
Step 2: Select Database and Tables/Views 📁
Select Database: You will be prompted to select the specific database name within your SQL Server instance that contains the reporting data (e.g., ProductionData, SalesWarehouse).
Select Tables/Views: You will then see a list of available tables and views within that database. Select the specific tables or views that hold the core data you want to use for dashboards (e.g., the dbo.Orders table, or a Reporting.Leads view).
Testing/Validation: You may be asked to test the connection at the table level to ensure the user has necessary permissions.
Click Next to proceed to the final configuration step.
-
Step 3: Define Dimensions and Metrics 📊
In this final step, you define how the columns from your selected tables will be interpreted by Whatsdash, creating a usable schema for reporting.
Specify Fields: You are prompted to define the schema by designating columns as Dimensions or Metrics.
Dimensions: Select columns used for categorization, grouping, or time segmentation (e.g., OrderDate, CustomerName, Region).
Metrics: Select columns containing numerical values you want to measure, aggregate, or calculate (e.g., OrderTotal, UnitsSold, InventoryCount).
Finalize Integration: After defining your schema, the integration is finalized and saved.
✔️ Once successfully authenticated, your Microsoft SQL Server Integration will appear in the Connected Integrations list.
🔗 Explore More Integrations
Whatsdash supports a wide range of marketing, analytics, and eCommerce integrations to give you a holistic view of your business performance.
👉 Visit the Integrations Page to explore all available connections
PayPal
PayPal is the world’s leading online payment processor, enabling businesses to send and receive payments securely.Connecting PayPal to Whatsdash allows you to consolidate your e-commerce and transaction data with marketing and sales metrics, providing a comprehensive view of your business's financial performance.
Why Connect PayPal to Whatsdash?
Integrate your PayPal transaction data with Whatsdash to gain a clear, centralized view of sales, refunds, and fees alongside your customer acquisition metrics.
-
Real-Time Transaction Monitoring: Keep track of key financial Metrics like Total Revenue, Transaction Volume, Net Sales, and Fees in real-time.
-
Integrated E-commerce Analysis: Blend PayPal sales data with user behavior from Google Analytics 4 and ad spend from Google Ads to calculate true Return on Ad Spend (ROAS) and Customer Lifetime Value (CLV).
-
Simplified Reporting: Access critical sales and refund reports without navigating the detailed transaction search features within the PayPal platform.
📋 Steps to Integrate your PayPal Account to Whatsdash
✔️ Navigate to the 'Integrations' page using the Navigation bar.
✔️ Select Paypal from the Available Integrations.
 ✔️ Click the **+** button to open the connection window.

✔️ Enter your connection details :

- Client ID: Paste the Client ID for your Paypal Account.
- Client Secret Paste the Client Secret for your Paypal Account.
✔️ Click Next button.
✔️ Once authenticated, your PayPal Integration will appear in the Connected Integrations list.
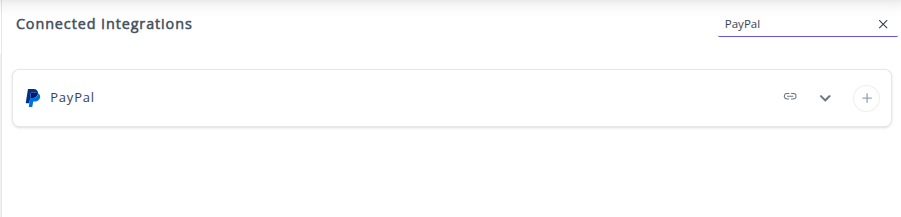
✔️ You can now create or customize dashboards using your PayPal transaction Metrics and Dimensions.
🔗 Paypal Metrics
The table below lists the Paypal Metrics available through the Whatsdash Paypal Integration.
| Name | Category | Why it’s useful |
|---|---|---|
| Fees | Transaction | Shows charges assessed by PayPal (currency conversion, cross-border, processing), helping businesses track costs per transaction. |
| Shipping Costs | Transaction | Measures shipping and handling expenses, useful for cost analysis and pricing strategy adjustments. |
| Gross Amount | Transaction | Total money sent including fees and refunds, helps understand total transaction volume. |
| Item Amount | Transaction | Total value of items sold, useful for sales reporting and inventory analysis. |
| Tax Amount | Transaction | Captures total taxes applied, essential for tax reporting and compliance. |
| Items Count | Transaction | Total number of items sold, helps in inventory and sales tracking. |
| Items Quantity | Transaction | Total quantity of items sold, useful for detailed sales and logistics insights. |
| Transactions | Transaction | Tracks number of completed payments, useful for understanding sales volume and customer behavior. |
| Transactions Available Balance | Transaction | Shows balance available from transactions, helps in cash flow monitoring. |
| Transactions Amount | Transaction | Total balance from transactions, useful for overall revenue tracking. |
| Pending | Transaction | Number of transactions under review or verification, helps identify delayed payments. |
| Average Selling Price | Transaction | Measures average price of goods/services sold, helpful for pricing trends and business strategy. |
| Balance | Balance | Funds available in the account for payments or withdrawals, key for liquidity tracking. |
| Available Balance | Balance | Total funds ready for use, useful for immediate operational decisions. |
| Withheld Balance | Balance | Funds held back by PayPal, important for reconciliation and risk management. |
| Crypto Balance | Balance | Total cryptocurrency balance, useful for managing digital assets. |
🔗 Paypal Dimensions
The table below lists the Paypal Dimensions available through the Whatsdash Paypal Integration.
| Name | Category | Why it’s useful |
|---|---|---|
| Transaction ID | Transaction | Unique identifier for each transaction, essential for tracking and reconciliation. |
| Transactions Status | Transaction | Provides a summary of transaction statuses (completed, pending, refunded), useful to monitor payment flows and identify issues. |
| Item Name | Transaction | Shows the name of items involved in transactions, useful for reporting and inventory tracking. |
| Payer Name | Transaction | Captures the name of the person making the payment, important for auditing and customer tracking. |
| Shipping City | Transaction | Shows the city to which items are shipped, helpful for logistics and regional analysis. |
| Account ID | Balance | Unique identifier for the account, important for account-level reporting and balance tracking. |
| Year | Time | Year of the transaction, useful for yearly aggregation and trend analysis. |
| Year Of Week | Time | Year corresponding to the week, useful for weekly trend analysis. |
| Year Of Week(ISO) | Time | ISO-standard year of the week, ensures consistency in international reporting. |
| Year Month | Time | Year and month combined (YYYYMM), useful for monthly reporting. |
| Month | Time | Month of the transaction, helps analyze seasonal trends. |
| Year Week | Time | Year and week combined (YYYYWW), useful for weekly reports. |
| Year Week(ISO) | Time | ISO-standard year and week, standardizes weekly reporting. |
| Week | Time | Week number of the year, useful for week-based aggregation. |
| Week(ISO) | Time | ISO-standard week number, ensures consistent weekly analysis. |
| Day Of Month | Time | Day of the month, helpful for daily reports. |
| Day Of Week Name | Time | Name of the day (e.g., Tuesday), useful for day-of-week trend analysis. |
| Day Of Week Name(ISO) | Time | ISO-standard day name, ensures consistency across systems. |
| Date | Time | Full date of the transaction (YYYYMMDD), useful for precise daily tracking. |
🔗 Explore More Integrations
Whatsdash supports a wide range of marketing, analytics, and eCommerce integrations to give you a holistic view of your business performance.
👉 Visit the Integrations Page to explore all available connections
Amazon Redshift
Amazon Redshift is a fully managed, petabyte-scale cloud data warehouse service that makes it simple and cost-effective to analyze all your data using standard SQL and your existing Business Intelligence (BI) tools. It's engineered for high-performance analytical processing, making it an ideal central repository for business intelligence, reporting, and complex data analysis.
Why Connect Amazon Redshift to Whatsdash?
Integrating your Amazon Redshift data with Whatsdash leverages the power of your cloud data warehouse, turning raw, aggregated data into visualized metrics for faster, more informed decision-making.
-
High-Performance Visualization: Utilize Redshift's Massively Parallel Processing (MPP) architecture to execute complex analytical queries quickly, ensuring your dashboards are powered by up-to-the-second data even with petabyte-scale datasets.
-
Centralized Analytical Hub: Pull critical, aggregated data from your Redshift warehouse and visualize it alongside operational metrics from your marketing, sales, and analytics platforms in a unified dashboard environment.
-
Custom SQL Query Reporting: Whatsdash's direct integration allows you to use your own SQL queries to define specific analytical datasets, enabling advanced joins, window functions, and data transformations directly within Redshift before visualization.
-
Secure Cloud Connection: Establish a secure and direct connection to your Amazon Redshift cluster, respecting your established AWS security protocols for data access.
📋 Steps to Integrate your Amazon Redshift account to Whatsdash
✔️ Navigate to the 'Integrations' page using the Navigation bar.
✔️ Select Amazon Redshift from the Available Integrations.

✔️ Click the + button to open the connection configuration window.

✔️ Enter your connection details in the form:

-
Step 1: Enter AWS Security and Location Parameters 🔐
In this first step, you provide the necessary AWS credentials and specify the location of your Redshift cluster and how the database credentials will be retrieved.
You must fill in the following five mandatory fields marked with an asterisk (*):
*AWS access Key : Enter the AWS Access Key ID for a user with permissions to read data from the Redshift cluster and access the region
*AWS secret Key : Enter the corresponding AWS Secret Access Key.
*Region name : Enter the AWS Region where your Redshift cluster is hosted (e.g., us-east-1, eu-west-2).
*Secret Type : Select the service used to store your Redshift login credentials. By default,the Secret Type is set to Secret Manager.
For "Secret Manager" in Secret Type ,you need to specifiy the Secret Name field, Otherwise, you need to specify the details ofthe Amazon Redshift credentials manually.
*Secret name : Enter the name of the secret stored in AWS Secrets Manager that holds the Redshift database credentials (username and password).
Once all five fields are filled, click the green Next button to proceed.
-
Step 2: Enter Redshift Connection Details ⚙️
Cluster Endpoint/Host: You will be prompted to enter the host URL or IP address of your Redshift cluster.
Note: The cluster endpoint should be publicly accessible endpoint.
Port: Enter the port number for the cluster (the default is typically 5439).
Database Name: Enter the name of the specific Redshift database you wish to query (e.g., analytics_db).
Click Next to proceed.
-
Step 3: Select Schema and Tables 📁 After successful connection, you specify the data source structure.
Select Schema: Choose the specific Redshift schema (like a folder) that contains your reporting data (e.g., public, reporting).
Select Tables/Views: You will be presented with the available tables and views within that schema. Select the specific tables or materialized views that hold the core data you want to use for dashboards (e.g., fct_sales, dim_customer).
Click Next to proceed to the final configuration step.
-
Step 4: Define Dimensions and Metrics 📊
In this step, you define how the columns from your selected tables will be interpreted by Whatsdash.
Specify Fields: You are prompted to define the schema by designating columns as Dimensions or Metrics.
Dimensions: Select columns used for categorization, grouping, or time segmentation (e.g., sale_date, region_name, product_id).
Metrics: Select columns containing numerical values for aggregation and calculation (e.g., total_revenue, units_sold, cost_of_goods).
Finalize Integration: After defining the schema, the connection is saved.
✔️ Once successfully authenticated, your Amazon Redshift Integration will appear in the Connected Integrations list.
🔗 Explore More Integrations
Whatsdash supports a wide range of marketing, analytics, and eCommerce integrations to give you a holistic view of your business performance.
👉 Visit the Integrations Page to explore all available connections
Google BigQuery
Google BigQuery is a powerful, serverless, and highly scalable enterprise data warehouse that enables super-fast SQL queries against petabytes of data. As a core component of the Google Cloud ecosystem, it's designed for data analysts and data scientists to easily turn raw data into actionable insights at massive scale without managing any infrastructure.
Why Connect Google BigQuery to Whatsdash?
Integrating your BigQuery data with Whatsdash transforms your massive data sets into interactive, real-time dashboards for operational reporting, trend analysis, and comprehensive business intelligence.
-
Query Performance at Scale: Leverage BigQuery's columnar storage and serverless architecture to run fast queries and generate complex reports instantly, even on petabytes of data, directly within your Whatsdash environment.
-
Custom SQL & Flexible Modeling: Go beyond pre-aggregated reports, Whatsdash's direct integration lets you use standard SQL to define exactly which metrics and dimensions are pulled, allowing for dynamic filtering, joining, and aggregation across your data models.
-
Secure & Cloud-Native Access: Connect via secure, OAuth or Service Account-based authentication, ensuring your data remains protected within the Google Cloud ecosystem while providing Whatsdash with read-only access to generate your visualizations.
-
Data Blending & Cross-Source Analysis: Seamlessly blend your BigQuery data with metrics from other integrated platforms like Google Analytics, CRM, and advertising tools for a holistic view of the entire customer journey.
📋 Steps to Integrate your Google BigQuery account to Whatsdash
✔️ Navigate to the 'Integrations' page using the Navigation bar.
✔️ Select Google BigQuery from the Available Integrations.

✔️ Click the + button to open the connection configuration window.

✔️ Select your preferred BigQuery data via Google Sign-in:
Google Account (OAuth): You will be redirected to Google to sign in and grant Whatsdash access to your BigQuery data.
✔️ Once the connection is validated, Your Google BigQuery Integration will appear in the Connected Integrations list.
🔗 Explore More Integrations
Whatsdash supports a wide range of marketing, analytics, and eCommerce integrations to give you a holistic view of your business performance.
👉 Visit the Integrations Page to explore all available connections
Azure SQL Database
Azure SQL Database is Microsoft's intelligent, scalable, cloud-based relational database service. Built on the familiar SQL Server engine, it offers a fully managed platform as a service (PaaS) that enables you to build and run modern applications without managing the underlying infrastructure.
Why Connect Azure SQL Database to Whatsdash?
Integrating your Azure SQL Database data with Whatsdash transforms raw database tables and query results into intuitive, real-time dashboards for better decision-making across your organization.
-
Cloud-Native Data Access: Leverage a secure, high-performance connection to your cloud database, accessing your single source of truth for critical application data and core business metrics.
-
Centralized Data Visualization: Easily visualize complex data stored in your Azure SQL tables and custom views alongside data from your marketing, sales, and analytics tools, all in a single dashboard environment.
-
Custom T-SQL Query Reporting: Whatsdash's direct integration lets you use your own Transact-SQL (T-SQL) queries to join tables, aggregate data, and define exactly which granular metrics and dimensions are pulled for visualization.
-
Data Blending & Cross-Source Analysis: Blend and cross-reference your Azure SQL data with metrics from other sources like Google Analytics, CRM, and advertising platforms for comprehensive business analysis.
📋 Steps to Integrate your Azure SQL Database account to Whatsdash
✔️ Navigate to the 'Integrations' page using the Navigation bar.
✔️ Select Azure SQL Server from the Available Integrations.

✔️ Click the + button to open the connection configuration window.

✔️ Enter your connection details in the form:

-
Step 1: Enter Connection and Authentication Parameters 🔐
In this first step, you provide the essential connection details for Whatsdash to locate and log in to your Azure SQL Database server.
You must fill in the following four mandatory fields marked with an asterisk (*):
Host * : Enter the fully qualified domain name (FQDN) of your Azure SQL Database server.
Port * : Enter the port number your Azure SQL Database is listening on. The default for Azure SQL is typically 1433.
Username * : Enter the username for the SQL login that has permissions to read the data you need .
Password * : Enter the password associated with the provided username.
Once all four fields are filled, click the Next button to proceed.
-
Step 2: Select Database and Tables/Views 📁
Select Database : You will be prompted to select the specific database within your Azure server instance that contains the reporting data (e.g., SalesDB, AnalyticsWarehouse).
Select Tables/Views : You will then see a list of available tables and views within that database. Select the specific tables or views that hold the core data you want to use for dashboards (e.g., the Orders table, or a CustomerSummary view).
Click Next to proceed to the final configuration step.
-
Step 3: Define Dimensions and Metrics 📊
In this step, you define how the columns from your selected tables will be interpreted by Whatsdash, creating a usable schema for reporting.
Specify Fields: You are prompted to define the schema by designating columns as Dimensions or Metrics.
Dimensions: Select columns used for categorization, grouping, or time segmentation (e.g., order_date, product_id, city).
Metrics: Select columns containing numerical values you want to measure, aggregate, or calculate (e.g., sale_amount, transaction_count).
Finalize Integration: After defining your schema, the integration is finalized and saved.
✔️ Once successfully authenticated, your Azure SQL Server Integration will appear in the Connected Integrations list.
🔗 Explore More Integrations
Whatsdash supports a wide range of marketing, analytics, and eCommerce integrations to give you a holistic view of your business performance.
👉 Visit the Integrations Page to explore all available connections
Shopify Advanced Reports
The Shopify Advanced Reports in Whatsdash provides a quick overview of your shopify account status, store performance, and recent activities. It’s your starting point to stay informed about reports, integrations, and key metrics.
📟 Highlights
Quickly view your store’s overall performance across key metrics, organized in easy-to-read tabs.
You’ll also see the most recent data refresh time, ensuring your insights are always up-to-date.

📜 Recent Activities
Track the most recent actions performed in your Whatsdash account.
Activities are listed in descending order, ensuring your latest activity appears first.
💼 Reports
Access, manage, and customize all your saved reports in one place.
You can search, edit, schedule, or mark reports as favorites for quick access anytime.
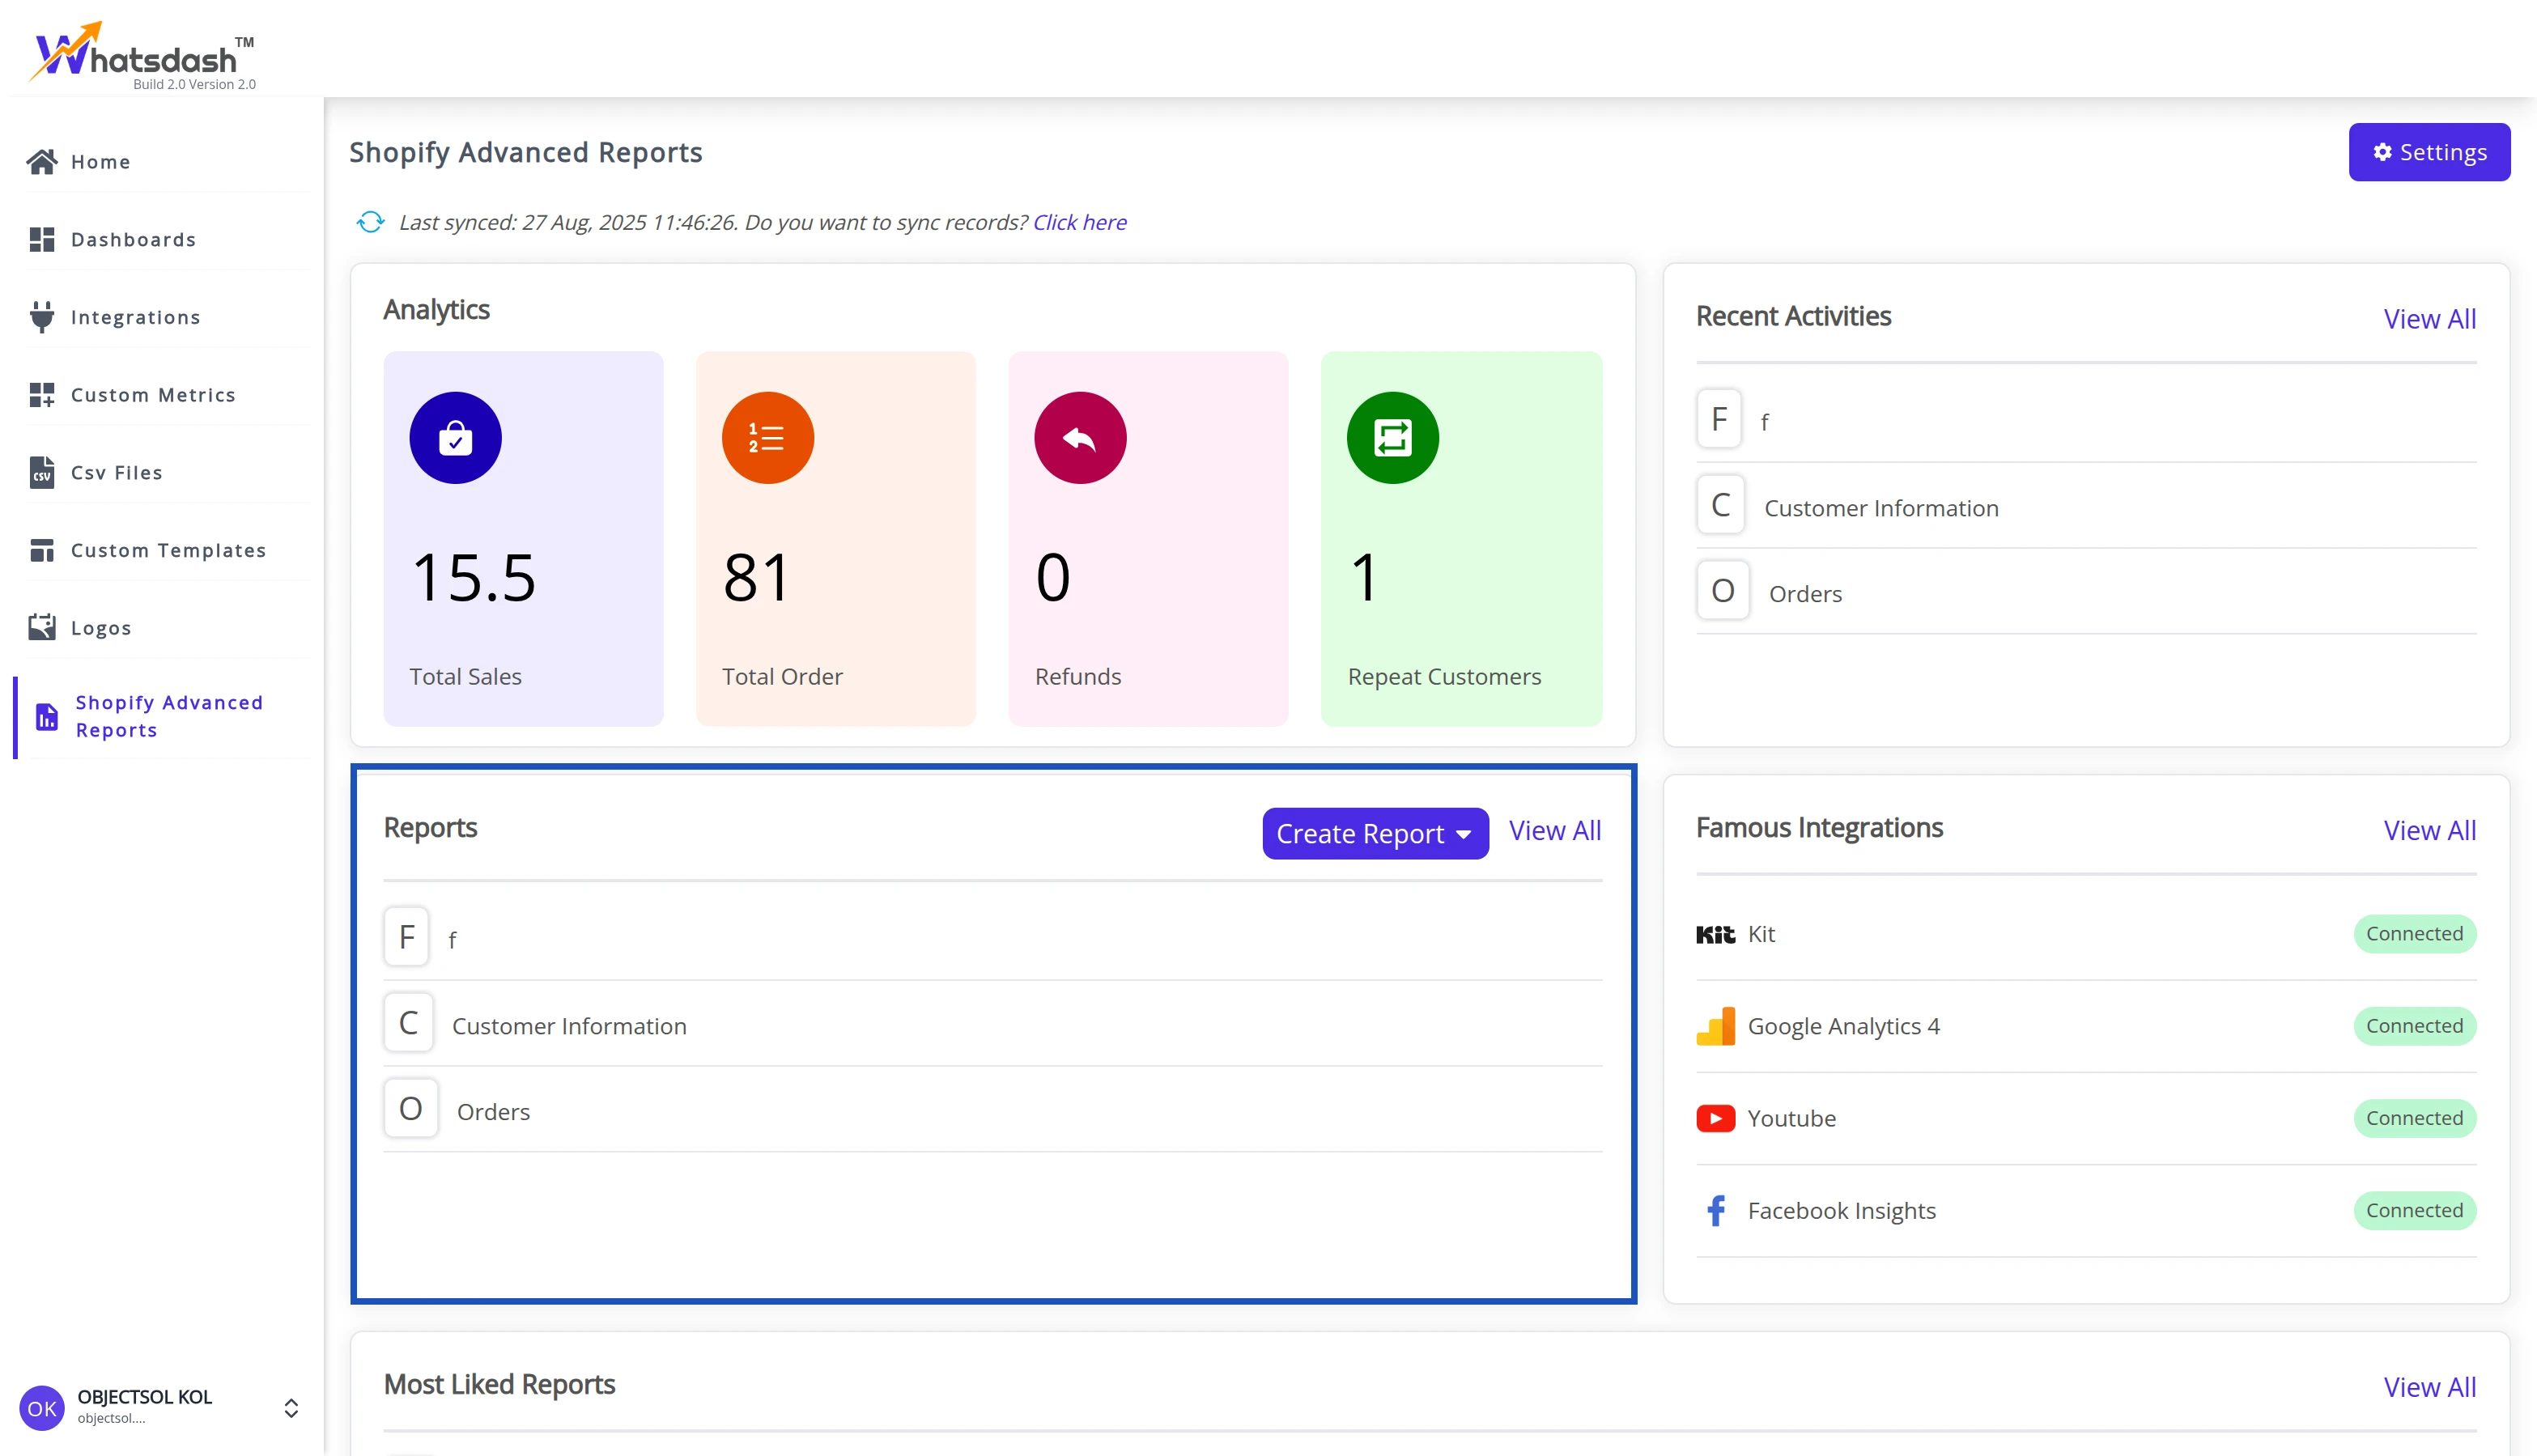
👉 For learn more click on Reports!!
🤝 Famous Integrations
Discover trending third-party app integrations among Whatsdash users. You can also check whether your account is connected to these apps.
👉 Click View More at the bottom to open the Integrations page.

💥 Most Liked Reports
Discover which reports are most frequently accessed by Whatsdash users.
This section automatically highlights the reports you open most often, helping you quickly access your top insights.
👉 Click View All at the bottom to explore the complete Most Liked Reports list, or click Create Report to build a new one.

⚙️ Settings
How to Access Settings in Whatsdash
You can access the Settings page directly on clicking the "Setting" button in Whatsdash.
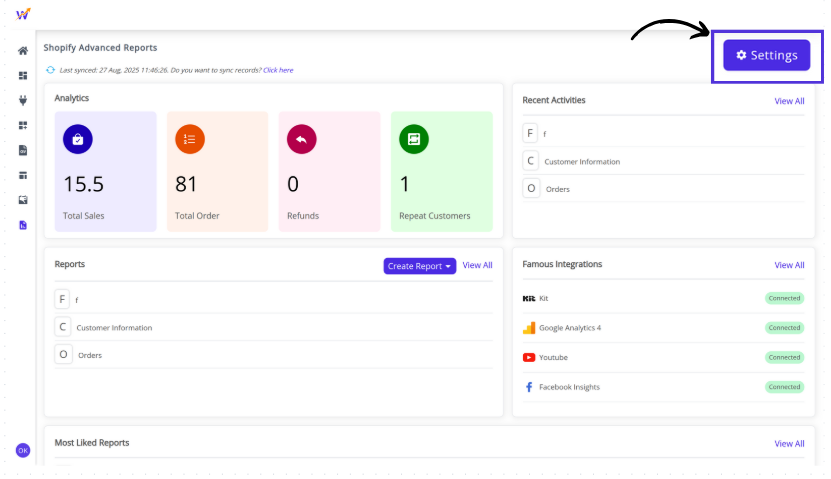
Once opened, the Settings page displays a left navigation panel that lets you manage key aspects of your account efficiently.
⚙️ Settings Overview
In Whatsdash, the Settings page contains the following options:
👤 Account View : All your personal and plan-related information in one place. You can check details such as your profile, subscription status, and plan usage.
👉 Learn more about Account Settings
🔄 Data Sync Control : How and when your store data is synchronized with Whatsdash. You can perform manual syncs or enable automatic refreshes.
👉 Learn more about Data Sync Options
👤 Account
The Account section in Whatsdash lets you view key details about your store, plan, and account configuration.
This page helps you verify your active plan, Shopify connection, and registered email — all in one place.
🧭 Where to Find It
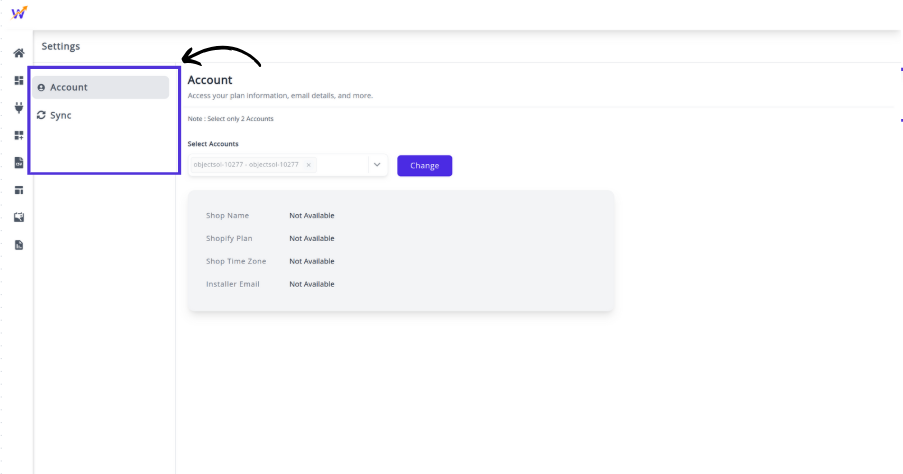 You can access the Account page by navigating to:
Settings → Account in the left navigation panel.
📋 Details Displayed in the Account Section
| Field | Description |
|---|---|
| Shop Name | Displays your Shopify store name connected to ReportGuru.ai. |
| Shopify Plan | Displays your Shopify plan (e.g., Developer Preview, Basic, Advanced). |
| Shop Time Zone | Shows the time zone set in your Shopify account, used for time-based reporting. |
| Installer Email | The email ID associated with your ReportGuru.ai installation. This email receives important notifications and updates. |
💡 Additional Options
-
Receive tips & best practices on reporting & data analysis
Enable this option to get insights and suggestions from the Whatsdash team on improving your analytics and reports.
🧾 Notes : The Account section is view-only — you cannot directly modify any details here.
For plan upgrades, go to your Profile Page and then open the Plans page. If you change your Shopify store information, updates will automatically reflect here after the next data sync.
🔄 Data Synchronization
The Data Sync feature in Whatsdash helps you control how and when your Shopify and connected data sources are synchronized.
It ensures your reports always reflect the latest store information, including orders, customers, products, and transactions.
🧠 Overview

The Recent Sync History section displays your latest synchronization activity for all key data categories such as:
- Orders
- Products
- Customers
- Transactions
- Events
- Locations
- Collections
- Customer Journey
- Payout
- Others
Each category shows:
- Last Updated Timestamp — indicates when the data was last refreshed.
- Current Status — such as “Waiting for sync…” or “Syncing”.
⚙️ How It Works
Whatsdash automatically synchronizes your data at regular intervals to ensure accuracy in analytics and reporting.
You can also manually initiate synchronization when you need the latest data instantly.
🔘 Force Sync
If you’ve recently updated information in your Shopify store or connected apps, click the “Force Sync” button to trigger an immediate refresh.
This ensures your data fields (like sales totals, customer counts, or inventory details) are updated in real-time within your reports.
📊 Data Categories Synced
| Category | Description |
|---|---|
| Order | Fetches all Shopify order data including order details, totals, and fulfillment. |
| Product | Updates product titles, SKUs, categories, and variants. |
| Customer | Syncs customer information like names, emails, and order history. |
| Transaction | Pulls transaction-level data such as payments, refunds, and gateway details. |
| Event | Tracks important store events and activities. |
| Location | Updates inventory and warehouse location data. |
| Collection | Fetches product collection and category details. |
| Customer Journey | Provides insights into customer behavior and purchase flow. |
| Payout | Syncs payout and settlement information from Shopify. |
| Others | Any other relevant data integrated into your account. |
💡 Tips
- Use Force Sync before generating a time-sensitive report to ensure data accuracy.
- Sync operations may take a few minutes depending on your data size.
- Avoid triggering multiple syncs simultaneously to prevent performance delays.
- Data automatically refreshes every few hours to keep analytics up-to-date.
🖼️ Visual Reference

📚 Related Pages
📊 Reports Page
The Reports section in Whatsdash allows you to easily view, manage, and organize all your generated reports in one place. From quick summaries to detailed analytics, this feature helps users access essential business data efficiently.
🧭 Reports Overview
When you navigate to the Reports section from the home page, you’ll see a clean and organized list of available reports, as shown below:
Each report entry includes:
-
🟢 Initial Icon — The first letter of the report name, color-coded for quick visual recognition.
-
📘 Report Name — The title of the report (e.g., Product-Type Stock Overview, Order Reports, ShipStation Detailed).
-
➕ Create Report — A button that lets you generate a new report directly from this page.
-
🔍 View All — Opens the All Reports page, where you can access a comprehensive list of all reports created.
💡 Tip: Each report listed here is clickable. You can click on any report name to open it directly for viewing or editing.
📄 All Reports Page
Clicking View All from the Reports section opens the All Reports page — a detailed table view displaying every report in your system.
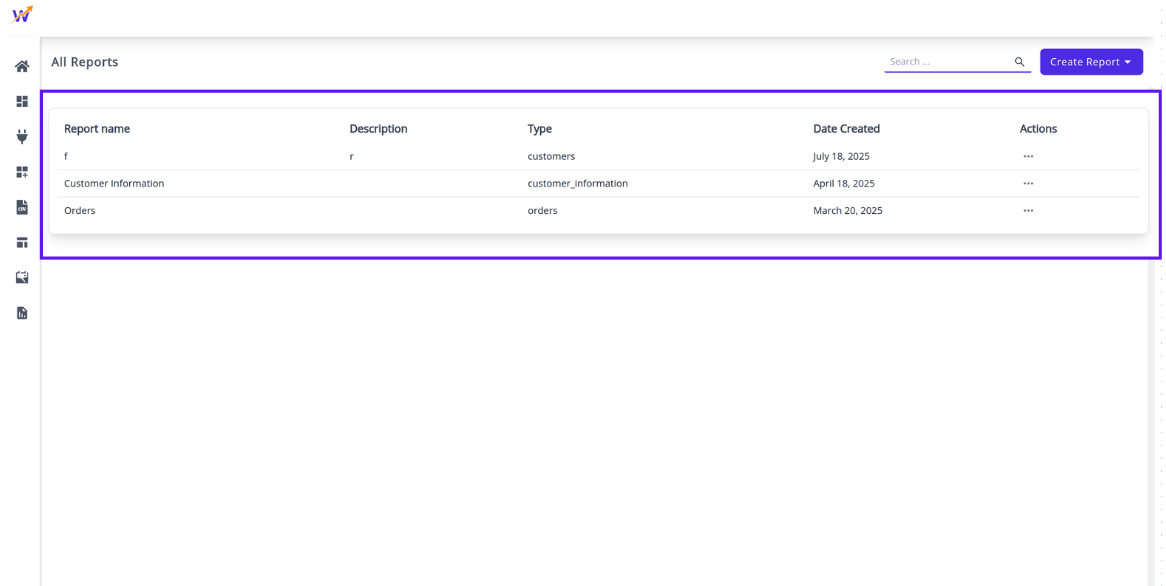
This table includes the following columns:
-
Report Name — The name of the report. Each name is clickable — selecting one opens the full report view where you can review, edit, or update its details.
-
Description — Additional context or notes about the report (e.g., “This report created for video purpose”).
-
Type — The data source or category of the report, such as orders, customers, inventory_by_product_type, etc.
-
Date Created — The date when the report was generated, helping users track updates or new additions.
-
Actions — Options menu (three dots) to edit, duplicate, or delete the report.
🧩 Report Types
Some common report types include:
- Orders Reports – Summarizes all order-related data.
- Inventory by Product Type – Displays stock levels grouped by product categories.
- ShipStation Detailed – Provides shipping and fulfillment insights.
- Customer Reports – Lists customer activity or sales data.
- Marketing Reports – Summarizes performance of campaigns and channels.
✏️ Viewing & Editing Reports
Every report in both the Reports Overview and All Reports pages is interactive:
Click a Report Name to open its detailed view.
Inside the report view, you can:
- Edit report settings and filters.
- Update descriptions and report names.
- Regenerate or refresh data if applicable.
- Save changes instantly.
Updated reports automatically reflect in both the Reports list and All Reports table.
🚀 Creating a New Report
To create a new report:
- Click the Create Report button.
- Select your preferred report type from the dropdown.
- Fill in the required fields (name, description, type, etc.).
- Click Save to generate the new report.
The new report will appear instantly in the Reports and All Reports lists.
Customized Reports
Every business is unique, with its own reporting needs. Whatsdash lets you create Custom Reports tailored to your requirements.
Whether you want to build a new report from scratch or modify an existing one, this feature helps you get actionable insights quickly.
📋 Steps to Create Your Custom Report
- Open the Create Report tool : After logging in to Whatsdash, you’ll see the Create Report Button in the Home tab. Click it and choose Custom Report from the dropdown.
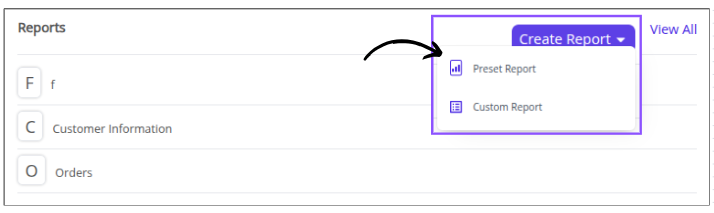
- Name your report : Give your report a clear Name. Add a Description if needed, then click Next.
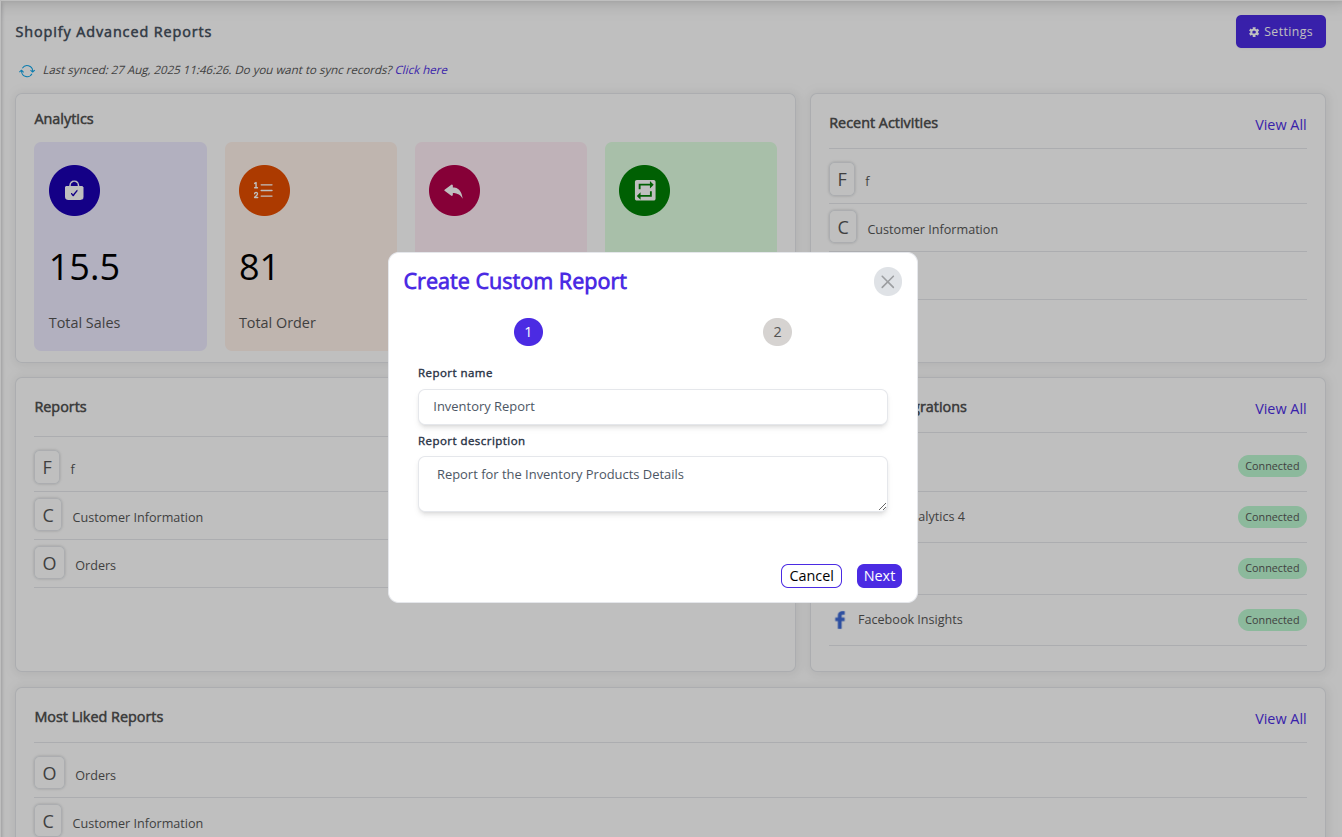
- Choose a report category : Select your Report Category from the available options and click Create to proceed.
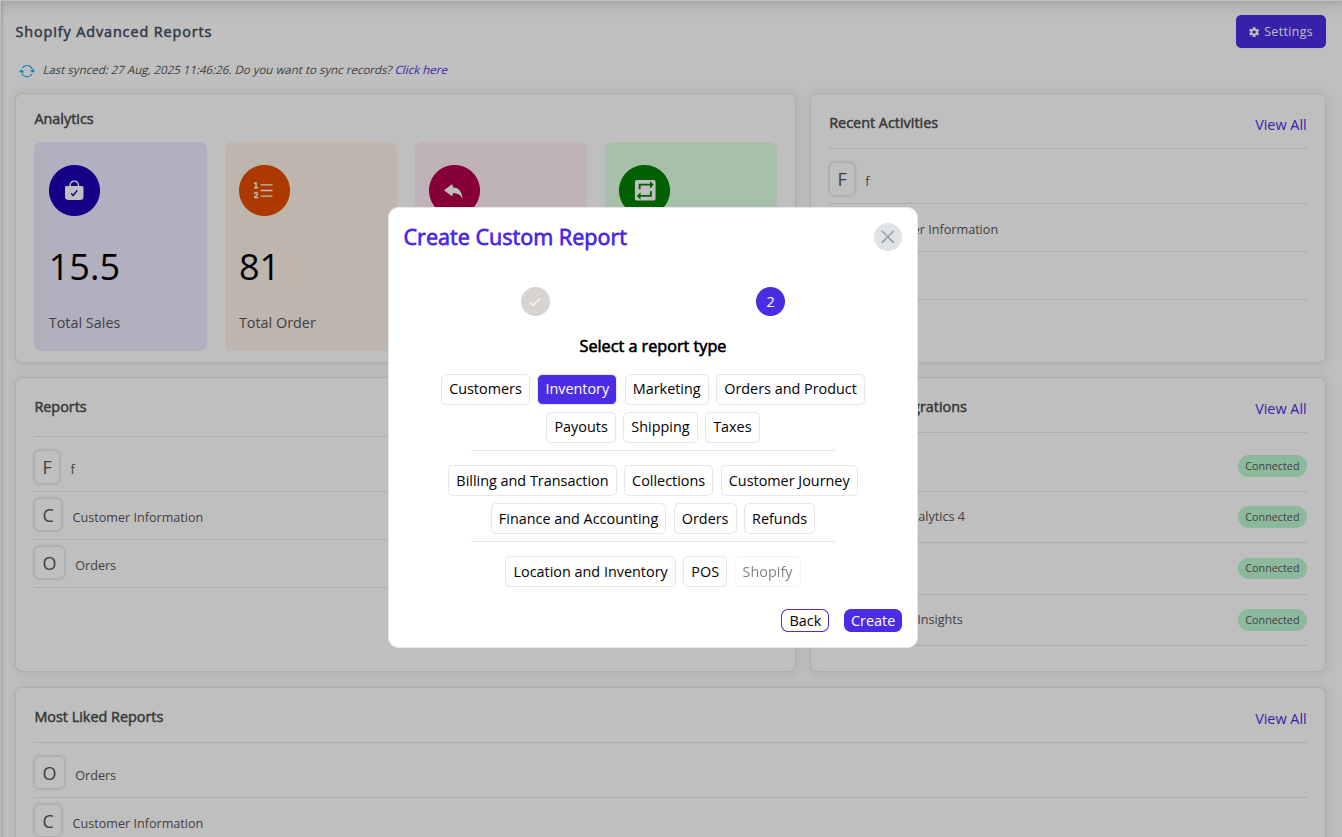
- Set a date range : Use the date selector tab to pick a preset (e.g. Month of July) or enter custom start and end dates.
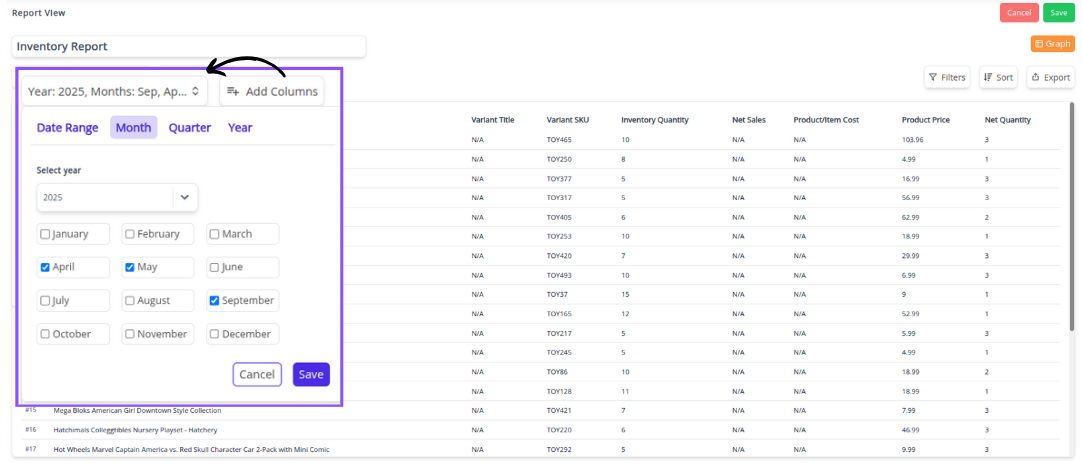
- Select the data fields : Some related fields will be chosen by default. Add more via the Add Columns button. Use the search bar to quickly locate fields.
Example: Barcode (UPC), Inventory Quantity, Price.
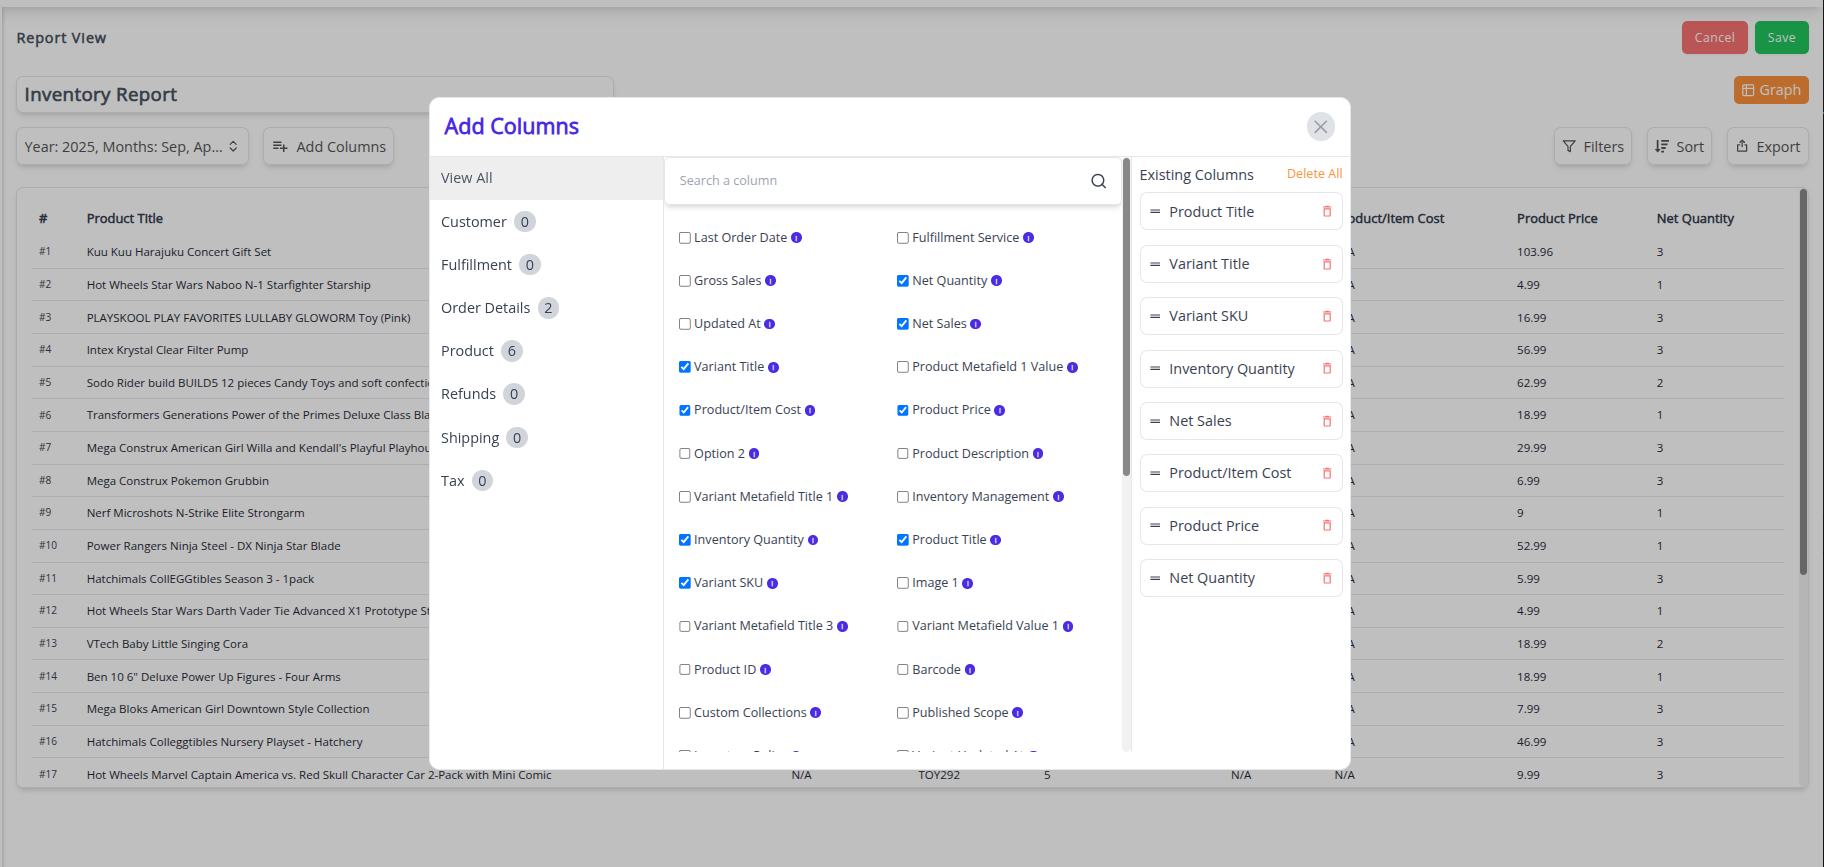
- Save your report : Click Save. Access all saved reports anytime by clicking View All in the “Reports” section of the Home tab.
⭐ That’s it! You’ve successfully created a customized report.
📑 Selected Fields Panel
When you click Add Columns, a pop-up window opens.
On the right side, you’ll see a panel listing all the fields you’ve already added to your report.

📝 What You See
Left Panel: Shows all available Report Types (categories).
You can switch the report type here and view every field within that type.
Fields with checkmarks are the ones currently included in your report.
Right Panel: Displays the Selected Fields — all the columns you’ve chosen for your report.

🗂 Column Types
- Numeric Columns: All number-based fields (for example: Discount).
- Text Columns: All text-based fields (for example: Product Name).
🔄 Reordering Fields
The selected fields are automatically organized in order.
To change the order, click and hold the two-line handle (≡) on the left side of a field, then drag it up or down to the desired position.
📔 Preset Reports
Start tracking your store’s performance from day one with 80+ ready-to-use Shopify reports.
No coding, no setup — just connect your store and get instant insights into sales, inventory, orders, and customers.
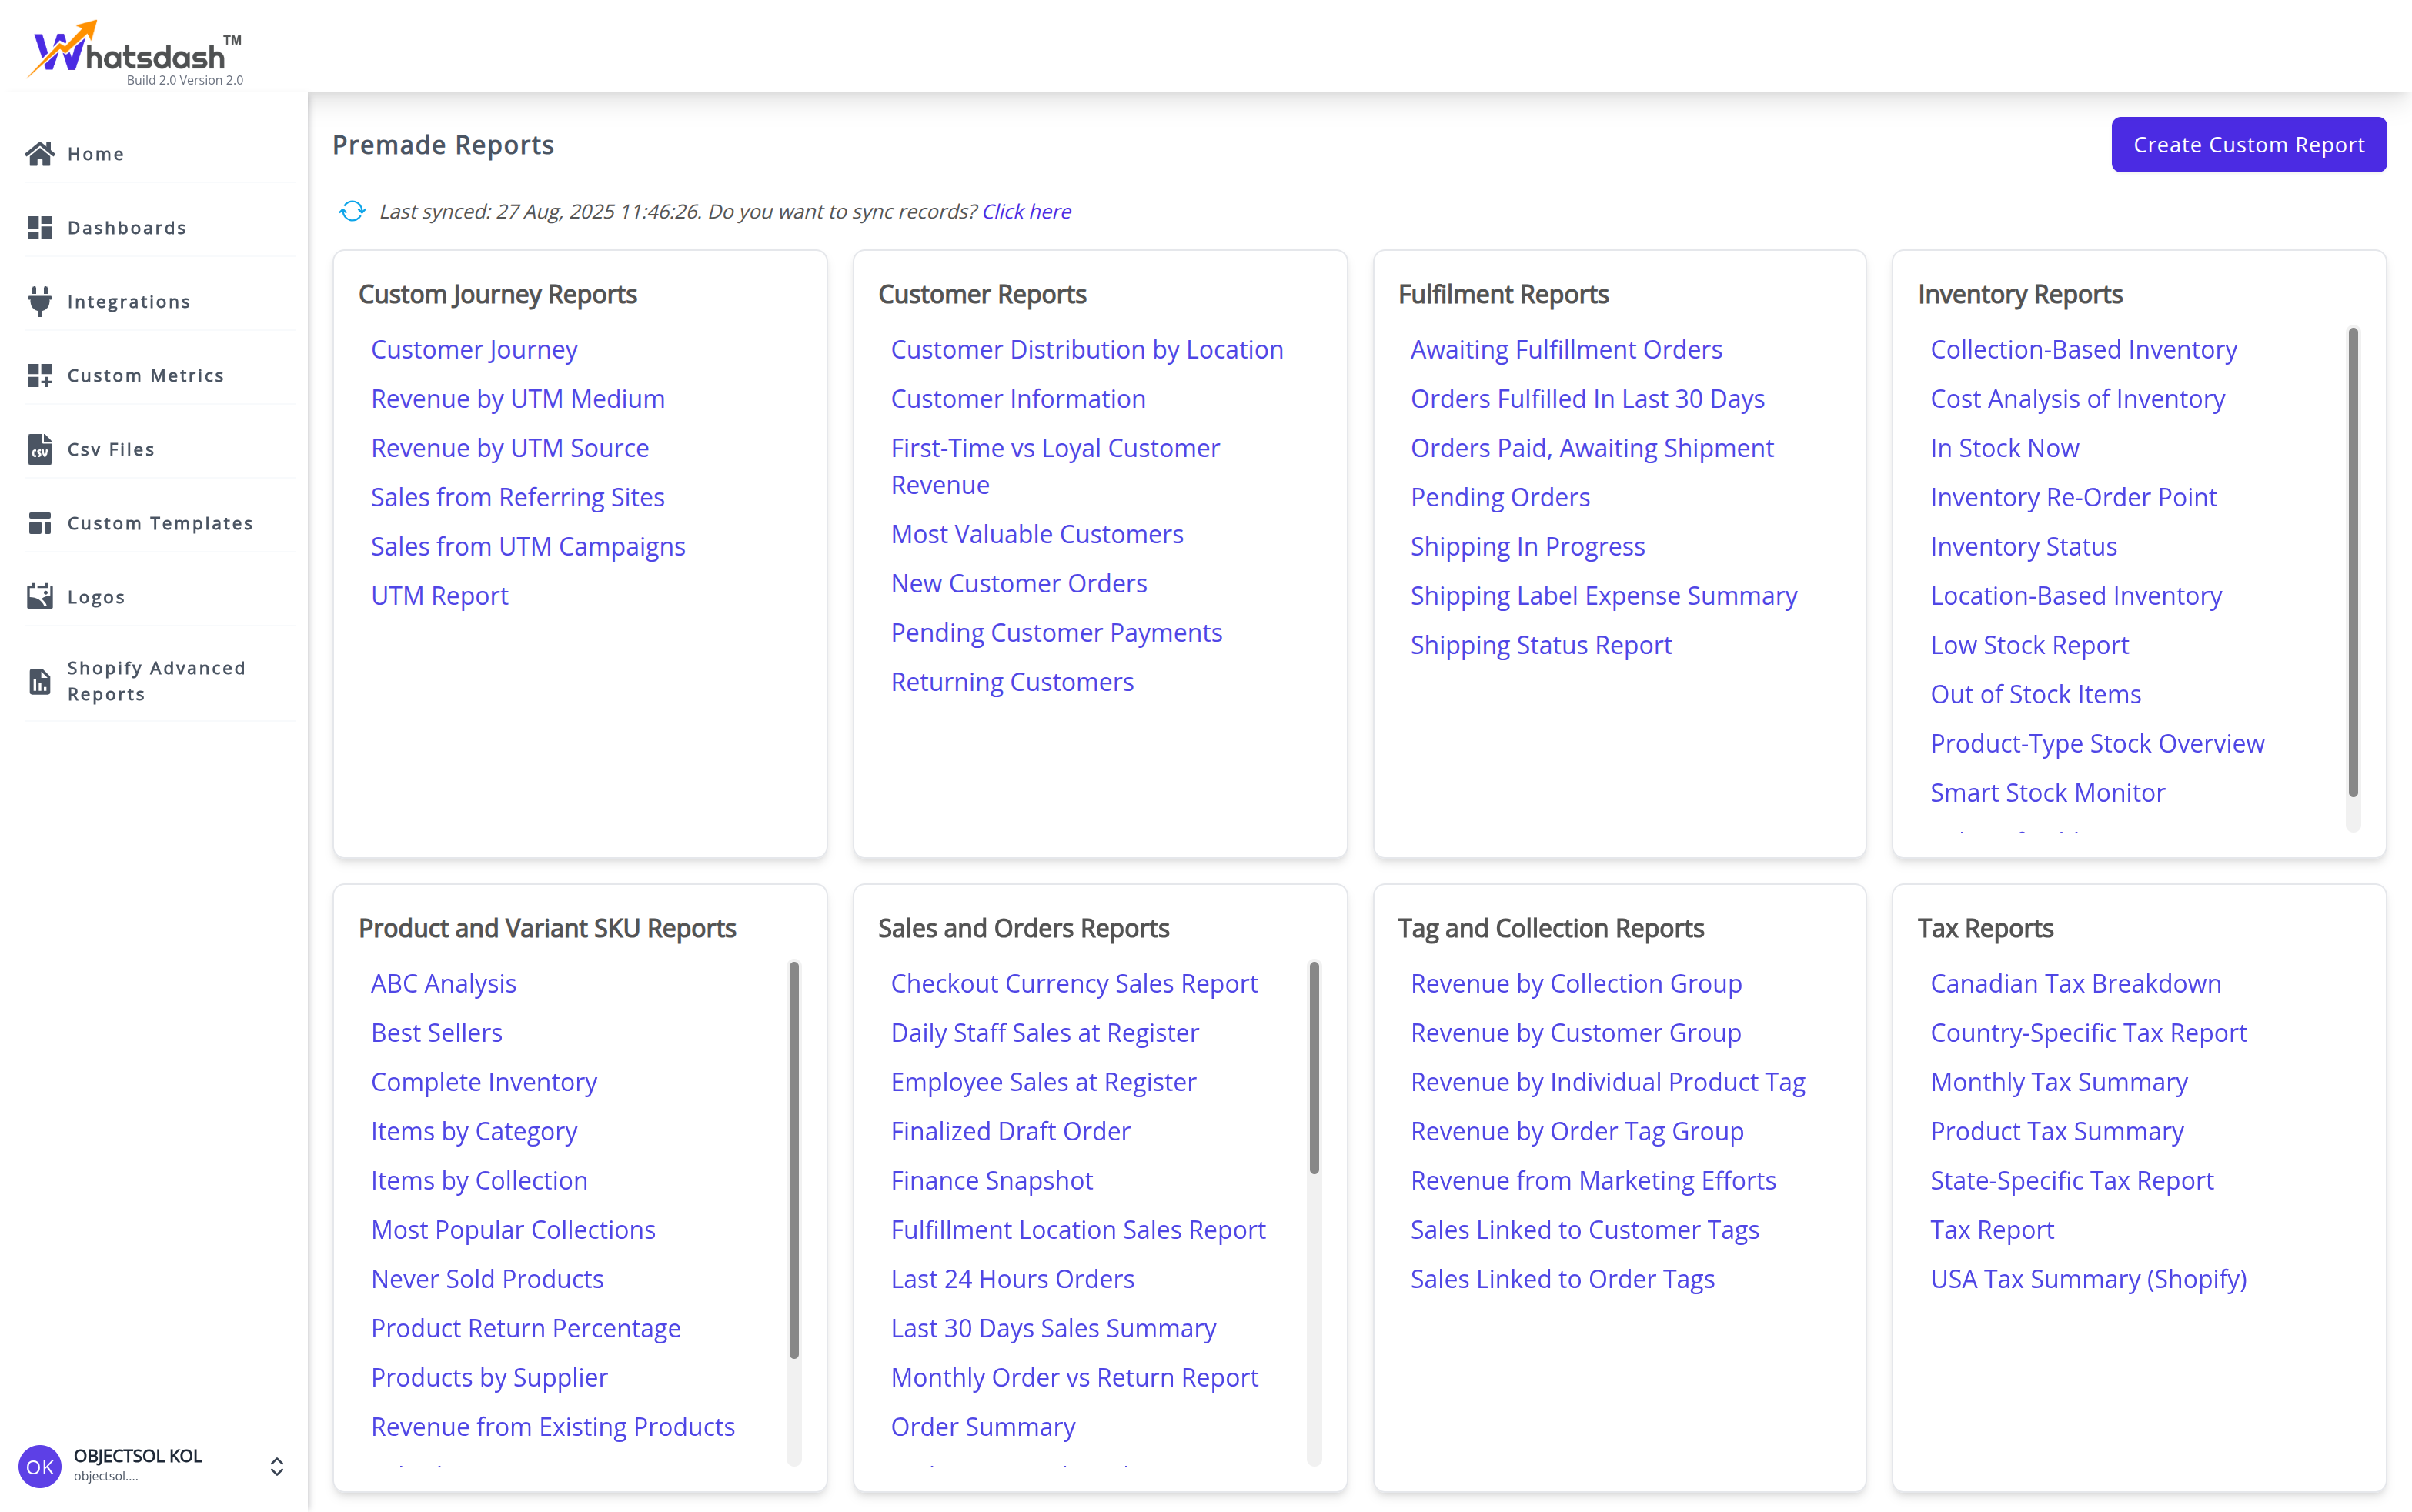
💚 Why You’ll Love Our Prebuilt Reports
- Instant Access — Connect with Shopify login and start reporting in minutes.
- Sales & Revenue — Track top products, seasonal trends, and channel performance.
- Inventory Management — Keep tabs on stock levels, restock needs, and slow-moving products.
- Customer Insights — Understand buyer behavior, repeat purchase rates, and lifetime value.
- Export with One Click — Download any report in Excel or CSV format instantly.
With Whatsdash, you can customize any prebuilt report to match your exact business needs — all without spreadsheets or manual updates.
🧩 Explore Our Prebuilt Report Categories
- 💰 Sales and Orders Reports
Track overall sales performance with detailed Shopify order data.
Analyze revenue trends, seasonal spikes, and order volumes to understand what drives growth.
- 🚚 Fulfillment Reports Measure fulfillment efficiency by monitoring shipping timelines, delivery performance, and processing delays to ensure a smooth customer experience.

- 📦 Product and Variant SKU Reports
Drill down into product-level performance.
Identify best-sellers, slow-moving SKUs, and uncover opportunities for targeted promotions or pricing adjustments.
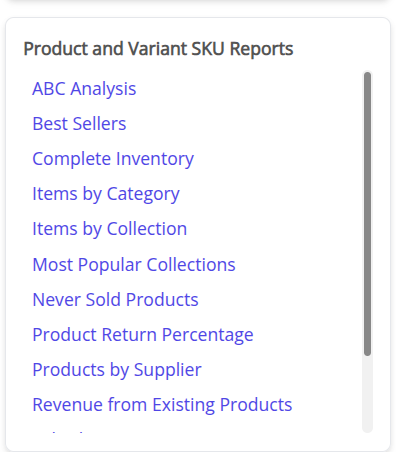
- 👣 Customer Journey Reports
Visualize the entire buyer path — from the first visit to checkout.
Identify conversion bottlenecks and optimize the journey for higher sales.

- 👥 Customer Reports
Understand your audience with detailed insights into customer lifetime value, purchase frequency, and buying behavior.
Use this data to improve retention and targeting.

- 🏬 Inventory Reports
Keep track of real-time stock levels across your Shopify store.
Avoid stockouts, manage restocks proactively, and optimize your inventory turnover rate.

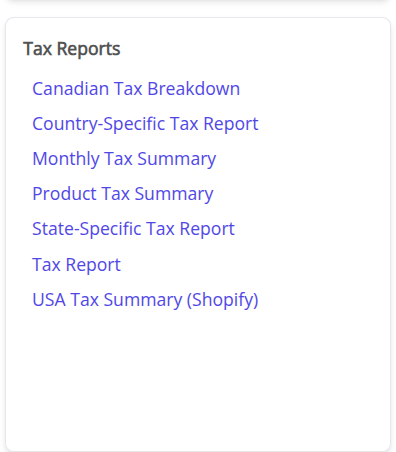
- 🏷️ Tag and Collection Reports
Evaluate how your product tags and collections perform.
See which groupings drive engagement and conversions to fine-tune your merchandising strategy.
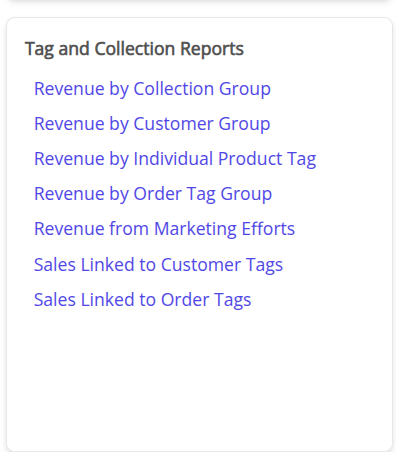
🪄 How to Generate a Report from Preset Templates
Let’s use Inventory Reports as an example:
-
Navigate to the Inventory Reports tab in the Preset Reports library.
-
Select Collection-Based Inventory from the list of available templates.
-
The report will automatically load — give it a few moments to process your Shopify data.
-
Once generated, click Save to store it under Reports.
-
Your saved reports will always be accessible in the Reports section from the navigation panel.
🗂️ Filters
🔎 Where Can I Find the Filters?
In Whatsdash, all filtering options are available in one central place — the Filters panel.
You can use this panel to refine your reports based on specific data conditions such as Contains, Not Contains, Is, Is Not, Greater Than, Lesser Than, and more.
⚙️ Filters Panel Overview
Filters Panel
All filtering options are located in the Filters panel of the reports.

To open the Filters panel, simply:
-
Go to any report in your workspace.
-
Click on the Filters icon located in the top-right of your report toolbar.

-
Choose the filter type you want (e.g., Contains, Is Not, Greater Than).
-
Apply the filter to instantly narrow down your report data.
📖 Table of Contents
### 🔍 Contains and Not Contains
Filter data that contains or does not contain specific text values.
Include or exclude exact matches for your chosen field.
Add or remove specific data groups to refine your report results.
### 🚫 Is Blank and Is Not Blank
Identify missing or populated fields in your dataset.
### 🏁 Begins With and Not Begins With
Filter records based on how values start.
### 🔚 Ends With and Not Ends With
Filter records based on how values end.
💡 Pro Tip
Use multiple filters together to create layered conditions — for example, filter by Product Type Contains “Shirt” and Inventory Greater Than 10
to instantly find best-selling items in stock.
🔍 'Contains' & 'Not Contains' Filters
Easily include or exclude records in your reports with these two powerful filter types.
✨ Contains Filter
Use the 'Contains' filter in Reports when you want to view only the records or fields that include a specific word or phrase.
Example:
Your store sells a wide range of apparel — Nike T-shirts, Adidas sneakers, Puma hoodies, Levi’s jeans, H&M jackets, Zara shirts, Uniqlo trousers, and more.
If you want to filter products that contain the word "NIKE", simply apply the Contains filter for NIKE.
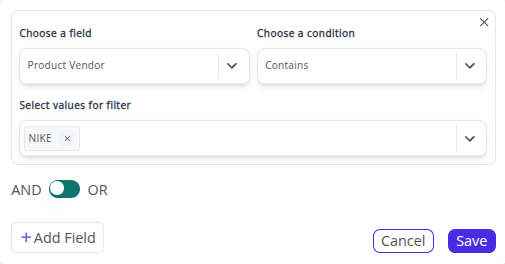
The report will now only show NIKE products such as NIKE SWOOSH PRO FLAT PEAK CAP, NIKE CRACKLE PRINT TEE, and NIKE RUNNING SHOES — all of which have the word “NIKE” in their name.
🚫 Not Contains Filter
Use the 'Not Contains' filter in Reports when you want to exclude any record or field that contains a specific word or phrase.
Example:
Your store sells a wide range of apparel — Nike T-shirts, Adidas sneakers, Puma hoodies, Levi’s jeans, H&M jackets, Zara shirts, Uniqlo trousers, and more.
If you apply the Not Contains filter for “NIKE”, your report will exclude all NIKE products and instead display non-NIKE items such as Adidas Ultraboost Sneakers, Puma Sport Hoodie, Levi’s 511 Slim Jeans, Zara Cotton Shirt, and H&M Denim Jacket.
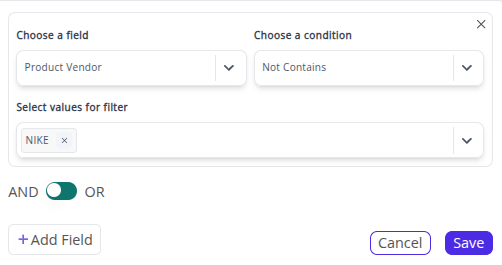
The Not Contains filter helps you instantly narrow your data by excluding specific keywords — perfect for focusing on other brands, collections, or product types without manual sorting.
💡 Tip: You can add multiple filter values with the Contains and Not Contains conditions to refine your reports even further.
➡️ Next Filter: ⚖️ Is & Is Not Filters
🔎 'Is' & 'Is Not' Filters
Easily refine your reports by including or excluding records that exactly match a specific value or parameter.
✅ Is Filter
The 'Is' filter in Reports retrieves results that exactly match the parameter you specify.
Example:
If you apply the 'Is' filter to the Brand field with the parameter "NIKE", the report will display only NIKE products — such as NIKE Air Zoom Pegasus, NIKE Sports Jacket, and NIKE Dri-FIT T-shirt.

🚫 Is Not Filter
The 'Is Not' filter in Reports excludes results that match the specified parameter.
Example:
If you apply the 'Is Not' filter to the Brand field with the parameter "NIKE", the report will exclude all NIKE products and display only non-NIKE items such as Adidas Ultraboost Sneakers, Puma Classic Hoodie, Levi’s Denim Jacket, and Zara Cotton Shirt.
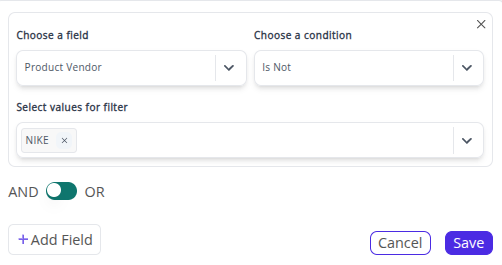
💡 Tip: You can combine 'Is' and 'Is Not' filters across multiple fields (e.g., Brand, Product Type, Order Status) to fine-tune your reports and extract exactly the insights you need.
➡️ Next Filter: 🧩 Include & Exclude Filters
🧩 'Include' and 'Exclude' Filters
✅ Include Filter
The Include filter in Report allows you to add multiple filter conditions to focus only on specific products, brands, or data segments in your report.
🧠 Example
Your store sells a variety of brands — NIKE, Adidas, Puma, Zara, and H&M.
If you want to focus only on NIKE and Adidas products, apply the Include filter with the conditions “NIKE” and “Adidas”.
The report will then display only NIKE and Adidas products, such as:
- NIKE Air Max Sneakers
- NIKE Dri-FIT Sports Tee
- Adidas Ultraboost Shoes
- Adidas Originals Hoodie
All other brands (Puma, Zara, H&M) will be hidden from the results.

💡 The Include filter is ideal for narrowing large datasets — helping you focus on specific brands, products, or categories that matter most to your business.
🚫 Exclude Filter
The Exclude filter in Reports is used to remove specific filter conditions from your report results, so you can analyze everything except certain products or brands.
🧠 Example
Using the same store, if you want to exclude all NIKE and Adidas products, apply the Exclude filter with the conditions “NIKE” and “Adidas”.
The report will then remove NIKE and Adidas items and show only other brands like:
- Puma Classic Hoodie
- Zara Cotton Shirt
- H&M Denim Jacket
- Levi’s 511 Slim Jeans

💡 The Exclude filter helps keep your reports clean and focused by removing irrelevant or unwanted data — perfect for clearer brand, product, or performance comparisons.
➡️ Next Filter: 🚫 Is Blank & Is Not Blank Filters
🧾 'Is Blank' and 'Is Not Blank' Filters
⚪ Is Blank Filter
The Is Blank filter condition in Reports is used to find records where a specific field is empty or has no value.
Example:
Your store lists multiple apparel products from brands like NIKE, Adidas, Puma, and Zara.
If you want to identify products missing a brand name, apply the Is Blank filter to the Brand field.
This will show only those products where the Brand field is empty — for example, items that were added to your store without assigning a brand.
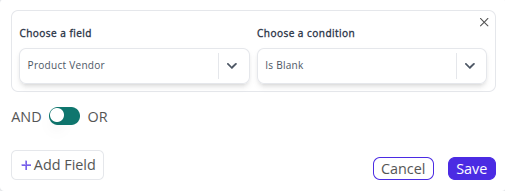
💡 The Is Blank filter is ideal for identifying incomplete product data, such as missing brand, SKU, or vendor details — helping you maintain data accuracy in your reports.
⚫ Is Not Blank Filter
The Is Not Blank filter condition in Reports is used to find records where a specific field has data filled in.
Example:
Continuing with the same store, if you want to view only products that have a brand assigned, apply the Is Not Blank filter to the Brand field.
The report will now show only products with a valid brand name, such as NIKE Air Zoom Pegasus, Adidas Ultraboost, and Puma Classic Hoodie — effectively excluding any unbranded items.
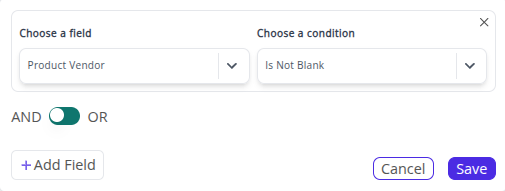
💡 The Is Not Blank filter ensures your analytics focus on complete, usable data — perfect for reports that rely on product, customer, or vendor information.
➡️ Next Filter: 🏁 Begins With & Not Begins With Filters
🏁 'Begins With' and 'Not Begins With' Filters
🔤 Begins With Filter in Whatsdash
The Begins With filter in Reports helps you find records that start with a specific prefix.
Example:
Suppose your store sells products such as NIKE Air Zoom Shoes, NIKE Running Shorts, Adidas Ultraboost, and Puma Hoodie.
If you apply the Begins With filter with the value “NIKE”, your report will display only the products that start with “NIKE” — such as:
- NIKE Air Zoom Shoes
- NIKE Running Shorts
- NIKE Sports Jacket
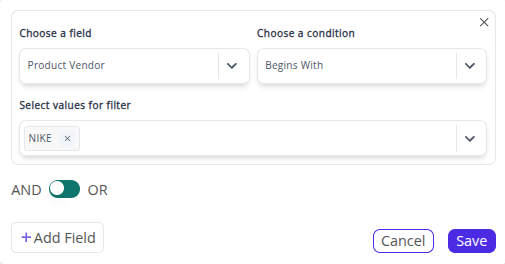
💡 Use the Begins With filter when you need to focus on items that share the same prefix — such as brand names, product categories, or SKU patterns.
🚫 Not Begins With Filter in Whatsdash
The Not Begins With filter in Reports helps you exclude records that start with a specific prefix, showing all other data instead.
Example:
Using the same dataset, if you apply the Not Begins With filter with the value “NIKE”, your report will exclude all NIKE products and instead display other brands, such as:
- Adidas Ultraboost
- Puma Hoodie
- Reebok Training Tee

💡 The Not Begins With filter is ideal for excluding a specific brand, prefix, or series when you want to analyze the rest of your product data.
➡️ Next Filter: 🔚 Ends With & Not Ends With Filters
🔚 'Ends With' and 'Not Ends With' Filters
🔤 Ends With Filter in Whatsdash
The Ends With filter in Reports helps you find records that end with a specific suffix.
Example:
Suppose your product list includes items like Running Shorts XL, Training Pants XL, NIKE Hoodie L, and Puma Jacket M.
If you apply the Ends With filter with the value “XL”, your report will show only the products that end with “XL” — such as:
- Running Shorts XL
- Training Pants XL
- NIKE Sports Tee XL
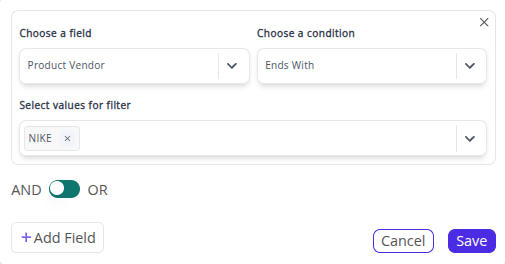
💡 Use the Ends With filter when you want to find products or SKUs ending with specific size codes, batch numbers, or suffix patterns.
🚫 Not Ends With Filter in Whatsdash
The Not Ends With filter in Report helps you exclude records that end with a specific suffix, showing all other results.
Example:
Using the same dataset, if you apply the Not Ends With filter with the value “XL”, your report will exclude all products ending with “XL” and display items like:
- NIKE Hoodie L
- Puma Jacket M
- Adidas Track Pants S

💡 The Not Ends With filter is ideal when you want to remove specific variants or suffixes from your analysis — such as excluding certain sizes, series, or model numbers.
📊 Sorting Data in Reports with Whatsdash
The Sort feature in Reports helps you organize your report data in the order you prefer, making it easier to analyze and gain deeper insights from your Shopify store or other business data.
⬆️ Sort by Ascending
You can sort any field in ascending order, arranging values from the smallest to the largest, or in alphabetical order from A to Z.
Example:
Sorting by Variant Title will display the variants in alphabetical order — such as "3 / white", "4 / beige", "4 / black", followed by "5 / red" and "OS / white".
Additionally, you can control how many rows appear per page, with options like Top 10, 25, 50, or 100.
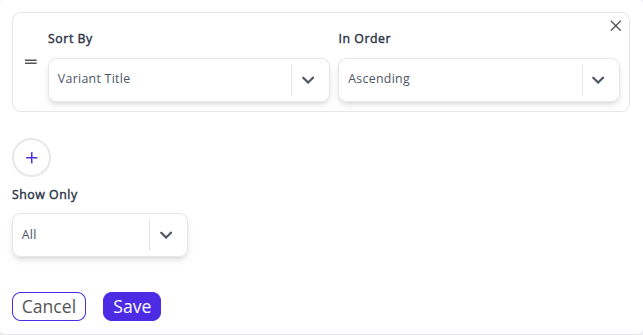
💡 The Sort by Ascending option helps you quickly identify the earliest variants, lowest prices, or smallest quantities in your Whatsdash reports.
⬇️ Sort by Descending
The Descending sort option allows you to arrange data starting from the highest value down to the lowest.
For text-based fields, it sorts items in reverse alphabetical order (Z to A).
Example:
Sorting by Product Price in descending order will show your most expensive products first, such as
"DR MARTENS | 1461 DMC 3-EYE SHOE | BLACK SMOOTH" or "ADIDAS | SUPERSTAR 80S",
followed by lower-priced products like "FLEX FIT | MINI OTTOMAN BLACK".
You can also control how many rows appear per page — Top 10, 25, 50, 100, or view all.
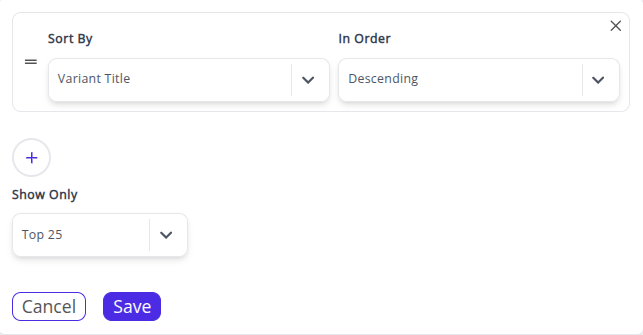
💡 The Sort by Descending option is ideal for quickly spotting top-priced products, best-selling items, or highest metrics in your Whatsdash reports.
🔄 Multi-Sorting
With Multi-Sort, you can sort multiple fields simultaneously — each in ascending or descending order.
This allows you to create more meaningful, layered data views for deeper insights.
Example:
You can first sort Product Vendor in ascending order (A–Z) to group all ADIDAS, CONVERSE, NIKE, and VANS products together,
then sort Inventory Quantity in descending order within each group — showing the highest-stocked items first for each brand.
You can also limit the displayed rows per page to the Top 10, 25, 50, 100, or show all results at once.

💡 The Multi-Sort feature in Whatsdash helps you build complex, insightful report views —
such as seeing your products organized by brand and ranked by availability or performance.
📤 Export Reports
You can easily export your reports from Whatsdash to Excel (XLSX) or CSV for convenient access and sharing. Follow the steps below to ensure a smooth export process.
📘 Export to Excel (XLSX)
Whatsdash allows direct export of reports in XLSX (Excel) format.
Steps to Export:
- Open the desired report in Whatsdash.
- Click the Export dropdown menu on the export widget.
- Select Excel / XLSX as the export format.
- The report will automatically download to your default folder.
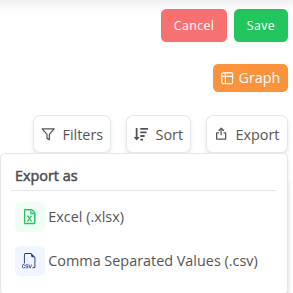
📄 Export to CSV
Whatsdash also lets you export reports as CSV files.
Steps to Export:
-
Open the desired report in Whatsdash.
-
Click the Export dropdown menu on the export widget.
-
Select CSV as the export format.
-
The report will automatically download to your default folder.