Google Analytics 4
Google Analytics 4 allows you to integrate user and event data directly into Whatsdash for advanced reporting and analysis alongside other business metrics.
Why Connect GA4 to Whatsdash?
Integrate your GA4 data with Whatsdash to transforms raw website and app data into clear, actionable business insights for all users, regardless of their technical skill level.
- Simplified Reporting & Dashboards : Get instant, visual reports using pre-built templates without having to navigate GA4's complex exploration tools.
- Custom Metrics & Granular Control : Go beyond the standard GA4 reports by creating Custom Metrics and visualizations based on the event-driven data model, giving you precise control over how complex user behavior is measured and presented.
- Data Blending & Cross-Channel Analysis : Blend granular GA4 event data with sales, CRM, and ad spend data from other sources.
📋 Steps to Integrate your Google Analytics 4 account to Whatsdash
✔️ Navigate to the 'Integrations' page using the navigation bar at the top.
✔️ Select Google Analytics 4 from the list of Available Integrations.
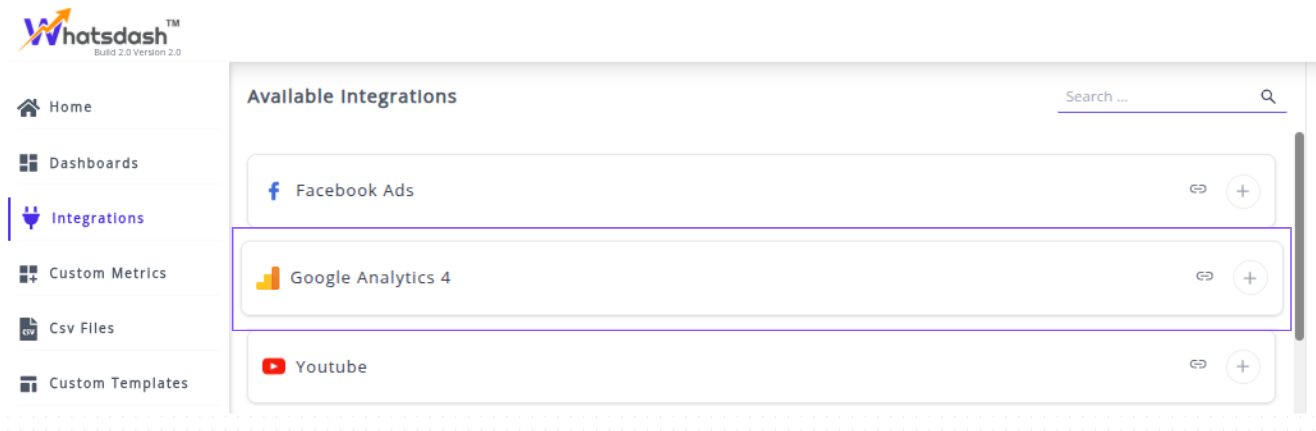
✔️ Click + button to open the Facebook authorization window.

✔️ You will be redirected to a Google sign-in page. Select the Google account that has access to your GA4 property.
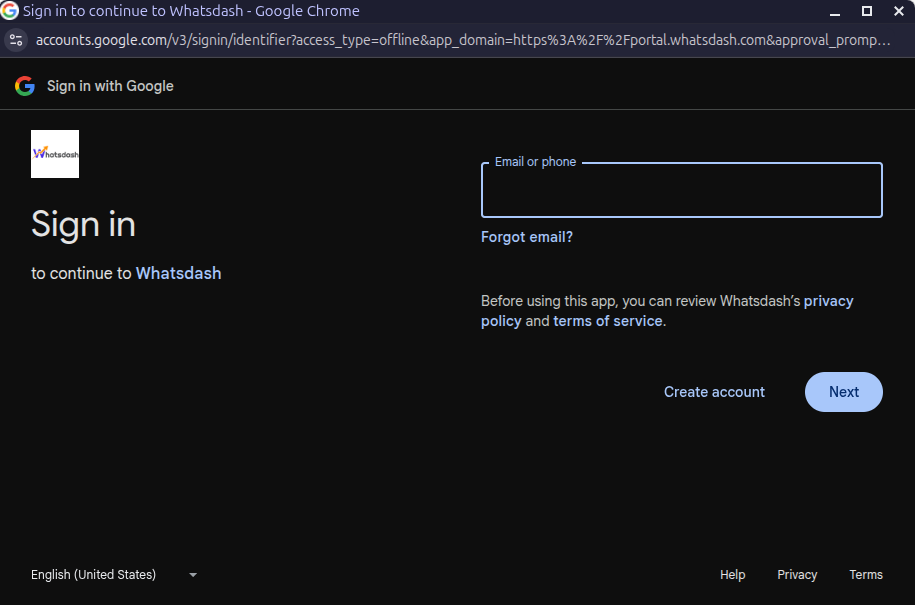
✔️ Grant Whatsdash the necessary permissions to Read your Google Analytics data.
✔️ Once authenticated, you will be directed back to Whatsdash. Your Google Analytics Integration will appear in the Connected Integrations list.

✔️ You can now create or customize dashboards using your Google Analytics (GA4) metrics and Dimensions.
👉 How to visualize this data in your dashboard, visit the Dashboard Documentation Guide
🔗 Google Analytics 4 Metrics
Below is a comprehensive list of GA4 metrics, categorized by purpose.
You can use this as a reference when building dashboards, mapping API fields, or explaining metric meanings.
| Name | Category | Why It's Useful |
|---|---|---|
| Add-to-carts | Ecommerce | Tracks early purchase intent and interest in products. |
| Advertiser Ads Cost Per Click | Advertising | Helps optimize ad spend efficiency per click. |
| Average purchase revenue per user | Revenue | Measures revenue contribution per active user. |
| Bounce rate | Session | Identifies sessions with low engagement for UX improvements. |
| Cost per purchase | Conversions | Evaluates cost-effectiveness of driving purchases. |
| Engaged sessions | Session | Tracks sessions with meaningful engagement. |
| Engaged sessions per user | Acquisition | Measures engagement depth per user. |
| Item list clicks | Ecommerce | Shows interest in products from listings. |
| Items purchased | Ecommerce | Tracks product sales volume. |
| Item promotion views | Ecommerce | Monitors exposure of promoted products. |
| Purchase-to-view rate | Ecommerce | Measures conversion efficiency from product views. |
| Session conversion rate | Acquisition | Indicates conversion likelihood per session. |
| Shipping amount | Ecommerce | Useful for revenue tracking from shipping. |
| Total revenue | Revenue | Measures total earnings across all sources. |
| Active users | User | Counts distinct users visiting site/app. |
| Margin | Advertising | Evaluates profitability after ad costs. |
| Average purchase revenue | Revenue | Tracks average transaction value. |
| Cart-to-view rate | Ecommerce | Measures conversion from product views to cart additions. |
| First-time purchasers per new user | User | Tracks new user conversion into buyers. |
| Views | Page / screen | Monitors content consumption per user. |
| Scrolled Users | User | Measures content engagement depth. |
| Transactions | Ecommerce | Tracks completed purchases. |
| Transactions per purchaser | Ecommerce | Measures purchase frequency per buyer. |
| Cost Per Conversion | Advertising | Evaluates cost efficiency for driving conversions. |
| Average session duration | User | Measures average engagement time per session. |
| Checkouts | Ecommerce | Tracks number of checkout initiations. |
| Conversions | Event | Counts conversion events triggered. |
| Purchase | Conversions | Measures number of purchase conversions. |
| E-commerce purchases | Ecommerce | Tracks completed e-commerce transactions. |
| Engagement rate | Session | Indicates percentage of engaged sessions. |
| Event count per user | Event | Measures average event interactions per user. |
| Event value | Event | Tracks total value attributed to events. |
| First-time purchaser conversion % | User | Percentage of new users making first purchase. |
| First-time purchasers | User | Counts users completing first purchase. |
| Item views | Ecommerce | Tracks number of times product details are viewed. |
| Item promotion clicks | Ecommerce | Measures interaction with promoted items. |
| Views per session | Page / screen | Shows average pages/screens viewed per session. |
| Sessions | Session | Tracks total sessions initiated. |
| Sessions per user | Acquisition | Measures average sessions per user. |
| User conversion rate | Acquisition | Percentage of users triggering any conversion. |
| Advertiser Ads Clicks | Advertising | Tracks total ad clicks. |
| Advertiser Ads Cost | Advertising | Measures total spend on ads. |
| Advertiser Ads Impressions | Advertising | Shows total ad impressions delivered. |
| CTR (%) | Advertising | Indicates ad effectiveness in generating clicks. |
| Average engagement time per session | User | Tracks time spent actively engaging per session. |
| Event count | Event | Total number of events triggered. |
| Events per session | Event | Average events per session for interaction analysis. |
| Item list views | Ecommerce | Shows product discovery via item lists. |
| Item revenue | Ecommerce | Measures revenue generated from individual items. |
| New users | User | Counts first-time users for growth tracking. |
| % New Users | User | Tracks proportion of new users. |
| Purchase revenue | Ecommerce | Total revenue from purchases. |
| Purchaser conversion % | User | Percentage of users who completed one or more purchases. |
| Return On Ad Spend ($) | Advertising | Measures ad spend profitability. |
| Tax amount | Ecommerce | Tracks taxes associated with transactions. |
| Total purchasers | User | Counts users who completed purchases. |
| Total users | User | Counts all unique active users. |
| User engagement duration | User | Measures total active engagement time on site/app. |
🔗 Google Analytics 4 Dimensions
Below is a comprehensive list of GA4 dimensions used in reporting, along with their categories and why they are useful for analysis.
| Name | Category | Why It's Useful |
|---|---|---|
| Interest | Ecommerce | Helps understand users’ preferences and shopping funnel segments. |
| Day of week | Time | Useful for identifying patterns by day for engagement or conversion. |
| First user source / medium | Traffic source | Tracks acquisition channels for new users. |
| Google Ads Keyword text | Google Ads | Measures keyword performance for conversion events. |
| Hour | Time | Useful to analyze time-of-day activity and peak usage hours. |
| Item category | Ecommerce | Organizes products for detailed reporting and analysis. |
| Item category 2 | Ecommerce | Provides second-level classification for product analysis. |
| Item category 3 | Ecommerce | Provides third-level classification for product analysis. |
| Item category 4 | Ecommerce | Provides fourth-level classification for product analysis. |
| Item category 5 | Ecommerce | Provides fifth-level classification for product analysis. |
| Session campaign | Traffic source | Tracks which campaign initiated the user session. |
| Continent | Geography | Useful for regional segmentation of users. |
| City | Geography | Helps analyze user activity at a city level. |
| Region | Geography | Tracks activity at regional level for reporting. |
| Country | Geography | Provides country-level analytics for user activity. |
| First user Google Ads account name | Google Ads | Tracks which Google Ads account first acquired the user. |
| Google Ads ad group name | Google Ads | Useful for ad group-level performance analysis. |
| First user Google Ads ad group name | Google Ads | Measures initial acquisition performance by ad group. |
| First user Google Ads campaign | Google Ads | Tracks which Google Ads campaign acquired the user. |
| First user Google Ads campaign type | Google Ads | Helps analyze campaign type effectiveness in acquiring users. |
| Session Google Ads campaign type | Google Ads | Tracks campaign type driving sessions. |
| Campaign | Attribution | Measures which marketing campaign drove conversions. |
| Campaign ID | Google Ads | Useful for identifying specific campaigns in reporting. |
| Default channel grouping | Attribution | Helps group conversions by default marketing channel. |
| First user default channel grouping | Traffic source | Tracks acquisition channel for new users. |
| Source / medium | Attribution | Provides detailed channel-level attribution. |
| Source | Attribution | Helps analyze where conversions originated from. |
| Source platform | Attribution | Measures the platform responsible for the conversion. |
| Session source platform | Traffic source | Tracks platform that initiated a session. |
| First user source platform | Traffic source | Tracks platform responsible for first user acquisition. |
| First user source | Traffic source | Identifies the initial acquisition source. |
| Session source | Traffic source | Tracks the source that initiated a session. |
| Session medium | Traffic source | Identifies medium initiating a session (e.g., email, social). |
| First user medium | Traffic source | Identifies acquisition medium for new users. |
| Google Ads customer ID | Google Ads | Unique identifier for Google Ads accounts for attribution. |
| Google Ads ad network type | Google Ads | Tracks which ad network led to conversion. |
| Session Google Ads ad network type | Google Ads | Identifies network driving the session. |
| Google Ads query | Google Ads | Tracks keyword that led to conversion. |
| First user Google Ads query | Google Ads | Measures initial search query acquiring the user. |
| Session Google Ads query | Google Ads | Tracks keyword that drove a session. |
| Full page URL | Page / screen | Analyzes specific pages visited by users. |
| Page location | Page / screen | Helps track exact URL of user activity. |
| Page path + query string | Page / screen | Useful for understanding the user journey. |
| Page path and screen class | Page / screen | Helps analyze specific screens or pages in apps/web. |
| Page path without query string | Page / screen | Simplifies URL reporting by removing query parameters. |
| Page title | Page / screen | Tracks content titles for reporting. |
| Page title and screen class | Page / screen | Analyzes pages or screens by their titles/classes. |
| Page title and screen name | Page / screen | Useful to identify content consumed by users. |
| Landing page | Page / screen | Identifies the entry page for sessions. |
| Content group | Page / screen | Organizes content for grouped reporting. |
| Content type | Page / screen | Categorizes content for analytics purposes. |
| Video URL | Video | Tracks the source URL for video engagement. |
| Video title | Video | Measures video-level engagement by title. |
| Video provider | Video | Identifies the video platform for tracking performance. |
| Device | Platform / device | Tracks user device type for segmentation. |
| Device category | Platform / device | Helps separate Desktop, Mobile, or Tablet users. |
| Device brand | Platform / device | Measures engagement by device manufacturer. |
| Device model | Platform / device | Useful for understanding device-specific behavior. |
| Mobile model | Platform / device | Tracks specific mobile device models. |
| Operating system | Platform / device | Segments users by OS for compatibility analysis. |
| OS version | Platform / device | Useful for analyzing activity by OS version. |
| Operating system with version | Platform / device | Provides detailed OS version analytics. |
| Screen resolution | Platform / device | Helps design UX/UI for the most common screen sizes. |
| Platform | Platform / device | Measures which platform users are on (web, iOS, Android). |
| Stream name | Platform / device | Identifies data stream for tracking website/app. |
| Stream ID | Platform / device | Numeric identifier for website/app data stream. |
| Language | Platform / device | Tracks user language preference for localization. |
| Browser | Platform / device | Measures which browsers users are using. |
| Hour | Time | Helps analyze activity by hour of the day. |
| Day of week | Time | Tracks day-level engagement patterns. |
| Week | Time | Tracks week-level user activity trends. |
| Month | Time | Analyzes monthly trends. |
| Year | Time | Tracks annual trends. |
| Date | Time | Exact date for time-specific reporting. |
| Age | Demographics | Segments users by age brackets. |
| Gender | Demographics | Segments users by gender. |
| New / established | User | Differentiates new vs. returning users. |
| Session manual ad content | Session | Tracks ad content leading to sessions for analysis. |
| Session manual term | Session | Identifies search term that led to a session. |
| Method | General | Tracks how events were triggered. |
| Percent scrolled | General | Measures user engagement with content. |
| File extension | General | Useful to track file download types. |
| File name | General | Identifies downloaded file paths. |
| Property Name | General | Helps distinguish analytics properties. |
| Event name | Event | Identifies user actions for analysis. |
| Is conversion event | Event | Tracks whether the event counts as a conversion. |
| Link URL | Link | Monitors outbound link clicks for tracking. |
| Link text | Link | Tracks link text clicked by users. |
| Link domain | Link | Measures domain-level outbound link activity. |
| Link classes | Link | Useful for tracking link-specific CSS classes. |
| Link ID | Link | Tracks ID of outbound links or downloads. |
| Outbound | Custom | Identifies outbound links for tracking external traffic. |
| Item ID | Ecommerce | Tracks unique product identifiers. |
| Item name | Ecommerce | Monitors specific product activity. |
| Item affiliation | Ecommerce | Tracks affiliate or vendor for transactions. |
| Item variant | Ecommerce | Measures product variations for analysis. |
| Item brand | Ecommerce | Tracks performance by brand. |
| Item list name | Ecommerce | Organizes products in lists for discovery tracking. |
| Item list views | Ecommerce | Monitors product discovery in lists. |
| Item list clicks | Ecommerce | Tracks engagement with item lists. |
| Item revenue | Ecommerce | Measures revenue generated by specific items. |
| Item promotion name | Ecommerce | Tracks specific promotions driving engagement. |
| Item promotion views | Ecommerce | Monitors visibility of item promotions. |
| Item promotion clicks | Ecommerce | Measures interaction with promotions. |
| Transaction ID | Ecommerce | Tracks individual purchase transactions. |
| Order coupon | Ecommerce | Monitors coupon usage for promotions. |
| Shipping tier | Ecommerce | Tracks shipping selection for orders. |
💡 Tip : Connecting your Google Analytics 4 (GA4) property allows you to track website and app performance in one centralized dashboard. You can monitor user behavior, conversions, and content engagement across multiple streams in Whatsdash.
🔗 Explore More Integrations
Whatsdash supports a wide range of marketing, analytics, and eCommerce integrations to give you a holistic view of your business performance.
👉 Visit the Integrations Page to explore all available connections