Custom Metrics
Custom Metrics are user-defined measures that allow you to track and analyze unique performance indicators that are not covered by the standard, pre-defined metrics provided by your integrated data sources.
What are Custom Metrics?
A Custom Metric is essentially a formula you define by combining multiple standard metrics (from one or more integrations) using mathematical operators and constants. They empower you to create tailored calculations directly relevant to your specific business goals, offering a granular level of insight for data-driven decisions.
-
Tailored KPIs: Create metrics that perfectly align with your unique business model .
-
Cross-Channel Aggregation: Combine metrics from different integrations (e.g., total ad spend by adding Facebook Ads and Google Ads spend) to generate a newer metric.
-
Consistent Reporting: Apply a single, standardized definition for a critical KPI across all your client reports.
How to Create a Custom Metric
Custom Metrics are typically created and managed from a centralized area in the Whatsdash platform.
-
Step 1: Navigate to Custom Metrics Menu
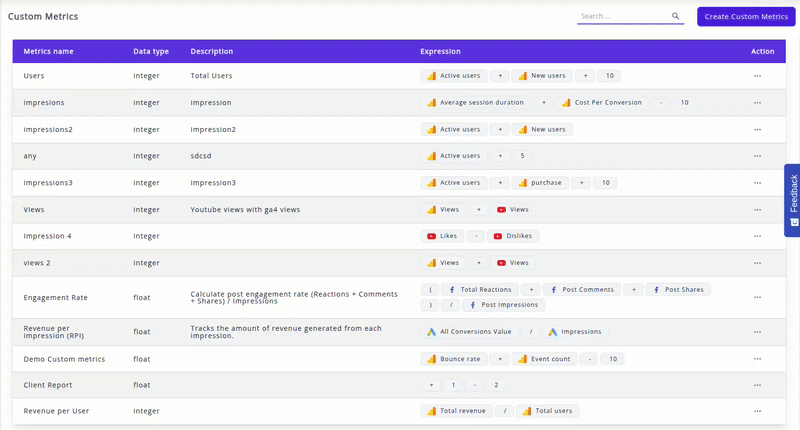
1.Click the "Custom Templates" menu item in the navigation bar. A table listing all existing custom metrics will be displayed.The table consists of the integrations and the metrics that are used in the creation of custom metrics.
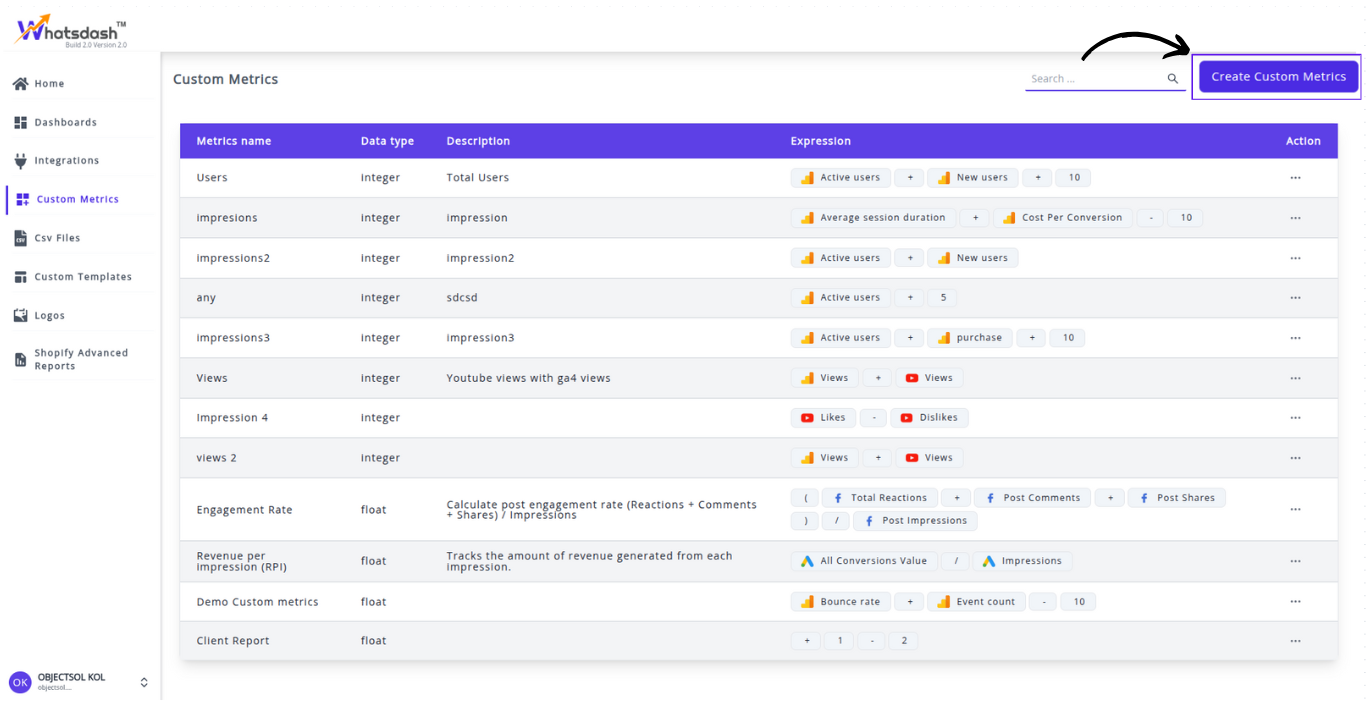
2.Click the 'Create Custom Metrics' button.
3.Define Metric Details:
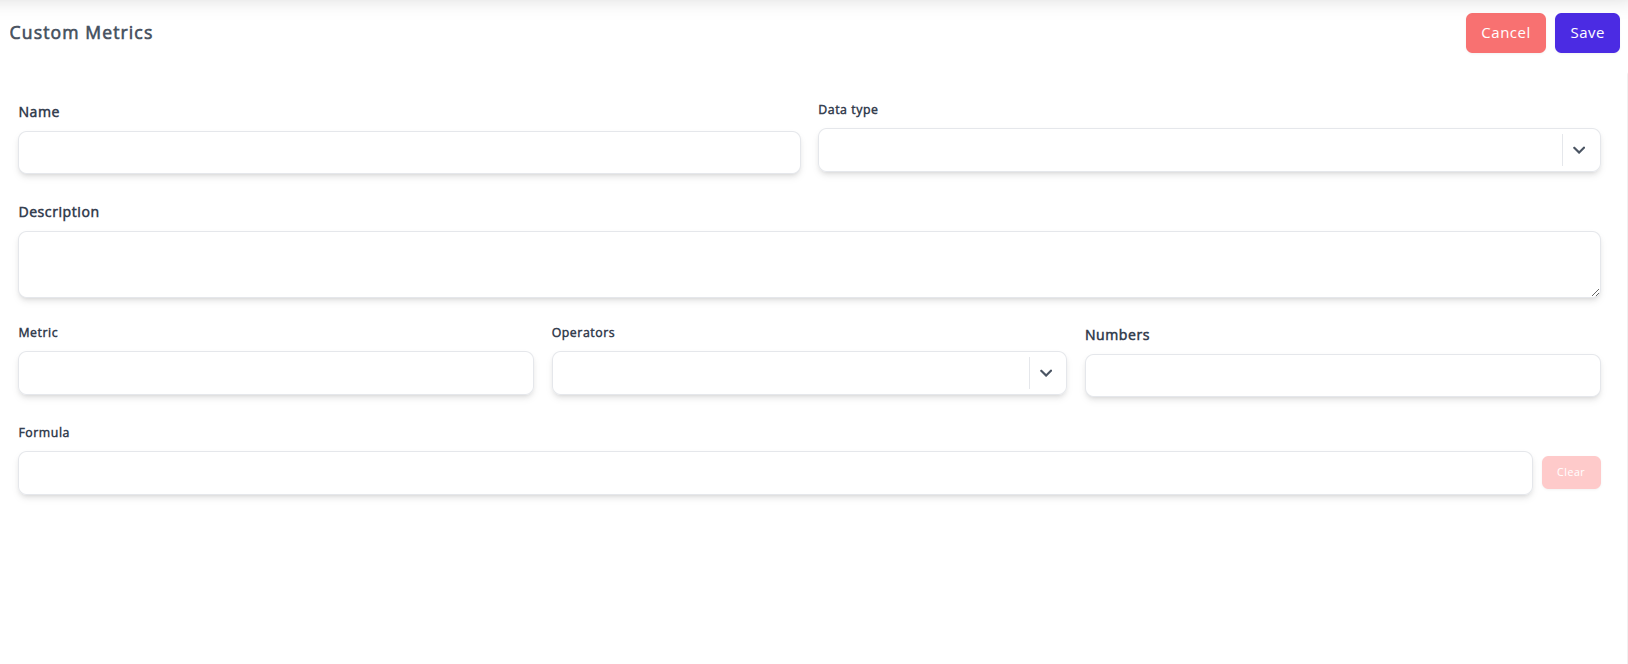
-
Name: Give your metric a clear, descriptive name (e.g., "Total Marketing Spend," "Lead to Purchase Rate"). This is the name that will appear in your widgets and reports.
-
Data Type: Select the appropriate format for the final output:
-
Integer (Whole Number)
-
Float (Number with decimal places)
-
Currency (Requires selecting a currency)
-
Percent
-
Description (Optional): Add a brief explanation of the formula or its business use for internal reference.
-
Build the Formula:
Use the Smart Formula Editor to construct your calculation.
Insert Metrics: Begin typing or use the provided dropdown to select metrics from your connected data sources. For example, to calculate ROAS, you might select Sales (from Shopify) and Cost (from Google Ads).
-
Add Operators: Use mathematical operators (+, −, ×, ÷) and parentheses to define the order of operations.
4.Click on the 'SAVE' button to finalize the custom metric. The new metric will now be available for use in all your dashboards and reports under Custom Metrics Widget.
-
How to Use a Custom Metric
Once created, Custom Metrics are available to a dashboard just like any standard metric.
-
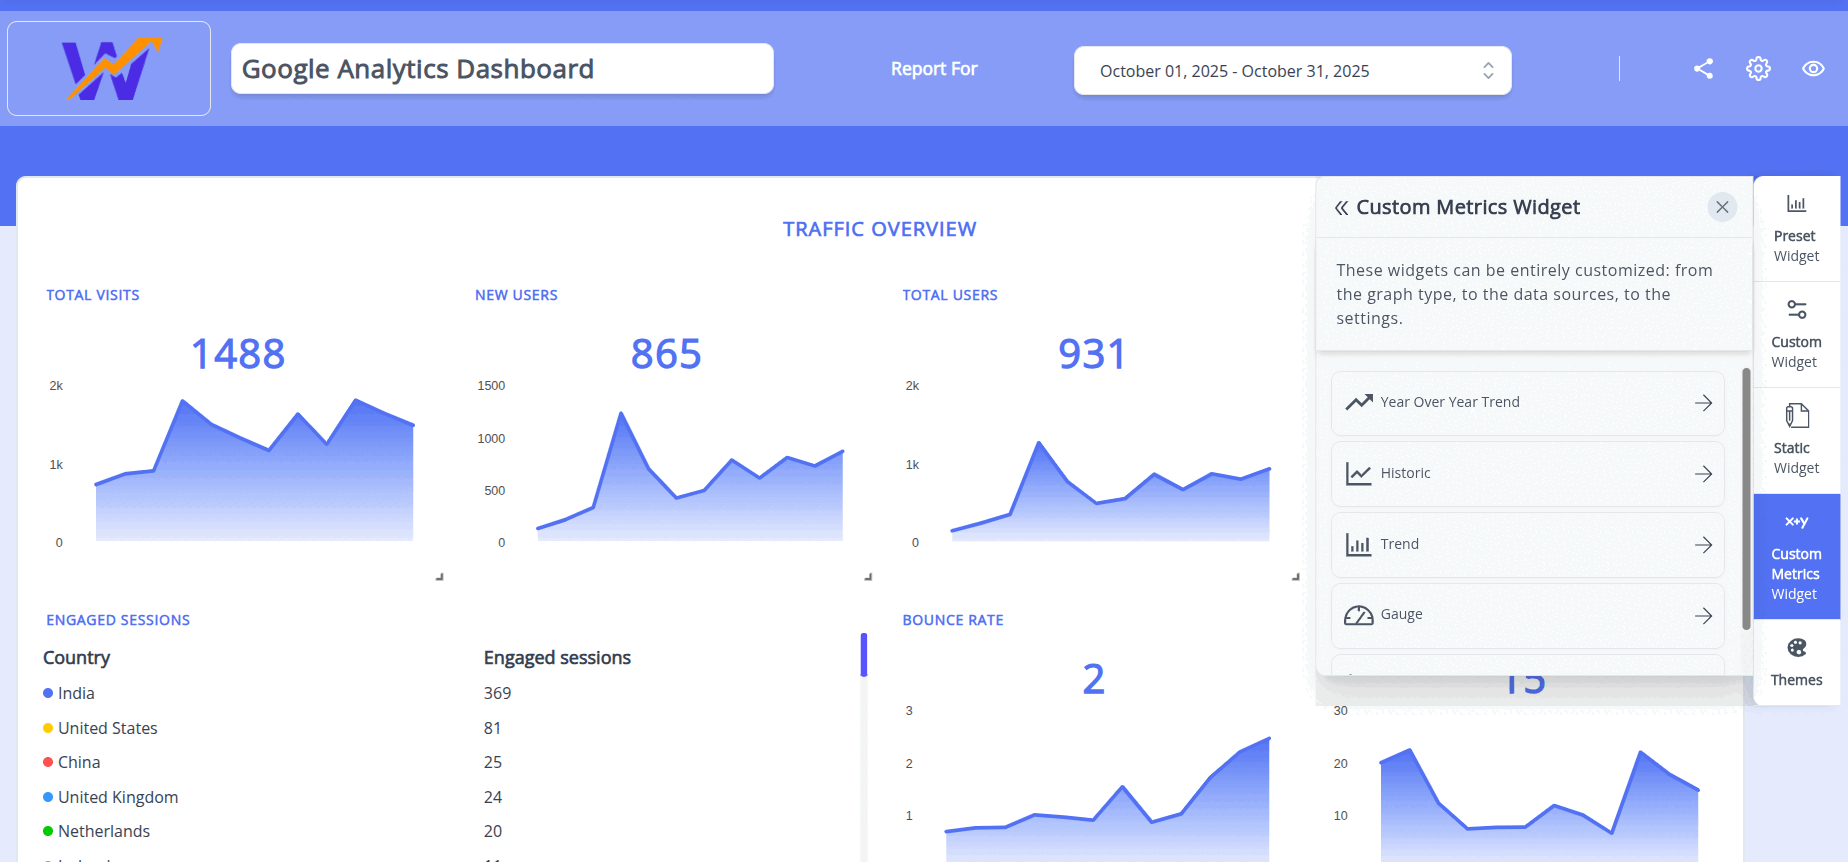
Open your Dashboard : Open the desired Periodic Dashboard or Campaign Dashboard from the Dashboard Page.
-
Add a Widget : Click on Custom Metrics Widget option.Choose your named Custom Metrics and the widget will be added in the dashboard
-
Display : The widget will load, with the data calculated using the formula of the custom metrics and display the result according to the Data Visualization Type you selected.