Campaign Dashboard
What is a Campaign Dashboard?
The Campaign Dashboard is a specialized reporting dashboard designed for analyzing performance data that is not tied to fixed calendar intervals, but rather to a specific, singular initiative, project, or event that has its own unique start and end dates.
Benefits of Campaign Dashboard
-
Custom Timeframes: Campaign Dashboard allows you to define a custom start date and end date that perfectly matches the duration of your campaign (e.g., a 45-day product launch, a weekend flash sale, or a specific quarter-long project).
-
Scope Your Success: Campaign Dashboard focusses on the analysis of a single project or initiative with custom start and end dates.It lets you precisely track the specific KPIs and goals of that initiative, filtering out irrelevant data for clear performance measurement.
-
Flexibility: It retains the same metrics and layout regardless of the specific dates chosen, allowing you to use the same template for multiple sequential or concurrent campaigns.
-
Cross-Campaign Templates: You can create a perfect Campaign Dashboard layout for a specific type of initiative (e.g., "Standard Social Media Campaign") and then apply that layout as a Custom Template to every new, unique social media campaign you launch.
Steps: Creating and Using a Campaign Dashboard
Follow these steps to set up and analyze a specific initiative using the Campaign Dashboard.
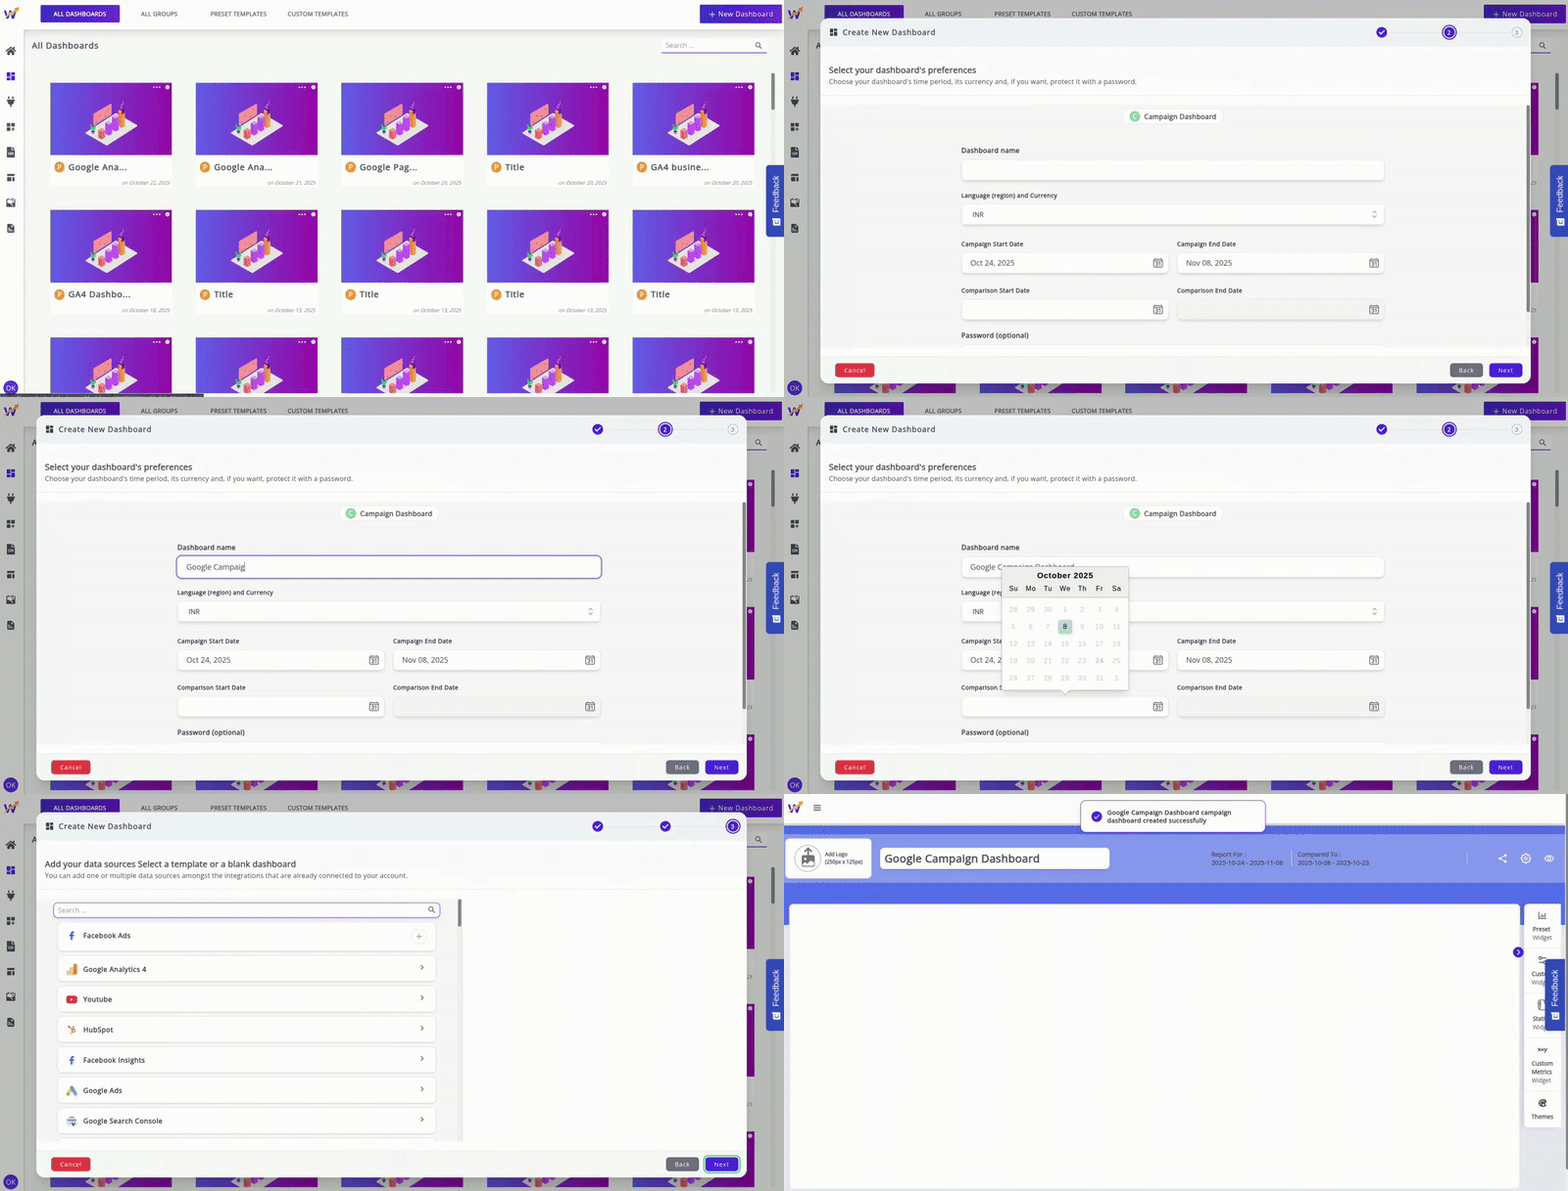
Step 1: Create a New Campaign Dashboard
1.Click on the 'New Dashboard' button in the Dashboards Page.
2.On the Create New Dashboard screen,you get two categories of dashboards- 'Periodic Dashboard' and 'Campaign Dashboard'.
3.Choose 'Blank Campaign Dashboard' or any Preset Template for your campaign dashboard .
4.Name Your Dashboard .
5.Select your Campaign Start Date and Campaign End Date on clicking the calender icon.
6.Select your Comparison Start Date and Comparison End Date for Comparison Analysis (Optional)
7.Secure your Dashboard with password.(Optional)
Step 2: Add Data Sources
1.On naming the Dashboard,choose the desired integrations and connect the data sources (e.g., Shopify).
2.Choose Multiple integrations also at once in single dashboard.
Step 3: Add Widgets and Metrics
1.Once the blank campaign dashboard loads, add the widgets from either Preset Widgets or Custom Widgets or Static Widgets in the dashboard.
2.While configuring each widget, ensure you select metrics relate to the campaign's goals .
3.Create new widgets to add in the dashboard using the Custom Metrics Widgets.
4.Arrange and Customize the widgets into a logical flow, using headers to define sections.
Step 4: Standardize Campaign Reporting:
1.Perfect your ideal analysis view once, then use the 'Save as Template' option to save the layout for future use. You can then instantly deploy this template for the next campaign, only needing to adjust the dates and potentially the data source filters.
