Custom Metrics Widget
The Custom Metrics Widget is designed for advanced users who need to visualize metrics that have been explicitly defined and created within the Whatsdash platform.Unlike standard widgets that pull default metrics from integrations, this feature focuses purely on visualizing these pre-calculated values.
What are Custom Metrics Widgets?
Custom Metrics Widgets are specialized widgets in the dashboard which is dedicated in displaying the custom metrics you have engineered. They offer a simple, dedicated interface for selecting a visualization type and applying only the necessary custom metric data.
-
Metric-Only Focus: This widget is specifically engineered to visualize your custom, user-defined metrics. It does not handle complex data dimensions or group-by operations; its purpose is to display a single, significant calculated value.
-
Explicit Creation: The metrics used here must be pre-created in the Custom Metrics section of Whatsdash before they can be selected and visualized.
How Custom Metrics Widgets Work
Follow these steps to quickly visualize your pre-defined custom metrics on your dashboard:
-
Start Building (Edit Mode)
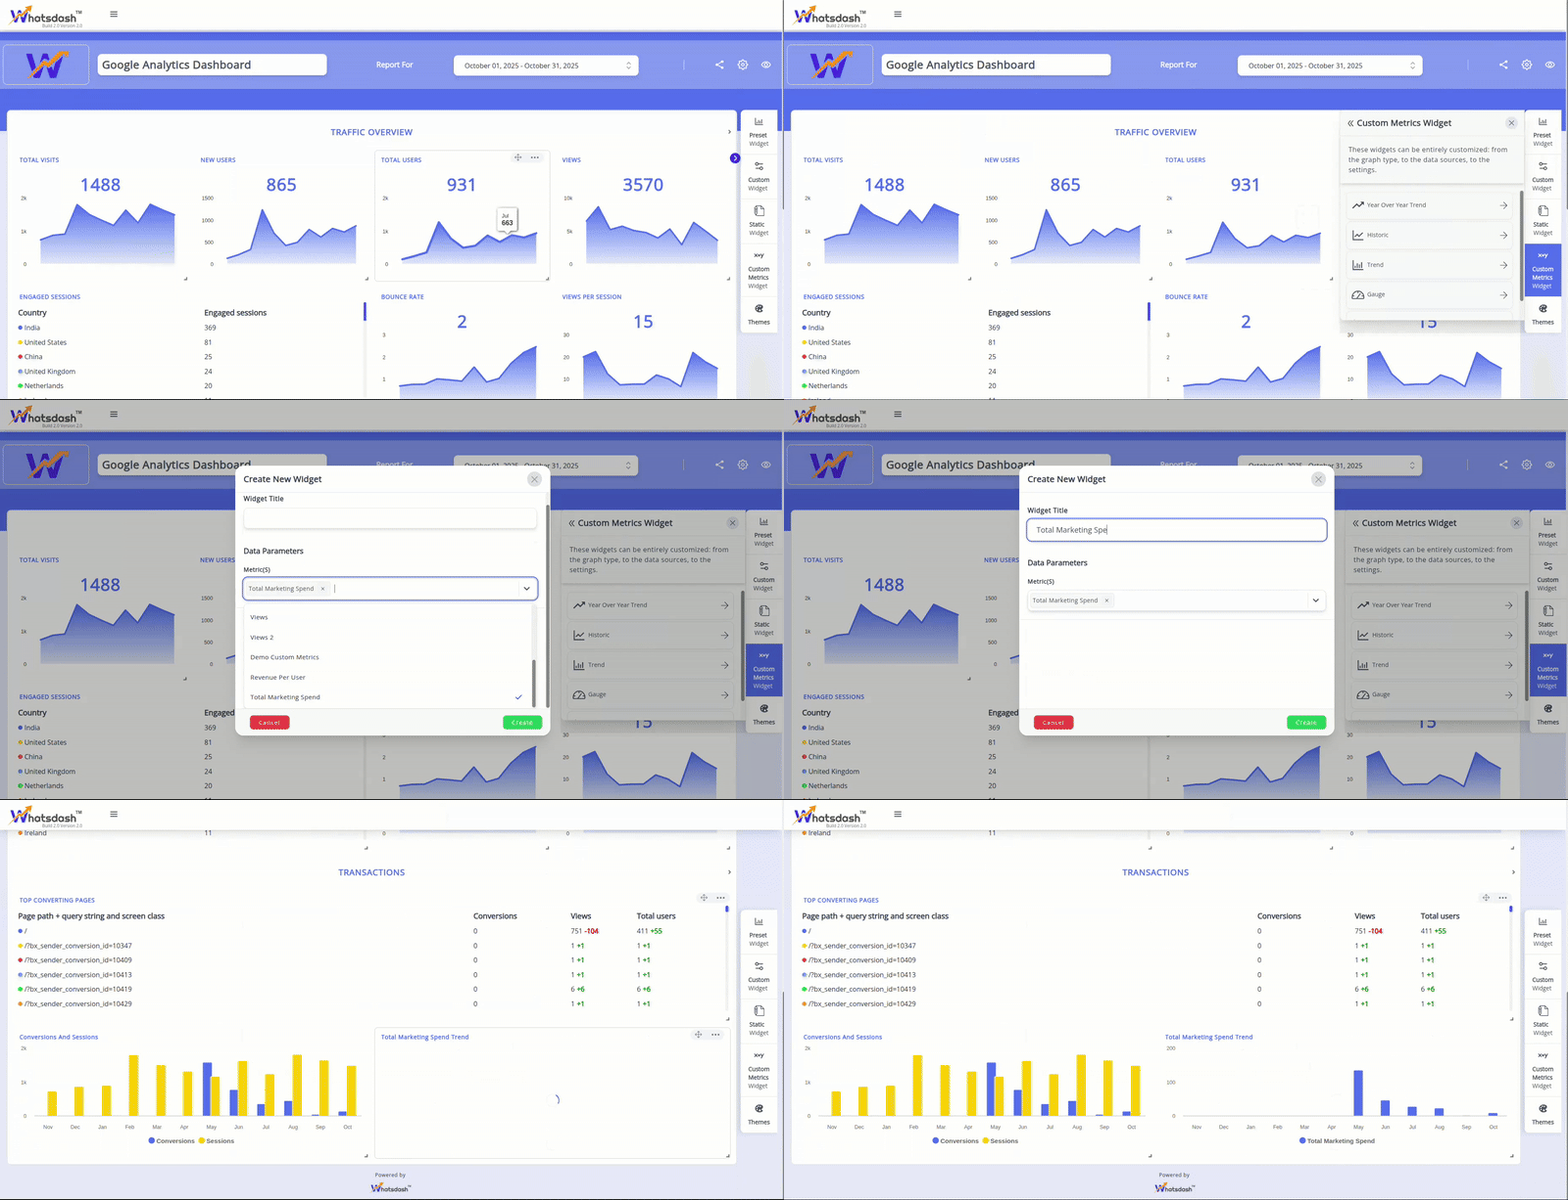
1.Once the dashboard is created from the Dashboard Page, you will automatically land in the blank dashboard in Edit Mode.
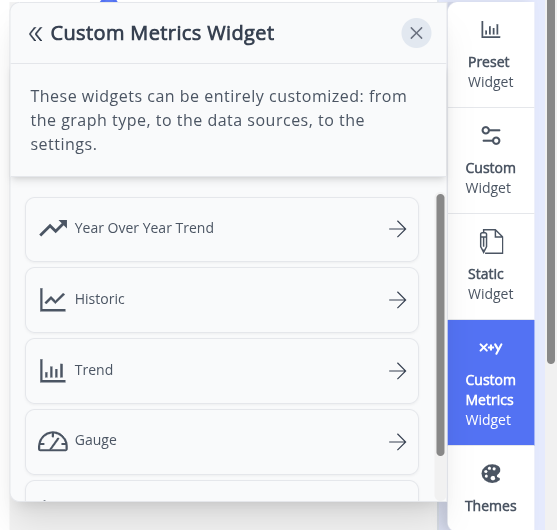
2.For adding widgets, you can choose from Preset Widget, Custom Widget, Static Widget, and Custom Metrics Widgets from the right side of the screen.
3.In Edit Mode, click the 'Custom Metrics Widget' option.
-
Select Custom Metrics Widget
1.On clicking the 'Custom Metrics Widget' option, a list of visualization types appears that are specific to metrics of the connected integration.
2.Select the desired visualization format from the available list.The following visualization type are included:
-
Number Widget (Gauge, List, Number): Ideal for displaying the calculated value.
-
Trend Chart (Historic, Year Over Year Trend, Trend): Suitable for showing how the calculated value has changed over time.
3.A list of all available, pre-defined custom metrics will be displayed. Choose the specific metric you wish to visualize.
-
-
Place on Canvas:
1.Once the visualization type and the custom metric are selected, the widget is automatically generated.
2.You can then resize it and drag and drop it to the desired position.


